Abstract
This perspective article highlights recent developments in a class of surface-enhanced Raman scattering (SERS) experiments that aim to correlate SERS enhancement factors with the physical parameters of metal nanostructures. In a typical study, the SERS substrate is fabricated by depositing colloidal nanoparticles on a silicon wafer to obtain individual particles isolated from each other, or small aggregates such as dimeric units. With the help of registration marks, the same nanoparticle, or dimer of nanoparticles, can be quickly located under a Raman microscope (for SERS spectra) and a scanning electron microscope (for structural characterization). The nanoscale characterization achieved by these studies has resulted in unparalleled investigations into the nature of polarization dependency for SERS, the hot spot nature of single nanoparticles and dimers, and the manipulation of hot spots through shape-controlled synthesis and self-assembly. We discuss the new insights these studies have offered, and the future progress they can deliver to the advancement of SERS.
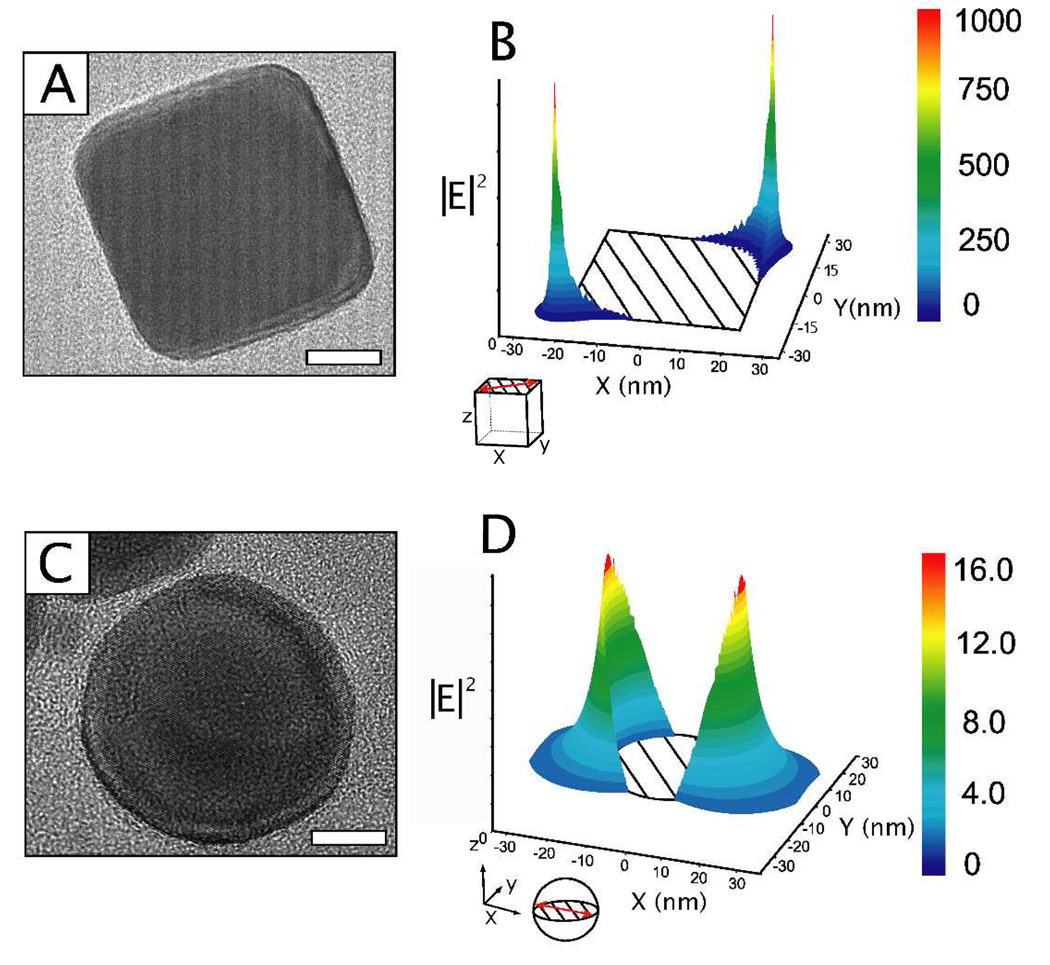
Surface-enhanced Raman scattering (SERS) is a fascinating process by which normally weak Raman signals can be amplified by many orders of magnitude.1 This impressive enhancement is mainly caused by the enhanced, light-induced electric fields (E-fields) on the surface of a metallic nanoparticle (Figure 1). When the incident light is in resonance with the oscillations of conduction electrons in a metallic nanoparticle, all the conduction electrons will be driven to oscillate collectively in an optical phenomenon known as localized surface plasmon resonance (LSPR).2 The LSPR is responsible for the strong scattering and absorption of light typical of a metallic nanoparticle; it is also responsible for generating the enhanced local E-fields on the surface of a nanoparticle at sites known as “hot spots”. Molecules within hot spots experience enormous enhancement in terms of their Raman scattering cross section, and in some cases single molecule detection is possible.3,4 This superb sensitivity has been a catalyst for the resurgence of SERS studies in recent years. These studies have focused on understanding the mechanisms of SERS and, equally, how to implement this technique as a reliable method for trace detection.5,6 Both thrusts have resulted in evolution of SERS experiments to studies characterized by a high level of scrutiny and control at the nanometer level.7–9 SERS is, after all, a nanoscale phenomenon and to fully understand it one must take into account the myriad of subtle variables that have mired SERS studies from the very beginning.
Figure 1.
Comparison of the E-field enhancement (|E|2) contours for a silver nanocube (A–B) and a silver nanosphere (C–D). The difference in particle shape can be clearly seen in the TEM images in (A) and (C). The corresponding |E|2 contour plots show the enhanced E-fields will be localized at the corners of the nanocube and are much larger compared with the nanospheres. The cartoon at the bottom of each contour plot shows the plane of the nanoparticle represented by the calculated |E|2 contour plot. For (B) the incident light is along the z-axis and the polarization (red arrow) is along the y =×direction and for; (D) the incident light along the z-axis and polarization along the x-axis. Copyright (2009) ACS.
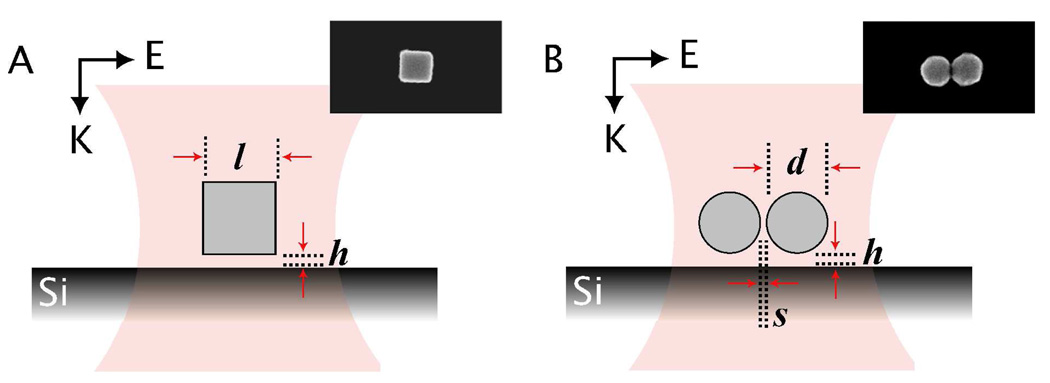
It is with this goal in mind that correlated-SERS studies have been introduced and further developed into a prominent methodology. Correlated-SERS studies feature full characterization of the nanoparticle from which the SERS is supposed to originate, allowing for investigation of what specific variables of the nanoparticle determine the enhancement in SERS as illustrated in Figure 2.7–15 In these studies, one typically records SERS signals from individual, well-defined nanostructures, including chemically synthesized particles, lithographically fabricated structures, and dimers formed from particles or fabricated via lithography. The SERS are then correlated to the physical parameters (like the diameter of a spherical particle, d, or the separation between two neighboring particles, s, both shown in Figure 2) of the same nanostructure resolved using a high-resolution imaging tool. This kind of study is in contrast to early work where the specific nanostructure(s) probed by SERS was typically not investigated in detail.
Figure 2.
Schematic of two typical correlated-SERS measurements where in (A) a single silver nanocube and (B) a single dimer of silver nanospheres on a Si substrate are excited by a focused laser beam for SERS and then imaged by SEM (see the inset) to determine the parameters of the nanostructure. In correlated-SERS, one nanostructure is probed at a time with SERS, followed by characterization at the nanoscale to reveal the orientation with respect to the laser polarization (E) and variables like the edge length (l) for the nanocube in (A) or the diameter (d) of the nanospheres in (B). The particle to substrate distance (h) is also important, and for a dimeric structure, the particle-to-particle separation (s) often requires high-resolution imaging tools as the typical value is smaller than 5 nm. These represent just some of the variables that correlated-SERS measurements seek to include in the investigation.
The studies discussed herein focus on just one silver nanoparticle or dimer at a time, enabling a high level of characterization that has confirmed what could only be achieved theoretically before, including the effect of polarization,16–18 the effect of sharp features on a nanoparticle,13,19 and the hot spot within a dimer.8,10,19,20 Such correlated characterization has also allowed for an unprecedented integration of experimental data with simulation results,7,8 and perhaps most importantly has shown new engineering pathways for the fabrication of simple and reproducible hot spots for SERS applications.12,21
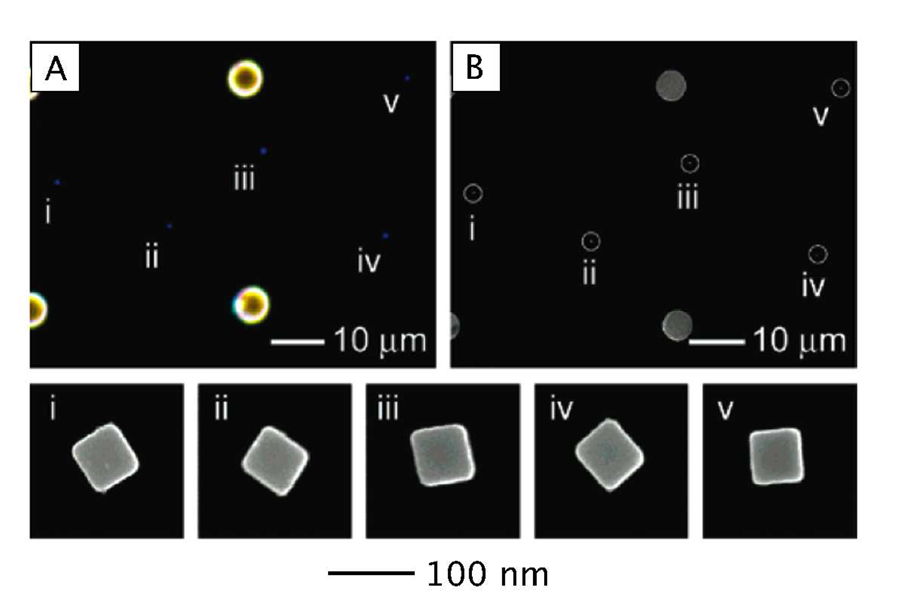
Early studies involving correlated-SERS with silver or gold nanoparticles simply determined if the colloidal particles sampled under a Raman microscope were in an aggregated or dispersed state, which at the time was a significant advancement.3,4,22 Recent correlated-SERS studies rely on the use of transmission electron microscopy (TEM),8 scanning electron microscopy (SEM),13 and/or atomic force microscopy (AFM)10 to quantitatively determine structural variables like size, shape, and particle-to-particle separation (see Figure 2), in contrast to simply determining the gross characteristics of the nanoparticle. Correlated-SERS studies inherently require that the nanoparticle under investigation has a fixed, knowable position and orientation with respect to the laser spot and polarization, and that the particle can be located with both a Raman system and a high-resolution imaging system like SEM. In studies involving colloidal particles, the sample is typically deposited on a substrate and the Rayleigh scattering from an individual particle under a dark-field objective is used to locate the particle under a Raman microscope.13 Experiments have also been conducted to correlate the Rayleigh scattering properties of a nanoparticle to the SERS activity, but no quantitative relationship was found. As a result, Rayleigh scattering is only used to identify the nanoparticle’s location in current correlated-SERS studies.8,10,11,23 Figure 3 shows a simple approach we recently demonstrated, where registration marks are used to locate individual nanoparticles under the Raman and electron microscopes. Figure 3A shows a dark-field optical micrograph taken from a region containing a number of silver nanocubes (the blue dots labeled i–v) and several registration marks (the larger yellow spots). Figure 3B shows an SEM image captured from the same region. The nanocubes are also circled and labeled in the SEM image to help identify them. SEM imaging can reveal the size of each nanocube, its orientation with respect to the laser polarization, and other parameters such as corner sharpness. The LSPR properties and SERS intensities are dependent on all these parameters. The nanoscale characterization is also necessary for estimating the SERS enhancement factor (EF) of a nanoparticle, which is an important aspect of correlated-SERS studies. Typically the EF is defined as below:
where Isers and Inormal are the intensities of the same band for the SERS and normal Raman spectra, Nnormal is the number of molecules probed for a normal Raman measurement, and Nsers is the number of molecules probed in SERS. When combined with knowledge of how the Raman probe molecule binds to the nanoparticle, the nanoscale characterization of correlated-SERS studies allows one to quickly estimate the Nsers.
Figure 3.
(A) Dark-field optical micrograph of a Si substrate with registration marks (large yellow spots) and a number of individual silver nanocubes (small blue dots) labeled i to v; and (B) SEM image of the same region as shown in (A). Below (A) and (B) are the SEM images clearly resolving the morphology and orientation of each individual nanocube. Copyright (2007) ACS.
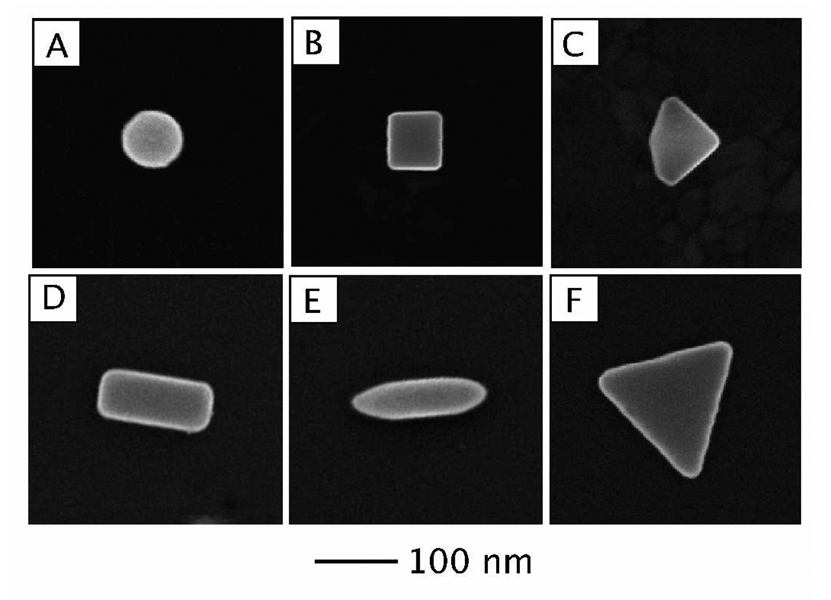
Correlated-SERS studies have emerged with developments in nanolithography and synthesis of metal nanoparticles having controllable compositions, sizes, and shapes. The well-defined nanostructures are the impetus for correlated studies, as their engineered features result in a controllable LSPR that can be manipulated during a synthesis or nanofabrication process.24 Controlling LSPR properties is key to optimizing SERS, as plasmon resonances are responsible for generating the strong local E-fields necessary for SERS, and in terms of controlling the LSPR, shape engineering of nanoparticles has provided an efficient handle. Figure 4 shows some of the silver nanoparticles synthesized in our group through the bottom-up, polyol method, where AgNO3 is reduced in ethylene glycol to form nanoparticles with well-controlled shapes. Shapes like cube, bar, and spheroid or rice (Figure 4, B, D, and E, respectively) have sharp tips and corners, which give these structures an edge over spherical and quasi-spherical particles in terms of their ability for SERS under dipolar plasmon resonance conditions. Correlated-SERS studies of nanobars and nanorice indicate that nanorice report larger SERS intensities,25 and a comparison of nanocubes and nanospheres reveals a similar trend, where the cubes have stronger SERS than the spheres.26 Theoretical studies (Figure 1) demonstrated early on that SERS intensities are much higher for particles with high surface curvatures or sharp tips and corners in part because E-fields near these regions will be intrinsically higher for high curvature (known as the lightning rod effect). In addition, the red-shifted LSPR (compared with spherical particles) can have a narrower resonance, and do not suffer from interband transitions.27 As a result, non-spherical nanoparticles have steadily become the focus of SERS studies, as their availability and ease of synthesis or fabrication have increased.
Figure 4.
SEM images of individual silver nanoparticles that we have synthesized using the polyol and related methods: (A) sphere, (B) cube, (C) right bipyramid, (D) bar, (E) spheroid (or rice) with two sharp ends, and (F) triangular plate with a thickness of 15 nm.
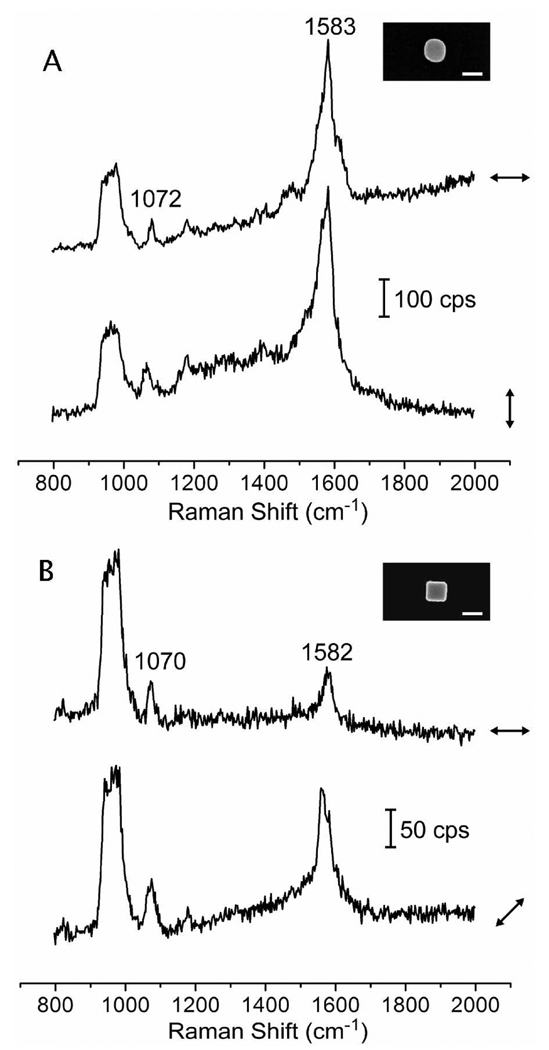
Currently, one of the most important contributions of correlated-SERS studies is the clear dependency of SERS EFs on laser polarization. These studies had their origins in large aggregates,28 then dimers,18 and more recently for individual nanoparticles. Single nanoparticles have become more complex, and their optical properties have as well, allowing for the creation of single nanoparticles with large SERS EFs and significant polarization dependencies.13,20 Figure 5 shows a comparison study of the polarization dependency for silver nanocubes and nanospheres. For the nanosphere (Figure 5A), due to its isotropic nature there is no dependence on polarization, as the surface plasmon will oscillate similarly in all directions. Figure 5B shows the SERS spectra of 4-methyl benzenethiol (4-MBT) on silver nanocubes with two different laser polarizations. In this case, the largest SERS EF is recorded when the nanocube is oriented with a face diagonal axis parallel to the laser polarization, in contrast to polarization parallel to one of the cube’s edges. For nanoparticles with sharp features, typically the strongest SERS intensities are seen when the polarization is along an axis that connects two sharp features, which is the case in Figure 5B, and also for nanorice.25 Other factors must also be considered, including the excitation wavelength and LSPR peak (which can split as the nanocube approaches a dielectric surface).29 Complex, anisotropic nanoparticles will continue to gain widespread use in SERS and they have the potential to eliminate the necessity of dimers or other compound structures that, while good for SERS, can be difficult to fabricate, and might be too big or impractical for in vivo applications.20
Figure 5.
SERS spectra of 4-methyl benzenethiol (4-MBT) from an individual silver nanosphere (A) and nanocube (B), respectively. Each arrow indicates the laser polarization direction relative to the nanosphere or nanocube in the SEM image. For the nanosphere, no significant variation was observed for the spectra taken at different polarization directions. For the nanocube, the SERS signals were more strongly enhanced when the laser was polarized along a face diagonal (bottom trace in B). The insets show SEM images of the probed nanosphere and nanocube. The scale bars in the insets correspond to 100 nm. Copyright (2009) Elsevier.
Silver and gold nanowires have also been the subject of considerable correlated-SERS studies of the polarization effect.7,11,12,14,16 The relatively large size of nanowires is a drawback, as they often have one dimension on the micrometer scale. This can have an attenuating effect on SERS and, indeed, previous studies of single nanowires and paired nanowires do not report large EFs .11,12,14 This large dimension also introduces polarization dependencies because typical SERS excitation sources cannot couple with the longitudinal plasmon mode of the nanowire to generate an LSPR.11 However, the transverse mode, which has dimensions on the nanoscale, shows a strong plasmon resonance and SERS activity. Interestingly, excitation at the tips of a nanowire vs. the center shows a considerable difference in SERS intensity and, also, polarization dependency.12,30 These observations can be explained through particle-substrate plasmon coupling because the surface plasmon of a nanoparticle can interact more strongly with the substrate when it has a component normal to it, hence generating larger SERS intensities. The induced E-fields of the nanowire for longitudinal polarized light will not have a component normal to the surface in the center of the wire, however, at the tips, the E-fields will follow the surface curvature of the nanowire and thus can partially interact with the substrate creating hot spots between the nanowire and the substrate.12 Such studies show the value of correlated-SERS studies, where new design rules for hot spots can be gleaned from careful experiments.
While studying the SERS of individual nanoparticles is a necessary step in the design of SERS substrates with large EFs, currently there has been no report of single molecule detection capability for single nanoparticles. However, combining two nanoparticles, or fabricating a paired structure via lithography, can lead to extremely large SERS EFs. Early theoretical studies predicted electromagnetic hot spots31 and early correlated-SERS experiments with metal colloids suggested that these hot spots, which allow for single molecule detection, were a consequence of closely spaced nanoparticles.22 Many studies since then have shown that, indeed, nanoparticle aggregates are largely responsible for the detection of single molecules and their small (<2 nm) interparticle gaps are areas where hot spots are located. However, studying the random assembly of irregularly shaped nanoparticles cannot lead to any design rules for better SERS substrates. Simpler aggregates must be studied, and the simplest form of aggregation is a dimer. A dimer of silver nanoparticles can detect single molecules,8 as well as lithographically generated bowtie structures,32 and their simplicity allows for easy determination of the polarization dependency for both the SERS and LSPR properties.16,18 LSPR properties change significantly when two nanoparticles are brought in close proximity, and the changes are intricately related to the geometry of the dimer.33 For example, when two silver spheres (d = 36 nm) are brought together along an interparticle axis with (s = 2 nm), two distinct LSPR peaks will appear: one at 520 nm associated with polarization parallel to the interparticle axis, and the other at 430 nm associated with polarization parallel to the interparticle axis. For a dimer of triangular prisms, when the laser is polarized along the interparticle axis, the LSPR peak red-shifts relative to single prism from 653 nm to 932 nm. The LSPR peaks remain similar to the single prisms at polarizations perpendicular to the interparticle axis of the triangular prism dimer. In both systems, the LSPR peaks associated with polarization perpendicular to the interparticle axis are not particularly sensitive to plasmon coupling, and represent quadrapole plasmon resonance modes. LSPR peaks associated with the polarization parallel to the interparticle axis represent dipolar plasmon resonances and these LSPRs are responsible for the strong local E-fields.33
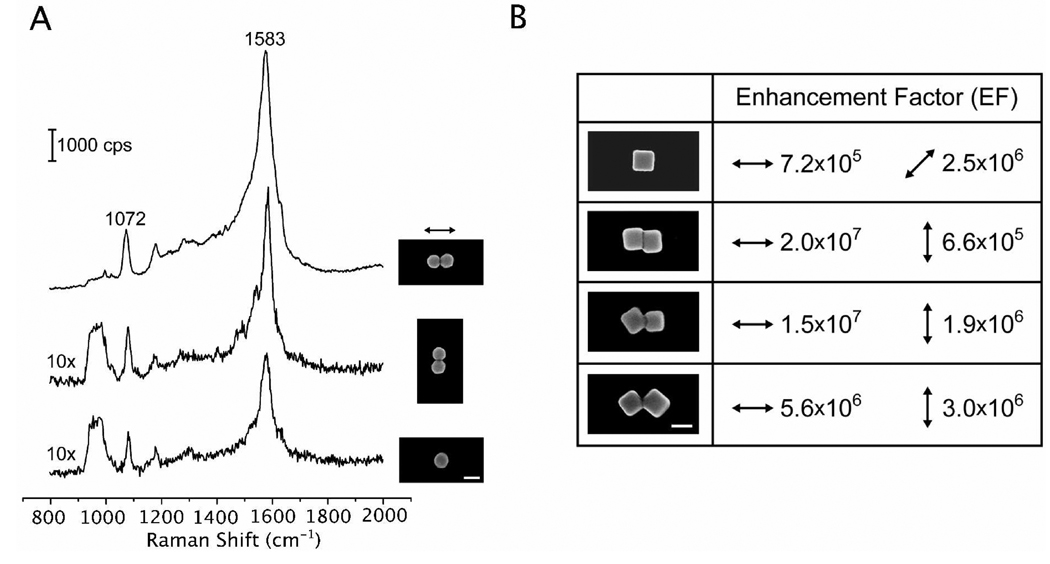
Much like the non-spherical nanoparticles discussed above, in order to optimize the SERS from a dimer, the polarization of the laser must match the geometry of the dimer that creates strong local E-fields. As a consequence, dimers need the polarization of the laser along the axis that connects the two particles, as discussed above, with a key feature being the interparticle gap between the two components. For a molecule located in the gap with light polarized along the interparticle axis, the proximity of the molecule to the surface charges (and E-fields) is extremely small resulting in large SERS EFs. Furthermore, the coupling between the plasmons of the two components in the dimer results in large local E-field enhancement near the interparticle gap.1,33 Neither of these factors can contribute significantly to SERS when the light is polarized perpendicular to the interparticle axis. Figure 6A shows this dependency, where the SERS spectra of 4-MBT taken from a dimer of silver nanospheres is shown at two polarizations, parallel and perpendicular to the interparticle axis. The SERS spectrum of 4-MBT taken from an individual sphere is also shown for comparison. There is an order of magnitude difference in the measured SERS EFs for the different polarization directions. Similarly, in Figure 6B, dimers of silver nanocubes reveal a similar trend, showing that the shape of the building blocks for the dimer does not affect this polarization dependency although it can affect the LSPR wavelengths.
Figure 6.
(A) SERS spectra taken from 4-methyl benzenethiol (4-MBT) immobilized on a dimer of silver nanospheres (at two different polarizations) and on a single silver nanosphere. (B) Summary of the SERS EFs calculated for individual silver nanocubes, and their dimers in face-to-face, edge-to-face, or edge-to-edge configuration. The samples were functionalized with 4-MBT. Each arrow indicates the laser polarization with respect to the corresponding SEM image. The scale bars represent 100 nm. Copyright (2009) Wiley-VCH. Reprinted with permission.
A variety of different dimers formed from nanoparticles and by lithographic methods have been studied by correlated-SERS, including spheres,10,19 cubes,34 wires,11,14 disks,7 and bow-tie structures.9,15,32 Typically, spherical dimers (with EFs in the range of 106–108) are not as SERS active as other types of dimers consisting of non-spherical particles, like the bow-tie structure, which reports EFs near 1010. For dimers of silver nanocubes in Figure 6B, the highest EF is near ~107. For these dimers, the EF is contingent both on the laser polarization as well as the configuration of the dimer. The difference in EFs for the nanocube dimers with face-to-face, face-to-edge and edge-to-edge configurations is significant, as well as the fact that the edge-to-edge configuration did not report the largest EF. While this is thought to be due to the number of molecules in the hot spot of the dimer,34 such differences require further investigation, but are typical of correlated-SERS studies, and serve as starting points for inquiry into new important variables in the SERS effect. In this case the way the nanoparticles are functionalized, and contributions from the substrate, can both affect the SERS signals recorded from supported nanoparticles, which is the focus of our future work. Because correlated-SERS studies are able to control many of the variables in a SERS measurement, often interesting results can be obtained. This is particularly true for studies of dimeric structures. In some cases, large (~30 nm) gaps between the components in a dimer were found to report the strongest SERS,7 or no polarization effect was detected at all.9 In general, such studies which take into account the variables of the nanostructures that lead to large SERS EFs, will continue to provide important leads to discoveries, due to the large gap in fundamental knowledge relating SERS EFs to its underlying structures.
The prospects of new developments in correlated-SERS studies remain high. These studies are poised to redefine current notions of SERS hot spots, develop techniques for isolation of hot spots, and also improve correlated-SERS measurements themselves. It is commonly held that “strong” hot spots can only be formed in the gaps between nanostructures. However, correlated-SERS studies have begun to show that the substrate can play a major role in the formation of hot spots too. Potentially, instead of assembling nanoparticles to create hot spots, simply depositing them on an appropriate substrate can create a hot spot between the nanoparticle and the substrate.12,21 New nanoparticles like gold nanostars, which have tips in all directions, could be ideal for such applications.35 Whether or not such hot spots will have single-molecule sensitivity for SERS remains to be demonstrated experimentally or theoretically. Theoretical work relevant to correlated-SERS studies should start to deal with the substrate, including its effect on local E-field enhancement, and the plasmonic coupling between a metallic nanoparticle and metallic substrate.36 Recent results suggest that for comparison of the far-field properties of a single nanocube with calculations, numerous structural variables needed to be determined at the nanometer level to achieve an agreement between theory and experiment.29 Theoretical calculations and correlated-SERS studies have much to offer each other, however, both will be limited by the degree of characterization at the nanometer level.
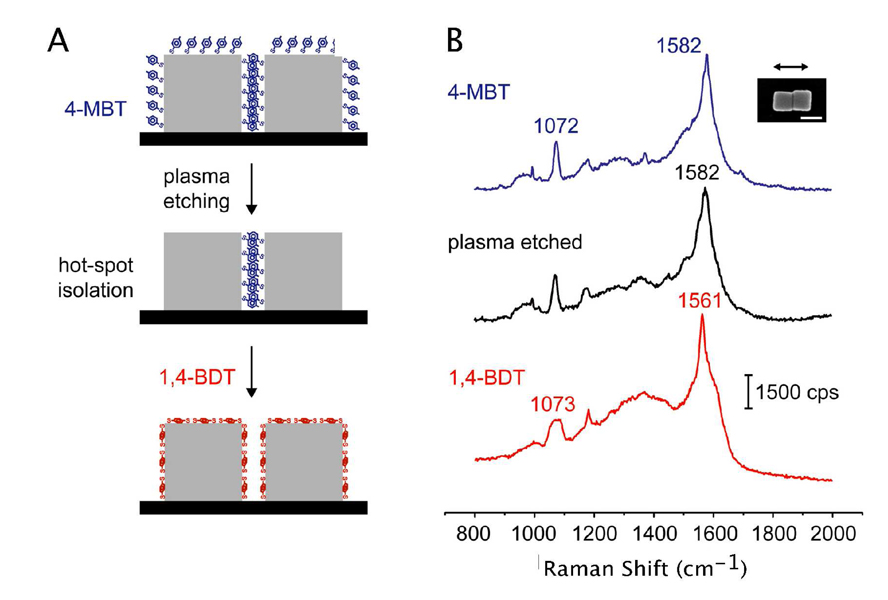
Similarly, different methods of isolating the hot-spot region represent another new strategy for simple, high fidelity SERS substrates, and for fundamental investigations into SERS. Hot spots are areas of intense local E-fields which are responsible for 24% of the SERS signal, but represent only a small fraction of the probed molecules.37 Positioning molecules only in the hot-spot region remains a grand challenge to SERS studies. Isolation of hot spots can be achieved by either blocking the cold regions on a nanostructure, or by only placing the molecules at hot spots without blocking other regions of the nanostructure. Figure 7 shows an example of the latter method, where molecules in the hot spot region formed between two silver nanocubes are isolated. Plasma etching can selectively remove the molecules on a nanoparticle’s surface, keeping molecules protected by the substrate or another nanoparticle.38 As shown in the schematic (Figure 7A), the silver nanocubes formed a dimer via capillary interactions during solvent evaporation, and were subsequently plasma etched to remove the molecules on the outer surface while maintaining the molecules between the cubes in the hot spot region. In contrast, photoresist can block areas of low enhancement, revealing only the hot-spot regions for molecular absorption.39 Isolation of hot spots can eliminate the attenuating effects of the broad distribution of SERS EFs, essentially only allowing for a few molecules to absorb in the hot-spot region. However, for molecules in hot spots, their orientations relative to the nanostructure and the incident laser field will have an enormous impact on the EFs, which poses additional challenges and opportunities in SERS. This effect can be used to characterize the nature of the hot spot, and determine if the blinking is from one molecule or two.40 Single-molecule SERS, while clearly demonstrated in a number of studies, remains an active area of research, particularly in terms of its implementation.
Figure 7.
Probing the hot spot within a dimer of silver nanocubes. (A) Schematic of the approach employed for selectively probing the hot spot region formed between a pair of silver nanocubes. The dimer was functionalized with 4-methyl benzenethiol (4-MBT) and then exposed to plasma etching to remove the adsorbed 4-MBT molecules. In this case, only the 4-MBT molecules outside the hot spot region (i.e., outside the two touching faces) were removed during the plasma etching. The nanocube dimer was then immersed in a 1,4-benzenedithiol (1,4-BDT) solution, resulting in the complete replacement of 4-MBT by 1,4-BDT over its entire surface. (B) The corresponding SERS spectra, where the middle spectrum represents the SERS signals from molecules in the hot spot region only. The scale bar represents 100 nm. Copyright (2009) Wiley-VCH. Reprinted with permission.
As noted above, correlated-SERS studies first acquire Raman spectra followed by imaging of the SERS nanostructures, due to uncertainties concerning the effect of exposing the structures to an electron beam, or a scanning tip. This approach has a number of limitations for studies involving nanoparticles, primarily because only after the Raman data has been taken can the nanoparticle be characterized and its orientation to the laser polarization determined. This is not a problem for lithographically generated nanostructures, but represents a major drawback for the use of colloidal particles in SERS. New techniques need to be developed that will allow for full characterization and the precise knowledge of the location of interesting nanoparticles on a substrate, followed by acquisition of SERS spectra from the pre-determined particles. Or conversely, with better understanding of the relationship between the scattering property of a supported nanoparticle and its physical parameters, Rayleigh scattering could be used to located desirable nanoparticles for SERS.23 Each approach will allow for new studies that can closely compare various nanostructures with different sizes, shapes, and morphologies to their SERS, which is currently not feasible by selecting random particles through dark-field microscopy. Correlated-SERS studies have a great deal to offer in terms of design rules for engineering SERS substrates, and for providing additional evidence for the mechanisms of the SERS effects. In general the future of such investigations will strive for greater control at the nanometer level, revealing new problems and discoveries that will propel SERS studies forward.
Acknowledgements
This work was supported in part by a research grant from the NSF (DMR-0804088) and a 2006 Director’s Pioneer Award from the NIH (DP1 OD000798). Part of the work was performed at the Nano Research Facility (NRF), a member of the National Nanotechnology Infrastructure Network (NNIN), which is supported by the National Science Foundation under NSF award no. ECS-0335765. NRF is part of School of Engineering and Applied Science at Washington University in St. Louis.
Biography
Younan Xia is the James M. McKelvey Professor of Biomedical Engineering at Washington University in St. Louis. His research interests center on the development of new chemistry, physics, and technological applications for nanostructured materials. His group has pioneered many methods for the chemical synthesis of well-defined and controllable metal nanoparticles, which are then employed to solve problems in biomedical engineering and materials science. See http://www.nanocages.com.
References
- 1.Moskovits M. Surface-enhanced Raman spectroscopy: a brief retrospective. J. Raman Spectrosc. 2005;36:485–496. [Google Scholar]; Haynes CL, Yonzon CR, Zhang X, Duyne RPV. Surface enhanced Raman sensors: early history and the development of sensors for quantitative biowarfare agent and glucose detection. J. Raman Spectrosc. 2005;36:471–484. [Google Scholar]
- 2.Hutter E, Fendler JH. Exploration of Localized Surface Plasmon Resonance. Adv. Mater. 2004;16:1685–1706. [Google Scholar]
- 3.Nie S, Emory SR. Probing Single Molecules and Single Nanoparticles by Surfaced-Enhanced Raman Scattering. Science. 1997;275:1102–1106. doi: 10.1126/science.275.5303.1102. [DOI] [PubMed] [Google Scholar]
- 4.Kneipp K, Wang Y, Kneipp H, Perelman LT, Itzkan I, Dasari RR, Feld MS. Single Molecule Detection Using Surface-Enhanced Raman Scattering (SERS) Phys. Rev. Lett. 1997;78:1667–1670. [Google Scholar]
- 5.Banholzer MJ, Millstone JE, Qin L, Mirkin CA. Rationally designed nanostructures for surface-enhanced Raman spectroscopy. Chem. Soc. Rev. 2008;37:885–897. doi: 10.1039/b710915f. [DOI] [PMC free article] [PubMed] [Google Scholar]
- 6.Qian X-M, Nie SM. Single-molecule and single-nanoparticle SERS: from fundamental mechanisms to biomedical applications. Chem. Soc. Rev. 2008;37:912–920. doi: 10.1039/b708839f. [DOI] [PubMed] [Google Scholar]
- 7.Qin L, Zou S, Xue C, Atkinson A, Schatz GC, Mirkin CA. Designing, fabricating, and imaging Raman hot spots. Proc. Natl. Acad. Sci. 2006;103:13300–13303. doi: 10.1073/pnas.0605889103. [DOI] [PMC free article] [PubMed] [Google Scholar]
- 8.Camden JP, Dieringer JA, Wang Y, Masiello DJ, Marks LD, Schatz GC, Duyne RPV. Probing the Structure of Single-Molecule Surface-Enhanced Raman Scattering Hot Spots. J. Am. Chem. Soc. 2008;130:12616–12617. doi: 10.1021/ja8051427. [DOI] [PubMed] [Google Scholar]
- 9.Ward DR, Grady NK, Levin CS, Halas NJ, Wu Y, Nordlander P, Natelson D. Electromigrated Nanoscale Gaps for Surface-Enhanced Raman Spectroscopy. Nano Lett. 2007;7:1396–1400. doi: 10.1021/nl070625w. [DOI] [PubMed] [Google Scholar]
- 10.Talley C, Jackson J, Oubre C, Grady N, Hollars C, Lane S, Huser T, Nordlander P, Halas N. Surface-Enhanced Raman Scattering from Individual Au Nanoparticles and Nanoparticle Dimer Substrates. Nano Lett. 2005;5:1569–1574. doi: 10.1021/nl050928v. [DOI] [PubMed] [Google Scholar]
- 11.Camargo PHC, Cobley CM, Rycenga M, Xia Y. Measuring the SERS enhancement factors of hot spots formed between an individual Ag nanowire and a single Ag nanocube. Nanotechnology. 2009;20:434020–434028. doi: 10.1088/0957-4484/20/43/434020. [DOI] [PubMed] [Google Scholar]
- 12.Yoon I, Kang T, Choi W, Kim J, Yoo Y, Joo S-W, Park Q-H, Ihee H, Kim B. Single Nanowire on a Film as an Efficient SERS-Active Platform. J. Am. Chem. Soc. 2008;131:758–762. doi: 10.1021/ja807455s. [DOI] [PubMed] [Google Scholar]
- 13.McLellan J, Li Z-Y, Siekkinen A, Xia Y. The SERS Activity of a Supported Ag Nanocube Strongly Depends on its Orientation Relative to Laser Polarization. Nano Lett. 2007;7:1013–1017. doi: 10.1021/nl070157q. [DOI] [PubMed] [Google Scholar]
- 14.Kang T, Yoon I, Jeon K-S, Choi W, Lee Y, Seo K, Yoo Y, Park Q-H, Ihee H, Suh YD, Kim B. Creating Well-Defined Hot Spots for Surface-Enhanced Raman Scattering by Single-Crystalline Noble Metal Nanowire Pairs. J. Phys. Chem. C. 2009;113:7492–7496. [Google Scholar]
- 15.Zheng G, Qin L, Mirkin CA. Spectroscopically Enhancing Electrical Nanotraps. Angew. Chem. 2008;120:1964–1967. doi: 10.1002/anie.200705312. [DOI] [PubMed] [Google Scholar]
- 16.Wei H, Hao F, Huang Y, Wang W, Nordlander P, Xu H. Polarization Dependence of Surface-Enhanced Raman Scattering in Gold Nanoparticle-Nanowire Systems. Nano Lett. 2008;8:2497–2502. doi: 10.1021/nl8015297. [DOI] [PubMed] [Google Scholar]
- 17.Sawai Y, Takimoto B, Nabika H, Ajito K, Murakoshi K. Observation of a Small Number of Molecules at a Metal Nanogap Arrayed on a Solid Surface Using Surface-Enhanced Raman Scattering. J. Am. Chem. Soc. 2007;129:1658–1662. doi: 10.1021/ja067034c. [DOI] [PubMed] [Google Scholar]
- 18.Liu GL, Lu Y, Kim J, Doll JC, Lee LP. Magnetic Nanocrescents as Controllable Surface-Enhanced Raman Scattering Nanoprobes for Biomolecular Imaging. Adv. Mater. 2005;17:2683–2688. [Google Scholar]
- 19.Xu H, K M. Polarization-Dependent Surface-Enhanced Raman Spectroscopy of Isolated Silver Nanoaggregates. ChemPhysChem. 2003;4:1001–1005. doi: 10.1002/cphc.200200544. [DOI] [PubMed] [Google Scholar]
- 20.Li W, Camargo PHC, Lu X, Xia Y. Dimers of Silver Nanospheres: Facile Synthesis and Their Use as Hot Spots for Surface-Enhanced Raman Scattering. Nano Lett. 2009;9:485–490. doi: 10.1021/nl803621x. [DOI] [PMC free article] [PubMed] [Google Scholar]
- 21.Park W-H, Ahn S-H, Kim ZH. Surface-Enhanced Raman Scattering from a Single Nanoparticle-Plane Junction. ChemPhysChem. 2009;9:2491–2492. doi: 10.1002/cphc.200800563. [DOI] [PubMed] [Google Scholar]
- 22.Michaels AM, Jiang J, Brus L. Ag Nanocrystal Junctions as the Site for Surface-Enhanced Raman Scattering of Single Rhodamine 6G Molecules. J. Am. Chem. Soc. 2000;104:11965–11971. [Google Scholar]
- 23.Wustholz KL, Henry A-I, Bingham JM, Kleinman SL, Natan MJ, Freeman RG, Duyne RPV. Exploring single-molecule SERS and single-nanoparticle plasmon microscopy. Proc. of SPIE. 2009;7394:739403–739409. [Google Scholar]
- 24.Wiley BJ, Im SH, Li Z-Y, McLellan J, Siekkinen A, Xia Y. Maneuvering the Surface Plasmon Resonance of Silver Nanostructures Through Shape-Controlled Synthesis. J. Phys. Chem. B. 2006;110:15666–15675. doi: 10.1021/jp0608628. [DOI] [PubMed] [Google Scholar]
- 25.Wiley B, Chen Y, McLellan J, Xiong Y, Li Z-Y, Ginger D, Xia Y. Synthesis and Optical Properties of Silver Nanobars and Nanorice. Nano Lett. 2007;7:1032–1036. doi: 10.1021/nl070214f. [DOI] [PubMed] [Google Scholar]
- 26.Rycenga M, Kim MH, Camargo PHC, Cobley C, Li Z-Y, Xia Y. Surface-Enhanced Raman Scattering: Comparison of Three Different Molecules on Single-Crystal Nanocubes and Nanospheres of Silver. J. Phys. Chem. A. 2009;113:3932–3939. doi: 10.1021/jp8101817. [DOI] [PMC free article] [PubMed] [Google Scholar]
- 27.Kelly K, Coronado E, Zhao L, Schatz G. The Optical Properties of Metal Nanoparticles: The Influence of Size, Shape, and Dielectric Environment. J. Phys. Chem. B. 2003;107:668–677. [Google Scholar]
- 28.Moskovits M, Jeong DH. Engineering nanostructures for giant optical fields. Chem. Phys. Lett. 2004;397:91–95. [Google Scholar]
- 29.McMahon JM, Wang Y, Sherry LJ, Duyne RPV, Marks LD, Gray SK, Schatz GC. Correlating the Structure, Optical Spectra, and Electrodynamics of Single Silver Nanocubes. J. Phys. Chem. C. 2009;113:2731–2735. [Google Scholar]
- 30.Sanders AW, Routenberg DA, Wiley BJ, Xia Y, Dufresne ER, Reed MA. Observation of Plasmon Propagation, Redirection, and Fan-Out in Silver Nanowires. Nano Lett. 2006;6:1822–1826. doi: 10.1021/nl052471v. [DOI] [PubMed] [Google Scholar]
- 31.Gersten J, Nitzan A. Electromagnetic theory of enhanced Raman scattering by molecules adsorbed on rough surfaces. J. Chem. Phys. 1980;73:3023–3037. [Google Scholar]
- 32.Fromm DP, Sundaramurthy A, Kinkhabwala A, Schuck PJ, Kino GS, Moerner WE. Exploring the chemical enhancement for surface-enhanced Raman scattering with Au bowtie nanoantennas. J. Chem. Phys. 2006;124:061101–061104. doi: 10.1063/1.2167649. [DOI] [PMC free article] [PubMed] [Google Scholar]
- 33.Hao E, Schatz GC. Electromagnetic fields around silver nanoparticles and dimers. J. Chem. Phys. 2004;120:357–366. doi: 10.1063/1.1629280. [DOI] [PubMed] [Google Scholar]
- 34.Camargo PHC, Li W, Au L, Rycenga M, Xia Y. Measuring the SERS Enhancement Factors of Dimers with Different Structures Constructed from Silver Nanocubes. Chem. Phys. Lett. 2009 doi: 10.1016/j.cplett.2009.12.002. in press. [DOI] [PMC free article] [PubMed] [Google Scholar]
- 35.Kumar PS, Pastoriza-Santos I, Rodríguez-González B, García de Abajo FJ, Liz-Marzán LM. High-yield synthesis and optical response of gold nanostars. Nanotechnology. 2008;19:015606–015606. doi: 10.1088/0957-4484/19/01/015606. [DOI] [PubMed] [Google Scholar]
- 36.Nordlander P, Prodan E. Plasmon Hybridization in Nanoparticles near Metallic Surfaces. Nano Lett. 2004;4:2209–2213. [Google Scholar]
- 37.Fang Y, Seong N-H, Dlott DD. Measurement of the distribution of site enhancements in surface-enhanced Raman scattering. Science. 2008;321:388–392. doi: 10.1126/science.1159499. [DOI] [PubMed] [Google Scholar]
- 38.Camargo PHC, Rycenga M, Au L, Xia Y. Isolating and probing the hot spot formed between two silver nanocubes. Angew. Chem. Int. Ed. 2009;121:2214–2218. doi: 10.1002/anie.200806139. [DOI] [PMC free article] [PubMed] [Google Scholar]
- 39.Diebold ED, Peng P, Mazur E. Isolating Surface-Enhanced Raman Scattering Hot Spots using Multiphoton Lithography. J. Am. Chem. Soc. 2009;131:6356–16357. doi: 10.1021/ja9073936. [DOI] [PubMed] [Google Scholar]
- 40.Dieringer JA, Lettan RB, Scheidt KA, Duyne RPVA. Frequency Domain Existence Proof of Single-Molecule Surface-Enhanced Raman Spectroscopy. J. Am. Chem. Soc. 2007;129:16249–16256. doi: 10.1021/ja077243c. [DOI] [PubMed] [Google Scholar]


