Abstract
The α-hemolysin (αHL) is a self-assembling exotoxin that binds to the membrane of a susceptible host cell and causes its death. Experimental studies show that electrically neutral β-cyclodextrin (βCD) can insert into the αHL channel and significantly increase its anion selectivity. To understand how βCD can affect ion selectivity, molecular dynamics (MD) simulations potential of mean force (PMF) calculations are carried out for different αHL channels with and without βCD adapter. A multiscale approach based on the Generalized Solvent Boundary Potential (GSBP) is used to reduce the size of the simulated system. The PMF profiles reveal that βCD has no anion selectivity by itself, but can increase the Cl− selectivity of the αHL channel when lodged into the pore lumen. Analysis shows that βCD causes a partial desolvation of ions and affects the orientation of nearby charged residues. The ion selectivity appears to result from increased electrostatic interaction between the ion and the channel due to a reduction in dielectric shielding by the solvent. These observations suggest a reasonable explanation of the ion selectivity and provide important information for further ion channel modification.
Keywords: α-hemolysin, β-cyclodextrin, ion channel, GSBP, potential of mean force, diffusion coefficient
Introduction
α-Hemolysin (αHL) secreted by the bacterium Staphylococcus aureus is an exotoxin involved in a number of human diseases.1–3 It can self-assemble on lipid bilayers of a susceptible host cell membrane to form a wide heptameric pore.4 Uncontrolled permeation of water, ions and small organic molecules through this wide transmembrane pore can then lead to the death of the host cell.5 Being a particularly robust structure, αHL has many potential applications in biotechnology, such as single-molecule detection,6–10 single DNA sequencing,11 nanochemistry,12,13 nano-electro-osmotic transportation,14 and modulation of ion selectivity.15 Important aspects of αHL as a promising scaffold for synthetic ion channels are: 1) it can bind to various biological or synthetic lipid bilayers readily and spontaneously; 2) once bound to the membrane, it is stable over a wide range of pH and temperature; 3) it can be modulated in many ways to adjust ion selectivity. Experimental studies show that the wild type αHL displays a weak anionic selectivity and this selectivity can be increased by mutation of residues lining the lumen of the channel,16 and by noncovalent7,15–17 or covalent linkage18 of a cyclic polysaccharide (β-cyclodextrin) in the lumen of the pore. For example, the (M113N)7 mutant and (M113F)7 mutant αHL channels have been reported to be able to bind the β-cyclodextrin (βCD) noncovalently for 104 times longer than the wild-type αHL16,17 and become highly chloride ion selective.15 However, βCD is an electrically neutral molecule and the underlying mechanism for the high chloride selectivity is unclear. To facilitate the chemical ion channel design, it is essential to understand how βCD improves the anion selectivity of the channel. Because ion selectivity is often dominated by relative free energy differences, molecular dynamics potential of mean force (PMF) calculation is a powerful approach to deepen our understanding of the ion selectivity mechanisms at the atomic level. Here, molecular dynamics (MD) free energy simulations are carried out for different αHL channels with and without βCD adapted inside. To reduce the size of the simulated system, a multiscale approach based on the Generalized Solvent Boundary Potential (GSBP) is used whereby the local system is simulated with atomic detail and the effects of the surroundings are approximated with continuum electrostatics.19
The outline of the article is as follows. In the following section, the theoretical background, the system preparation and details about the simulation are briefly described. Then, the interactions of isolated βCD with ions are calculated, first in vacuum and then in explicit water solvent. The free energy of ion passage through the βCD adapted channel (M113N)7·βCD and (M113F)7·βCD is investigated and compared with the free energy in the isolated channels and wild-type channel. Finally, the main results are summarized in the last section.
Methods
Atomic model and GSBP method
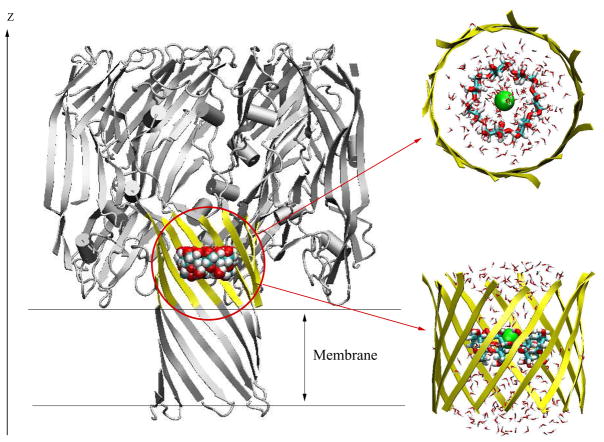
The CHARMM PARAM2720 force field was used for the protein and the TIP3P was used for the water molecules.21 The generalized AMBER force field (GAFF)22 was used to model βCD. The topology and parameters of βCD for CHARMM were generated with ANTECHAMBER 1.2723 and with AM1-BCC24 partial charges (provided in Supplementary Material: Table S1 and S2). The electrostatic potential surface of βCD (Figure 3) was produced using Molecular Operating Environment, version 2007.09 (Chemical Computing Group, Montreal), and AM1-BCC partial atomic charges.24 A Gaussian surface was generated, and potential was calculated using the Poisson-Boltzmann (PB) equation.25 The parameters for K+ and Cl− were taken from reference 26. Five channel systems were generated using CHARMM27,28 on the basis of available X-ray structures. They are: wild-type αHL,29 (M113N)7, (M113F)7, (M113N)7·βCD and (M113F)7·βCD (Montoya and Gouaux, unpublished). However, there are one side chain missing in (M113F)7 crystal structrue (Lys110→Gly110) and two side chains missing in (M113N)7 crystal structure (Tyr148→Ala148, Leu1288→Gly1288). We modified the (M113F)7 structure by adding back the charged Lys110, while keeping the (M113N)7 crystal structure unchanged. Hydrogen atoms were added using the HBUILD facility in CHARMM. The protonation state of the channels was chosen as in Noskov et al.30 In the simulations the channel structures are oriented with their pore along the z-axis. The negative z-axis corresponds to the intracellular side (trans side) and the positive z-axis corresponds to the extracellular side (cis side). The center of the implicit membrane is located at z = 0 Å, extending in the x and y directions with a thickness of 25 Å (Figure 1). In the X-ray structures, the seven glucose 6-OH groups of βCD point toward the trans side in the (M113N)7·βCD channel, but toward the cis side in the (M113F)7·βCD channel. The center of mass of βCD is located approximately on the z-axis around 25 Å in the (M113N)7·βCD system and at 26 Å in the (M113F)7·βCD system.
Figure 3.
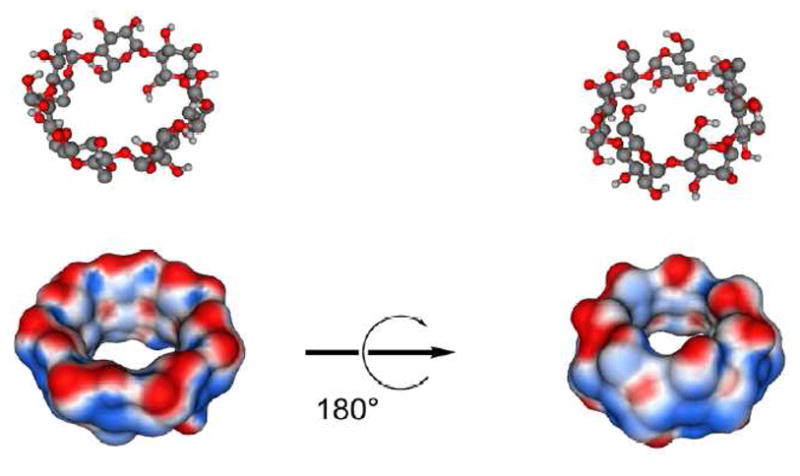
β-cyclodextrin is shown as ball-and-stick models and as Connolly surfaces onto which electrostatic potential is mapped (blue = positive, red = negative). Partial atomic charges and force field parameters were calculated using the General Amber Force Field/AM1/BCC method.22
Figure 1.
Molecular graphics view of the GSBP simulation system for (M113N)7 channel with βCD adapter inside. The full protein is shown in cartoon style (grey), while the inner GSBP simulation region is highlighted in yellow. Channel axis is along the z-axis. Implicit membrane is centered at z = 0 Å with thickness of 25 Å. The reduced system for GSBP is zoomed in and shown in top view and side view. The residues in the inner region, yellow ribbons; βCD, VDW model in whole channel and licorice model in zoom-in figure; Cl−, green ball; TIP3 water, stick in atom type colors.
The GSBP method implemented into the PBEQ module31–33 of the CHARMM program, was used to simulate a reduced atomic model of αHL. The multiscale approach based on the GSBP is similar to the semi-microscopic approach in existing literatures.34–37 The theoretical foundation about GSBP method can be found in 19. In our simulation, a spherical inner region was centered at (0.0, 0.0, 30.0), with a radius of 20 Å. The inner region was extended by 3 Å to define a smooth spherical dielectric cavity of 23 Å. Protein atoms near the edge of the boundary were fixed during the simulation. In the inner region (see Figure 1 for top view and side view), the protein, the cyclodextrin, and the solvent molecules were simulated explicitly with all-atom MD simulations. In the outer region, the remaining protein atoms and solvent were treated implicitly. The influence of the surrounding outer region on the atoms of the inner region is represented in terms of a solvent-shielded static field φsf and a solvent-induced reaction field φrf. The reaction field due to changes in charge distribution in the dynamic inner region is expressed in terms of a basis set expansion of the inner region charge density. The solvent-shielded static field from the outer region and the reaction field matrix , representing the couplings between the generalized multipoles were calculated once and recalled during the later simulations. Dielectric constants were assigned values of 80 for solvent, and 2 for both protein and membrane. The finite-difference PB calculation was solved with periodic boundary conditions in the xy-plane. The KCl concentration was assumed to be 150 mM in the bulk solvent. The reaction field matrix and static field were calculated using a 1113 coarse grid with a grid spacing of 3.0 Å, followed by a 1613 fine grid centered at the center of mass of βCD with a grid spacing of 0.5 Å. The reaction field matrix was built using 25 basis functions of 5 multipoles without sorting. After defining the inner region and calculating the static field and reaction field matrix, the inner region system was hydrated with explicit TIP3P water molecules. We used 20 cycles of 10000 steps of MC followed by 10000 steps of Langevin dynamics. The MC consists of rigid body translation, rotation and GCMC (grand canonical Monte Carlo) moves with equal probability. A friction coefficient of 5 ps−1 was assigned to all nonhydrogen atoms for the Langevin dynamics.
The potential of mean force
The 1D-PMF W (z) was calculated using umbrella sampling,38 in which a set of equally spaced simulations were biased by the quadratic potential wi(z) = (1/2)ki(z-zi)2 to restrain the ion near specific positions zi along the z-axis; 61 independent windows, separated by 0.5 Å increments in the z direction from 15 Å to 45 Å, were simulated with Langevin dynamics. A force constant of 5 kcal/mol/Å2 was used for the harmonic potential to ensure overlap of neighboring windows. A time step of 2 fs was used for all simulations and a friction constant of 5 ps−1 was applied to all nonhydrogen atoms. Each window simulation started from the configuration equilibrated during 20 ps with the ion near the constraint position. 500 ps of trajectory was generated for each window. The results were unbiased using the weighted histogram analysis method (WHAM),39 with a bin size of 0.05 Å and a stringent tolerance of 0.0001 kcal/mol on every point in the PMF.
For calculating the PMF of one ion passage through βCD in explicit solvent, the βCD is located in the center of a cylinder of TIP3P water molecules. The cylinder of solvent contains 404 TIP3P molecules and is about 62 Å in length and 7.6 Å in radius. Periodic boundary conditions were used for the cylinder system (tetragonal box 31×31×62 Å3 with cutoff distance 15 Å). The parameters for umbrella sampling are the same as in the channel system described above.
PB computations
Continuum electrostatic calculations were carried out by moving one ion along the z-axis by 1.0 Å increments through the whole channel. The aqueous solution (including the water-filled cavity at the center of the channel) was represented as a uniform continuum media with a dielectric constant of 80. The channel with all explicit atoms was embedded into a low dielectric planar slab simulating the membrane, represented as a uniform slab of 25 Å thickness with a dielectric constant of 2.40 The crystal structures were used. The dielectric constant of the protein interior was assumed to be 2. All calculations were performed using the PBEQ module,31–33 implemented in CHARMM.27,28 The atomic charges were taken from the all-atom PARAM27 force field of the CHARMM program and the atomic radii used to define the protein-solvent dielectric boundary were taken from previous free energy simulation studies with explicit water molecules.31 Each PB calculation was performed in two steps with a cubic grid of 2403 points, starting with a grid spacing of 1.0 Å, followed by a focusing around the main region with a grid spacing of 0.5 Å.
Position-dependent diffusion coefficient of ions
The position-dependent diffusion coefficient of K+ and Cl− inside the βCD were calculated from the umbrella sampling MD trajectories using the GSBP reduced (M113N)7·βCD system. The details about the simulations are the same as described in the PMF calculations, except that the Langevin dynamics was turned off within a radius of 12 Å from the center by setting the parameter RBUF=12. The theoretical formulation used here was previously elaborated by Hummer,41 based on an early development by Woolf and Roux.42 Briefly, the position-dependent diffusion coefficient D(z) along the z-axis aligne with the pore is expressed as,
| (1) |
where z(t) is the position of the ion along the z axis, δz(t) = z(t) − 〈z〉 (i), and τi is the correlation time extracted from the biased simulation with the ith window potential,
| (2) |
The diffusion coefficients in bulk are computed from additional MD simulations in which a K+ or Cl− was placed in a droplet of about 600 explicit TIP3P water molecules, contained by the reactive spherical solvent boundary potential (SSBP).26 The ion was restrained near the center of the droplet by a harmonic potential. The diffusion coefficients in bulk calculated using the same equations (1, 2) are 0.33 Å2/ps for both K+ and Cl−, which is in agreement with a previous MD study.43
Results and Discussion
Ion selectivity of βCD
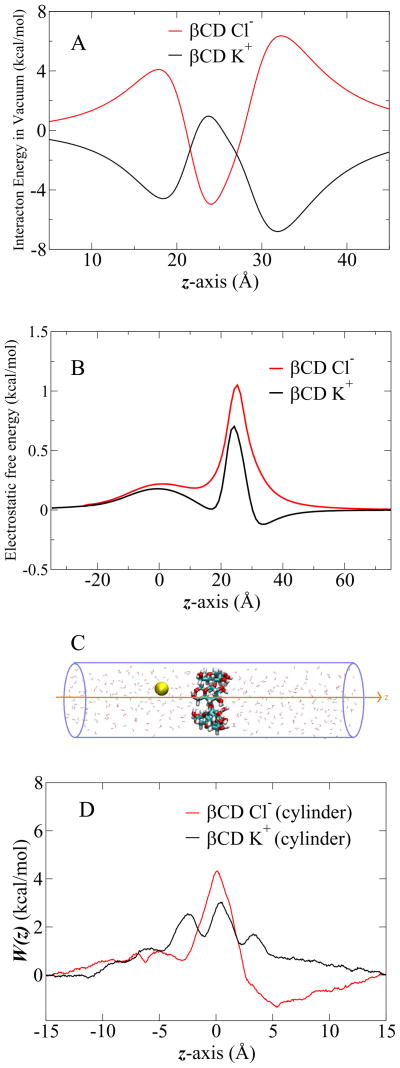
Figure 3 shows the electrostatic potential surface of βCD calculated in vacuum. The potential is slightly more positive through the lumen of the cyclodextrin (blue and red surfaces indicate a positive and negative potential, respective). The ion selectivity of βCD alone was first examined by moving one ion through βCD in vacuum. The results are shown in Figure 4A. The vacuum inter-actionn energy profiles of K+ and Cl− has symmetric and opposite interactions, mainly due to the charge distribution of the βCD. In vacuum, the passage of Cl− is opposed by a larger energy barrier than K+. As shown in Figure 4B and D, the large energy barriers observed in vacuum are considerably reduced by the influence of solvation. In Figure 4B, the electrostatic free energy of a single ion passing through βCD was calculated using continuum electrostatics Poisson-Boltzmann (PB). In Figure 4D, the corresponding free energy profiles were calculated using umbrella sampling MD simulations with explicit solvent molecules. The latter reveal relatively complex interactions, due in part to solvation and desolvation effects of the ions as they pass through the small aperture of βCD. Nevertheless, while there are quantitative differences, both Figure 4B and D show that β CD, by itself, is not selective for Cl− over K+ when solvation effects are taken into account.
Figure 4.
(A) Interaction of K+ and Cl− ions with βCD in vacuum. βCD is located at z = 25 Å. The ion is moving from 5 Å to 45 Å through βCD along the z-axis. (B) The electrostatic free energy profiles of ion passage through βCD, obtained from PB calculations. βCD is located at z = 25 Å. (C) The cartoon of single ion passage through βCD in the cylinder of explicit water solvent. βCD, licorice in atom type colors; K+ in yellow ball; TIP3 water in red stick. (D) 1D-PMF of K+and Cl− passage through βCD in the cylinder of explicit water solvent.
Ion selectivity of isolated ion channel and βCD adapted ion channel
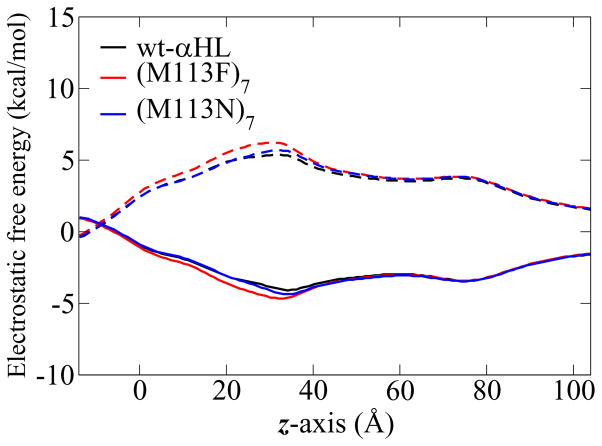
The influence of the βCD and the pore architecture on the ion transfer is investigated for five αHL channel systems: wt-αHL, (M113N)7, (M113F)7, (M113N)7·βCD and (M113F)7·βCD. For each system, the PB calculations and the PMF calculations were carried out as described in Method section. The channel pore radius of the crystal structures versus position along the channel axis (Figure 2) shows that there are two constriction regions inside the channels. The first one is at the top of the β-barrel (near z = 30 – 35 Å), with the total charge of +7e (7 Glu and 14 Lys residues). The second constriction region is at the transmembrane domain (near z = 0 Å), with the total charge of −7e (7 Lys and 14 Asp residues). The free energy in the PB calculations is dominated by these two regions. Figure 5 shows the electrostatic free energy profiles obtained from PB calculations by moving one ion along the z-axis through the five channels. These profiles show that the free energy minima for Cl− (solid lines) and maxima for K+ (dashed lines) are located between z ~ 30 to 35 Å. In the transmembrane region (z between −12 and 12 Å), the free energy of Cl− goes up and that of K+ goes down. These electrostatic free energy profiles correspond to the common feature of the αHL structure.
Figure 2.
Pore radius profiles along the channel axis calculated using CHARMM program. wt-αHL in black, (M113F)7 in red and (M113N)7 in blue.
Figure 5.
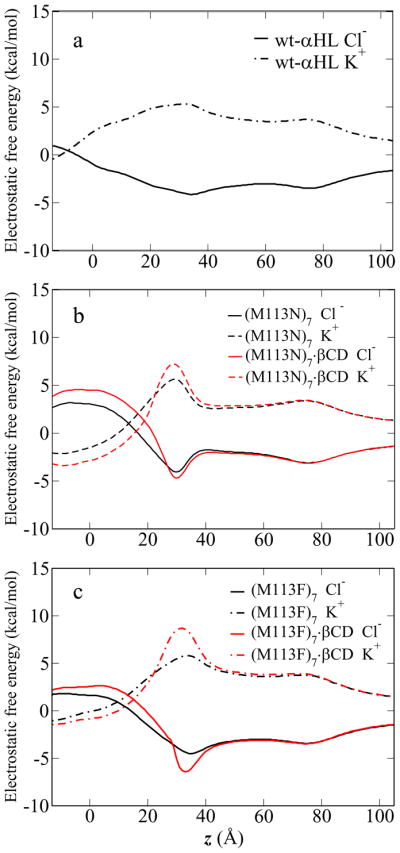
The electrostatic free energy profiles of ion passage through five channels, obtained from PB calculations. The solid lines are Cl− profiles and the dashed lines are K+ profile.
The structural difference among three channels, wt-αHL, (M113N)7, (M113F)7, is only at residue 113, which is located near z = 29 Å. The large change in the electrostatic free energy profiles with the neutral mutation is actually caused by different orientation of Asp128 and Lys131 side chains at the bottom of the crystal structures. This can be confirmed by re-constructing the (M113N)7 and (M113F)7 mutants from the wt-αHL X-ray structure, while keeping the configura-tion of the other side chains unchanged. The PB calculations on these model structures, shown in Figure 6, confirm that the residue 113 does not give rise long range effect in the transmembrane region. Comparing the energy profiles in the βCD adapted channels (red lines) with the isolated channel (black lines), Figure 5b and c both show that the electrostatic free energy barrier between Cl− and K+ is higher in the βCD adapted channels than in the isolated channel.
Figure 6.
The electrostatic free energy profiles obtained from PB calculations. The (M113N)7 and (M113F)7 mutants are re-constructed from the wt-αHL X-ray structure, with the configuration of the other side chains unchanged. The solid lines are Cl− profiles and the dashed lines are K+ profile.
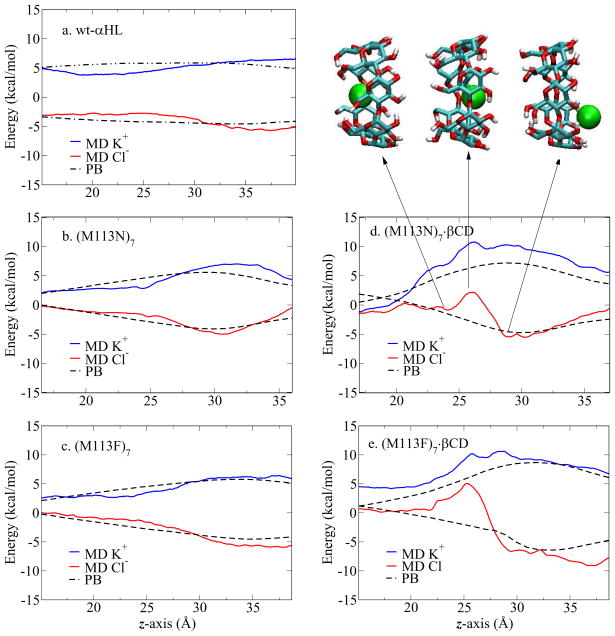
Figure 7 shows the PMF of Cl− (red line) and K+ (blue line) in the GSBP inner region of the five channels. The PMF profiles of the isolated channels (Figure 7a, b, and c) are relatively smooth and symmetric, similar to the electrostatic free energy obtained from PB calculations (dashed lines). These profiles suggest that the ion selectivity in the isolated channels is dominated by electrostatic interaction between the ion and the channel. The largest free energy difference between Cl− PMF and K+ PMF are found near z ~ 35 Å in wt-αHL and the (M113F)7 (Figure 7a and c), and near z ~ 31 Å in the (M113N)7 mutant (Figure 7b). Those positions correspond to the narrowest region in each channel, where seven Lys147 residues are located (see the pore radius profile Figure 2). The position of the narrowest region in the (M113N)7 is lower along the z-axis than the other channels because of the different orientations of Lys147 residues. The snapshots of partial X-ray structures in Figure 8 show that Lys147 residues are pointing upwards in both wild-type and the (M113F)7, while they are pointing slightly downwards in the (M113N)7. The Lys147 has a considerable impact on the PMF because the 7 positively charged side chains form a narrow ring, giving rise to a very strong electrostatic field in this region of the pore.
Figure 7.
1D-PMF profiles of ion passage through five channels. In PMF profiles, the red line is Cl− profile, the blue line is K+ profile and the dashed line is the electrostatic free energy profile. Three snapshots show the Cl− position corresponding to the z coordinates in the PMF profile. βCD is in licorice with atom type colors; Cl− in green ball; protein and TIP3 water molecules are not shown here.
Figure 8.
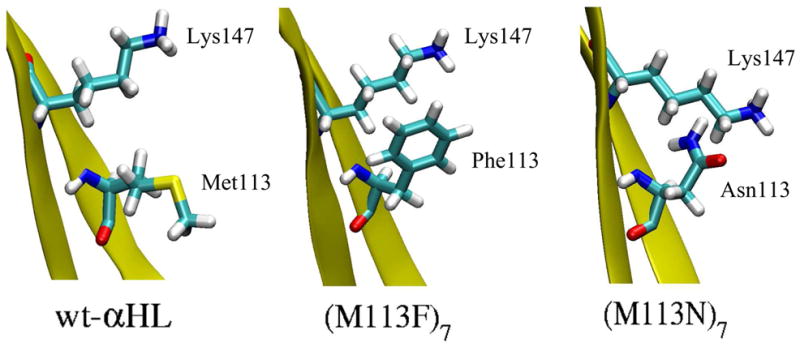
The snapshots of partial segment of channels showing the orientation of Lys147 and the residue at position 113 in three crystal structures. The (M113F)7 has Lys147 in the same orientation as the wt-αHL. While in the (M113N)7 Lys147 is pointing slightly downwards.
Figure 7d and e show the PMF of Cl− and K+ in βCD adapted channels. These PMF profiles are clearly distinct from the one without βCD (Figure 7b and c). The Cl− PMF in (M113N)7·βCD channel features three distinct areas (Figure 7d). As illustrated in the inserted snapshots, the PMF in unfavorable when Cl− goes through the βCD. The local energy barrier, similar to Figure 4D, reaches a maximum at z ~ 26 Å, near the center of the βCD. Then, the free energy goes down and reaches a minimum when the Cl− exits the βCD cavity. The K+ PMF remains unfavorable, displaying no region of appreciable stabilization in the inner region. Similar features are also found in (M113F)7·βCD profiles (Figure 7e).
The effect of βCD in the mutant channels
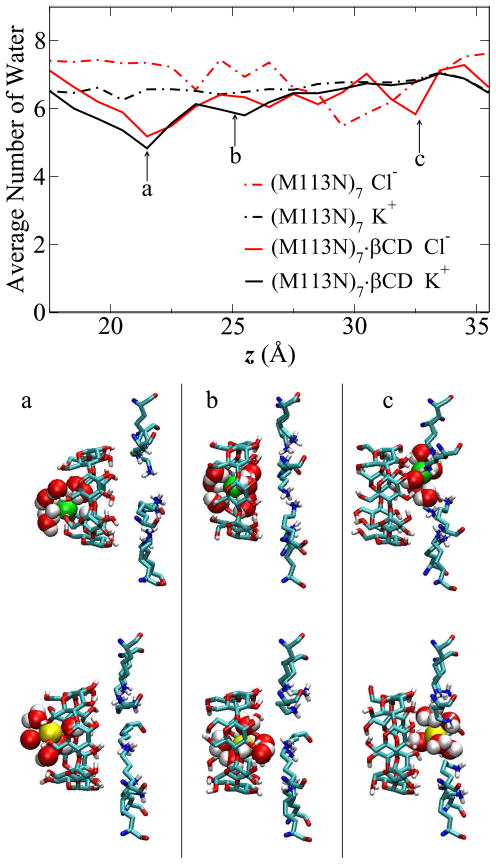
The PMF profiles show that the βCD can change the free energy of Cl− and K+ near the adapter region. Further analysis was performed to elucidate the role of the βCD in the lumen of the pore. First, βCD causes the partial desolvation of both ions. Taking the (M113N)7·βCD system as example, the average number of water molecules in the first solvation shell of Cl− (red lines) and K+ (black lines) are shown in Figure 9. The first solvation shell radii are 3.7 Å for Cl− and 3.5 Å for K+, based on the radial distribution function (RDF) curves (not shown here). Comparing the water profile in (M113N)7·βCD (solid lines) with the one in the isolated channel (dashed lines), about two water molecules are removed when Cl− or K+ approaches the small rim of βCD (position a in Figure 9). When the ions are near this position, the primary hydroxyl groups on βCD are able to rotate freely and interact with both Cl− or K+. The snapshots in Figure 9 a show typical configurations of ions with their hydration shell near this position (Cl− in green, K+ in yellow). After entering the βCD cavity, both ions stay in the center of the cavity and no special interaction is observed (snapshots b). Hence the first solvation shell is partially restored in the βCD cavity (position b in Figure 9). When the ions exit the βCD and approach the Lys147 ring, there is a strong electrostatic interaction between the ions and positive amino groups of Lys147 (snapshots c). However, the first solvation shell of K+ remains intact, while the Cl− loses one water molecule, as shown in the water profile (position c in Figure 9). This can be explained by the strong electrostatic interaction between Cl− and Lys147, which disrupt the hydration shell of the anion. The presence of βCD also affects the orientation of the side chain of Lys147. The angle distributions of Lys147 side chain (Supplementary Material, Figure S1) suggests that βCD can restrict the rotation of Lys147 by forming hydrogen bonds between hydroxyl group on βCD and Lys147 side chain in (M113N)7 mutant. The (M113F)7·βCD profile (Figure S1 d) also suggests that the partial desolvation of Cl− caused by βCD increases the electrostatic interaction between Cl− and the positively charged Lys147 residues.
Figure 9.
Average number of water molecules in the first solvation shell of ion inside (M113N)7 and (M113N)7·βCD channels. Radius cutoff 3.7 Å is used for Cl− (red lines), 3.5 Å for K+ (black lines). Snapshots show the typical ion and water configurations inside (M113N)7·βCD channel at ion position of (a) z ~ 21 Å, (b) z ~ 25 Å, (c) z ~ 33 Å. The three positions are also pointed out in the figure. Cl− in green VDW sphere; K+ in yellow VDW sphere; TIP3P water in VDW sphere with atom type colors; both βCD and Lys147 residues are shown in licorice style with atom type colors. Only water molecules within the first hydration shell are shown here, other residues and water molecules are omitted for clarity.
Position-dependent diffusion coefficient
At this point, our analysis has been exclusively focused on structural and energetic factors associated with ion movement. However, permeation can also be affected by purely dissipative factors, such as the friction or mobility coefficient along the pore.44 For instance, the position-dependent diffusion coefficient of ions is a central input parameter in many theoretical descriptions of permeation.43,45–47 To determine whether this plays an important role on the anionic selectivity induced by βCD, the diffusion coefficients of K+ and Cl− along the pore axis were calculated using biased simulations. The umbrella sampling MD trajectories of (M113N)7·βCD were used. The diffusion coefficient profiles of K+ and Cl− as a fraction to bulk values along the channel axis (15 < z < 35) shown in Supplementary Material (Figure S2). The bulk value is 0.33 Å2/ps for both K+ and Cl−as observed in previous studies of OmpF.43,47 The average fraction of bulk diffusion coefficient inside the βCD (21 < z < 29) is about 0.115 for both K+ and Cl−. There is a reduction by about a factor of 10 in the narrowest part of the pore relative to the bulk. In a continuation of the present study,48 the information about the position-dependent diffusion coefficients of K+ and Cl− calculated here from all-atom MD simulation with explicit solvent will be incorporated into Brownian Dynamics (BD) simulations and generate multi-ion GCMC/BD simulations.45 The present results will be important to calibrate the BD simulations, particularly within the narrowest region in the pore through the βCD.
Conclusion
We have performed PMF calculations for five different αHL channels to elucidate the ability of a βCD adapter to increase the anion selectivity of these channels. The free energy profiles suggest that βCD alone has no intrinsic Cl− selectivity over K+ ion, but it can increase the Cl− selectivity of the αHL mutants when lodged inside the lumen of the pore. A detailed trajectory analysis shows that the βCD causes a partial desolvation of the ions and also affect the orientation of nearby charged residues. The ion selectivity appears to be improved when the ion is less shielded by the solvent, which increase the electrostatic interaction between the ion and the channel. These observations suggest a reasonable explanation of the ion selectivity and provide important information for further channel modification. For example, the cyclodextrin can be modified by adding positively charged groups to increase anion selectivity or by adding bulky groups to increase the desolvation effect. The modified cyclodextrins can be inserted into the channel and their effect on ion selectivity can be rapidly evaluated by the computational inexpensive single ion PMF calculation. A large number of known channelopathies require multiple channel modifications to adjust ion selectivity. For example, cystic fibrosis is caused by a defect in a gene coding for an anion channel.3 The present study shows that computational simulations provide an efficient way to predict the ion selectivity, and could further support the experimental exploration of artificial exploration of artificial ion channel design.
One important aspect missing from the present study is the influence of multiple ions inside the pore. The anion selectivity displayed by the single ion PMFs with and without βCD seems overestimated. In a wide channel like αHL, multi-ion screening is expected to impact on the electrostatic interactions between the pore and the ions. One can expect that the multi-ion PMF will be less dominated by the electrostatic interaction, therefore becoming more sensitive to the geometry of the pore. This part is discussed in the follow-up study.48
Supplementary Material
Acknowledgments
We are very grateful to Eric Gouaux and Michelle Montoya for making available to us the coordinates of the αHL mutants with and without βCD adapted X-ray structures prior to publication. Helpful discussion with Hagan Bayley, Haichen Wu, Haibo Yu, Ed Harder, Xiaoxia Ge, Yuhui Li, Devleena Shivakumar, and Yuqing Deng are gratefully acknowledged. This work was supported by the National Institutes of Health (NIH) through the NIH Roadmap for Medical Research (award number PHS 2 PN2 EY016570B).
Footnotes
Supporting Information Available
Supplementary Material is available free of charge via the Internet at http://pubs.acs.org.
References
- 1.Laestadius A, Richter-Dahlfors A, Aperia A. Kidney Int. 2002;62:2035–2042. doi: 10.1046/j.1523-1755.2002.00661.x. [DOI] [PubMed] [Google Scholar]
- 2.Gentschev I, Dietrich G, Goebel W. Trends in Microbiology. 2002;10:39–45. doi: 10.1016/s0966-842x(01)02259-4. [DOI] [PubMed] [Google Scholar]
- 3.Rowe SM, Miller S, Sorscher EJ. New England Journal of Medicine. 2005;352:1992–2001. doi: 10.1056/NEJMra043184. [DOI] [PubMed] [Google Scholar]
- 4.Gouaux E. J Struct Biol. 1998;121:110–122. doi: 10.1006/jsbi.1998.3959. [DOI] [PubMed] [Google Scholar]
- 5.Aksimentiev A, Schulten K. Biophys J. 2005;88:3745–3761. doi: 10.1529/biophysj.104.058727. [DOI] [PMC free article] [PubMed] [Google Scholar]
- 6.Bayley H, Cremer PS. Nature. 2001;413:226–230. doi: 10.1038/35093038. [DOI] [PubMed] [Google Scholar]
- 7.Gu LQ, Braha O, Conlan S, Cheley S, Bayley H. Nature. 1999;398:686–690. doi: 10.1038/19491. [DOI] [PubMed] [Google Scholar]
- 8.Braha O, Gu LQ, Zhou L, Lu X, Cheley S, Bayley H. Nature Biotechnol. 2000;18:1005–1007. doi: 10.1038/79275. [DOI] [PubMed] [Google Scholar]
- 9.Movileanu L, Howorka S, Braha O, Bayley H. Nature Biotechnol. 2000;18:1091–1095. doi: 10.1038/80295. [DOI] [PubMed] [Google Scholar]
- 10.Wu HC, Bayley H. J Am Chem Soc. 2008;130:6813–6819. doi: 10.1021/ja8004607. [DOI] [PubMed] [Google Scholar]
- 11.Astier Y, Braha O, Bayley H. J Am Chem Soc. 2006;128:1705–1710. doi: 10.1021/ja057123+. [DOI] [PubMed] [Google Scholar]
- 12.Luchian T, Shin S, Bayley H. Angew Chem Int Edit Engl. 2003;42:3766–3771. doi: 10.1002/anie.200351313. [DOI] [PubMed] [Google Scholar]
- 13.Gu LQ, Cheley S, Bayley H. Science. 2001;291:636–640. doi: 10.1126/science.291.5504.636. [DOI] [PubMed] [Google Scholar]
- 14.Gu LQ, Cheley S, Bayley H. PNAS. 2003;100:15498–15503. doi: 10.1073/pnas.2531778100. [DOI] [PMC free article] [PubMed] [Google Scholar]
- 15.Gu LQ, Serra MD, Vincent JB, Vigh G, Cheley S, Braha O, Bayley H. PNAS. 2000;97:3959–3964. doi: 10.1073/pnas.97.8.3959. [DOI] [PMC free article] [PubMed] [Google Scholar]
- 16.Gu LQ, Cheley S, Bayley H. J Gen Physiol. 2001;118:481–494. doi: 10.1085/jgp.118.5.481. [DOI] [PMC free article] [PubMed] [Google Scholar]
- 17.Gu LQ, Bayley H. Biophys J. 2000;79:1967–1975. doi: 10.1016/S0006-3495(00)76445-9. [DOI] [PMC free article] [PubMed] [Google Scholar]
- 18.Wu HC, Astier Y, Maglia G, Mikhailova E, Bayley H. J Am Chem Soc. 2007;129:16142–16148. doi: 10.1021/ja0761840. [DOI] [PubMed] [Google Scholar]
- 19.Im W, Berneche S, Roux B. J Chem Phys. 2001;114:2924–2937. [Google Scholar]
- 20.MacKerell JAD, Banavali N, Foloppe N. Biopolymers. 2000;56:257–265. doi: 10.1002/1097-0282(2000)56:4<257::AID-BIP10029>3.0.CO;2-W. [DOI] [PubMed] [Google Scholar]
- 21.Jorgensen WL, Chandrasekhar J, Madura JD, Impey RW, Klein ML. J Chem Phys. 1983;79:926–935. [Google Scholar]
- 22.Wang J, Wolf RM, Caldwel JW, Kollman PA, Case DA. J Comp Chem. 2004;25:1157–1174. doi: 10.1002/jcc.20035. [DOI] [PubMed] [Google Scholar]
- 23.Wang JM, Wang W, Kollman PA, Case DA. J Mol Graphics. 2006;25:247–260. doi: 10.1016/j.jmgm.2005.12.005. [DOI] [PubMed] [Google Scholar]
- 24.Jakalian A, Jack DB, Bayly CI. J Comp Chem. 2002;23:1623–1641. doi: 10.1002/jcc.10128. [DOI] [PubMed] [Google Scholar]
- 25.Grant JA, Pickup BT, Nicholls A. J Comput Chem. 2001;22:608–640. [Google Scholar]
- 26.Beglov D, Roux B. J Chem Phys. 1994;100:9050–9063. [Google Scholar]
- 27.Brooks BR, Bruccoleri RE, Olafson BD, States DJ, Swaminathan S, Karplus M. J Comp Chem. 1983;4:187–217. [Google Scholar]
- 28.Brooks BR, et al. J Comp Chem. 2009;30:1545–1614. doi: 10.1002/jcc.21287. [DOI] [PMC free article] [PubMed] [Google Scholar]
- 29.Song L, Hobaugh MR, Shustak C, Cheley S, Bayley H, Gouaux JE. Science. 1996;274:1859–1866. doi: 10.1126/science.274.5294.1859. [DOI] [PubMed] [Google Scholar]
- 30.Noskov SY, Im W, Roux B. Biophys J. 2004;87:2299–2309. doi: 10.1529/biophysj.104.044008. [DOI] [PMC free article] [PubMed] [Google Scholar]
- 31.Nina M, Beglov D, Roux B. J Phys Chem B. 1997;101:5239–5248. [Google Scholar]
- 32.Im W, Beglov D, Roux B. Compu Phys Commun. 1998;111:59–75. [Google Scholar]
- 33.Roux B. Biophys J. 1997;73:2980–2989. doi: 10.1016/S0006-3495(97)78327-9. [DOI] [PMC free article] [PubMed] [Google Scholar]
- 34.Jordan P. NanoBioscience, IEEE Transactions. 2005;4:94–101. doi: 10.1109/tnb.2004.842502. [DOI] [PubMed] [Google Scholar]
- 35.Dorman VL, Jordan PC. Biophysical Journal. 2004;86:3529–3541. doi: 10.1529/biophysj.103.039214. [DOI] [PMC free article] [PubMed] [Google Scholar]
- 36.Dorman VL, Jordan PC. The Journal of Chemical Physics. 2003;118:1333–1340. [Google Scholar]
- 37.Dorman V, Partenskii MB, Jordan PC. Biophysical Journal. 1996;70:121–134. doi: 10.1016/S0006-3495(96)79554-1. [DOI] [PMC free article] [PubMed] [Google Scholar]
- 38.Torrie GM, Valleau JP. J Comp Chem. 1997;23:187–199. [Google Scholar]
- 39.Kumar S, Rosenberg JM, Bouzida D, Swendsen RH, Kollman PA. J Chem Phys. 1992;13:1011–1021. [Google Scholar]
- 40.White SH, Wiener MC. The liquid-crystallographic structure of fluid lipid bilayer membranes. In: Merz K, Roux B, editors. Membrane Structure and Dynamics. Birkhauser; Boston: 1996. pp. 127–144. [Google Scholar]
- 41.Hummer G. New Journal of Physics. 2005;7:34. [Google Scholar]
- 42.Woolf TB, Roux B. J Am Chem Soc. 1994;116:5916–5926. [Google Scholar]
- 43.Im W, Roux B. J Mol Biol. 2002;319:1177–1197. doi: 10.1016/S0022-2836(02)00380-7. [DOI] [PubMed] [Google Scholar]
- 44.Roux B, Allen TW, Bernèche S, Im W. Quat Rev Biophys. 2004;37:15–103. doi: 10.1017/s0033583504003968. [DOI] [PubMed] [Google Scholar]
- 45.Im W, Seefeld S, Roux B. Biophys J. 2000;79:788–801. doi: 10.1016/S0006-3495(00)76336-3. [DOI] [PMC free article] [PubMed] [Google Scholar]
- 46.Im W, Roux B. J Chem Phys. 2001;115:4850–4861. [Google Scholar]
- 47.Im W, Roux B. J Mol Biol. 2002;322:851–869. doi: 10.1016/s0022-2836(02)00778-7. [DOI] [PubMed] [Google Scholar]
- 48.Egwolf B, Luo Y, Walters DE, Roux B. Submitted. [Google Scholar]
Associated Data
This section collects any data citations, data availability statements, or supplementary materials included in this article.


