

Abstract
High polyamine (PA) levels and ornithine decarboxylase (ODC) over-expression are well-known phenomena in many aggressive cancer types. We analyzed the expression of ODC and ODC-activity regulating genes antizymes 1-3 (OAZ1-3) and AZ inhibitors 1-2 (AZ-IN1-2) in human neuroblastoma (NB) tumors and correlated these with genetic and clinical features of NB. Since ODC is a known target gene of MYCN, the correlation between ODC and MYCN was of special interest. Data were obtained from Affymetrix micro-array analysis of 88 NB tumor samples. In addition, mRNA expression levels of ODC, OAZ2, and MYCN in a MYCN-inducible NB cell line were determined by quantitative real-time RT-PCR. ODC mRNA expression in NB tumors was significantly predictive of decreased overall survival probability and correlated with several unfavorable clinical NB characteristics (all P < 0.005). Interestingly, high ODC mRNA expression also showed significant correlation with poor survival prognosis in Kaplan-Meier analyses stratified for patients without MYCN amplification, suggesting an additional role for ODC independent of MYCN. Conversely, high OAZ2 mRNA expression correlated with increased survival and with several favorable clinical NB characteristics (all P < 0.003). In addition, we provide first evidence of a role for MYCN-associated transcription factors MAD2 and MAD7 in ODC regulation. In NB cell cultures, ectopic over-expression of MYCN altered ODC, but not OAZ2 mRNA levels. In conclusion, these data suggest that elevated ODC and low OAZ2 mRNA expression levels correlate with several unfavorable genetic and clinical features in NB, offering new insights into PA pathways and PA metabolism-targeting therapy in NB.
Keywords: Antizyme 2, MAD, MAX, MYCN, neuroblastoma, ODC, polyamines, Kaplan-Meier survival plots
Introduction
Neuroblastoma (NB) is a pediatric malignancy that arises from neural crest-derived cells of the sympathetic nervous system, especially within the adrenal gland medulla. Nearly 50% of NB cases are diagnosed in children younger than two years 1. NB represents ∼10% of pediatric cancer, with 700-800 cases per year in the United States of America. While infants often experience full regression of primary tumors as well as metastatic disease, older children (over 1 year of age) usually present with aggressive NB metastases that hardly respond to the most intense combination therapies 1, 2. The 2-year disease-free survival of patients with low stage disease (stage 1, 2, and 4S in the International Neuroblastoma Staging System, or INSS) is 80-90%, for those with higher stage disease (stage 3 and 4) it is 40-60% 1, 2. Consequently, patient age at diagnosis and stage of disease, but also genomic defects such as MYCN gene amplification and 1p loss-of-heterozygosity (LOH) are important clinical features to predict patient survival and prognosis, and are used to stratify for therapeutic assignment 1-3.
The mechanism by which MYCN amplification influences the prognosis of NB is not fully understood. There is significant evidence that the ornithine decarboxylase (ODC) gene is a direct downstream target of MYCN 4, 5. ODC is the first and rate-limiting enzyme in polyamine (PA) biosynthesis which converts ornithine to putrescine (Put) 6. Put is further converted into the higher PAs spermidine (Spd) and spermine (Spm). ODC and PA levels are tightly controlled in normal cells and regulated at the levels of transcription, translation, and degradation 7-9. ODC has oncogenic and transforming abilities and ODC over-expression has been observed in many tumor types. ODC inhibition reverts transformed cultured cells and reduces tumor growth (reviewed in 7, 10). For example, the ODC suicide inhibitor α-difluoromethylornithine (DFMO) has been successful in combination trials as a chemotherapeutic and chemopreventive agent 11-14. The fact that ODC gene expression can be directly activated by MYCN suggests that MYCN gene amplification is connected to high ODC expression and high PA levels which contributes to the malignant phenotype and the maintenance of NB tumorigenesis. We and others have described the role of ODC over-expression in enhancing the proliferation of NB cells in vitro 4, 5, 15, 16, and two very recent papers demonstrate the importance of ODC expression for NB tumor survival in a mouse model 17, 18. However, more comprehensive analyses of the expression of ODC and ODC activity-regulating genes and their correlations to important clinical features of NB are still needed to aid in understanding the overall role of ODC/PA metabolism in this tumor as well as to evaluate the use of ODC/PA-targeting drugs.
Antizyme (AZ) is a negative regulator of cellular PA content and its expression is induced by a special feedback mechanism. As cellular PA levels increase, they stimulate a +1 frame-shifting event during translation of the AZ mRNA thereby increasing the expression of full-length functional AZ protein 19. AZ binds to the ODC monomer, and thereby inhibits ODC activity and enhances ubiquitin-independent ODC degradation by the 26S proteasome. In addition, AZ promotes PA excretion and suppresses PA uptake. These biochemical activities have been well characterized in the most-studied AZ, OAZ1. Newer members of the AZ family (OAZ2 and OAZ3) also require PA stimulated frame-shifting during translation. All members of the AZ family are able to bind and inhibit ODC and suppress PA uptake, but OAZ1 stimulates ODC degradation most effectively. The mRNA expression level of OAZ2 is generally much lower than that of OAZ1, and OAZ3 expression is limited to the testis (reviewed in 20, 21).
Antizyme inhibitors (AZ-IN1 and -2) are proteins that exhibit extensive sequence homology with ODC but completely lack ODC enzymatic activity due to critical amino acid substitutions 22. AZ-INs bind to AZ with greater affinity than ODC and liberate ODC from the inactive ODC-AZ complex, thereby facilitating the production of Put, Spd, and Spm (reviewed in 23). AZ-IN1 expression elevates PA content, enhances cell proliferation and induces a transformed phenotype in NIH-3T3 cells 24. In addition, enhanced AZ-IN1 gene expression or amplification of the AZ-IN1 chromosomal region have been demonstrated in several human cancers 25-27 and in normal cells in response to Ras transformation 24. Another human gene, which was originally described as an ODC paralogue (ODCp), has now been classified as a second member of the AZ-IN family (AZ-IN2) 28.
While NB tumors have well-defined clinical features that can be helpful in predicting tumor behavior, more insight into the molecular pathways governing NB tumorigenesis is needed to aid the clinical outcome predictions and early diagnosis of patients. In addition, knowledge about these molecular pathways will provide novel gene targets for cancer-specific and patient-tailored drug development. To gain more insights into the clinical relevance of ODC in human NB, this study examined the correlation of ODC with important genetic and clinical features in a set of 88 NB tumors. In addition, we analyzed the ODC-regulating genes OAZ1, OAZ2, OAZ3, AZ-IN1, and AZ-IN2 as well as the MYCN-associated genes MAD and MAX to obtain a comprehensive overview of PA metabolism-regulating genes and their potential function in NB.
Materials and methods
Gene annotation
NCBI Gene_IDs and NCBI GeneNames for the genes analyzed were respectively: ODC: 4953, ODC1 (ornithine decarboxylase). OAZ1: 4946, AZI (ODC antizyme 1). OAZ2: 4947, AZ2 (ODC antizyme 2). OAZ3: 51686, AZ3 (ODC antizyme 3). AZ-IN1: 51582, AZIN1 (antizyme inhibitor 1). AZ-IN2 113451, ADC (arginine decarboxylase), MYCN: 4609, MYCN (v-myc myelocytomatosis viral related oncogene, neuroblastoma derived (avian)), c-MYC: 4609, MYC (v-myc myelocytomatosis viral oncogene homolog (avian)), L-MYC: 4610, MYCL1 (v-myc myelocytomatosis viral oncogene homolog 1, lung carcinoma derived (avian)), MAX: 4149, MAX (MYC associated factor X), MAD1: 4084, MXD1 (MAX dimerization protein 1), MAD2: 4601, MXI1 (MAX interactor 1), MAD3: 83463, MXD3 (MAX dimerization protein 3), MAD4: 10608, MXD4 (MAX dimerization protein 4), MAD5: 23269, MGA (MAX gene associated), MAD6: 4335, MNT (MAX binding protein), MAD7: 6945, MLX (MAX-like protein X).
Affymetrix DNA micro-array hybridization and analysis
The Affymetrix NB tumor dataset NB88 contains the expression profiles of 88 NB tumors with documented genetic and clinical features. This set is called “NB88”. Two subsets of NB88, containing only the 72 tumors without MYCN-amplification, or the 16 MYCN-amplified tumors, are called “NB72”, and “NB16”, respectively. Total RNA was extracted from frozen NBs containing >95% tumor cells, and Affymetrix HG-U133 Plus 2.0 micro-array analysis performed as described in 29. Other Affymetrix data sets were retrieved from public Gene Expression Omnibus (GEO) datasets on the NCBI website 30: The EXPO dataset of 1,908 samples representing 41 different human tumor types (https://expo.intgen.org/expo/public), the Roth set of 353 samples representing 65 different normal human tissues, and three different GEO datasets for 13 samples of normal adrenal gland tissue. CEL data from the Affymetrix GeneChip Human Genome U133 Plus 2.0 array data sets were downloaded, and analyzed as described in 29. Annotations and clinical data for the tissue samples analyzed are available from http://www.ncbi.nlm.nih.gov/geo/query/ thru their GEO ID's: GSE2109 (EXPO), GSE3526 (Roth), and GSE3526/7307/8514 (adrenal gland). Affymetrix probe-sets were selected using R2 (see below). All gene transcript levels were determined from data image files using GeneChip operating software (MAS5.0 and GCOS1.0, from Affymetrix). Samples were scaled by setting the average intensity of the middle 96% of all probe-set signals to a fixed value of 100 for every sample in the dataset. Transcript levels can thus be compared between micro-arrays. The probe-sets selected for a gene showed the highest expression in samples containing a present call for that gene. The TranscriptView genomic analysis and visualization tool was used to check if the probe-set selected had an anti-sense position in an exon of the gene (http://bioinfo.amc.uva.nl/human-genetics/transcriptview/). The Affymetrix probe-sets selected were 200790_at (ODC), 200077_s_at (OAZ1), 201365_at (OAZ2), 222075_s_at (OAZ3), 212461_at (AZ-IN1), 228000_at (AZ-IN2), 209757_s_at (MYCN), 209332_s_at (MAX), 226275_at (MAD1), 202364_at (MAD2), 221250_s_at (MAD3), 210778_s_at (MAD4), 212945_s_at (MAD5), 204206_at (MAD6), and 213708_s_at (MAD7).
All analyses were performed using R2; an Affymetrix analysis and visualization platform developed in the Department of Human Genetics at the Academic Medical Center – University of Amsterdam (J. Koster, unpublished data).
Cell lines and treatment of cultured cells
The MYCN-inducible NB cell line MYCN-2 (derived from SH-EP) 31 was kindly provided by Dr. J. Shohet (Texas Children's Hospital) and maintained in RPMI 1640 (Biosource, Rockeville, MD, USA) containing 10% (v/v) heat-inactivated fetal bovine serum (Invitrogen, Carlsbad, CA, USA), penicillin (100 U/ml) and streptomycin (100 μg/ml). For MYCN induction, doxycycline was added at the beginning of the experiment. All cells were cultured at 37 °C, in a humidified atmosphere containing 5% CO2. Cell numbers were determined using a hemacytometer in the presence of trypan blue. Doxycycline was purchased from Sigma (St. Louis, MO, USA), dissolved in water (1 mg/ml stock solution), aliquoted, and stored frozen at -20 °C. For MYCN-2 time-course experiments, an aliquot was thawed and 1 μl of doxycycline solution per ml of cell culture medium was added (final concentration 1 μg/ml).
Real-time RT-PCR
Total RNA was isolated from cell cultures using the RNeasy® mini kit (Qiagen, Valencia, CA, USA). First-strand cDNA was obtained from total RNA (1 μg) using ImProm-II™ reverse transcriptase (Promega, Madison, WI, USA). Real-time reverse transcriptase (RT)-PCR was performed with a iCycler iQ Real-Time Detection System (Bio-Rad, Hercules, CA, USA) using the following primer sets: MYCN-fwd, 5′-gtcaccacattcaccatcac-3′ and MYCN-rev, 5′-gggaaggcatcgtttgag-3′; ODC-fwd, 5′-gtgccacgctcagaaccag-3′ and ODC-rev, 5′-ccaccgccactctcaagcaga-3′; OAZ2-fwd, 5′-ggtgaaggtctcttcttggg -3′ and OAZ2-rev, 5′-acaatccttctttgctcccat-3′; GAPDH-fwd, 5′-acggatttggtcgtattggg-3′ and GAPDH-rev, 5′-tgattttggagggatctcgc-3′. Semi-quantitative RT-PCR was performed using the same primer sets and PCR reactions analyzed by agarose gel electrophoresis.
Kaplan-Meier scanner and other statistical analyses
To determine the optimal value to set as cut-off in the Kaplan-Meier curve for expression of gene “X” in the NB88 or NB72 series (see above), we sorted the NB tumors on the expression gene X, and subsequently divided them in two groups based on the gene X expression value of every tumor. For every group separation (higher or lower than the current expression of gene X), the logrank significance was calculated using the log-rank test 32. The best P value obtained was used to represent the final gene expression cut-off value for gene X. To correct for multiple testing, the resulting P value was multiplied by the number of tests performed (n minus 16, Bonferoni correction). ODC, OAZ1-3, AZ-IN1-2, MAX, and MAD1-7 expression and their relationship with overall patient survival probability, patient age at diagnosis, patient survival, MYCN amplification, 1p LOH, INSS tumor stage, and tumor histology were evaluated on grouped samples using the non-parametric Kruskal-Wallis and Mann-Whitney U tests.
Results
Expression of ODC and ODC activity-regulating genes in NB
For analysis of the expression of ODC and ODC activity-regulating genes and their correlations to important clinical features of NB, we prepared a set of Affymetrix gene expression profiles of 88 NB tumors (named “NB88”) Using the genome-wide HG-U133 Plus 2.0 platform. For all 88 NB tumors, documented genetic and clinical features were available from patient files at the Academic Medical Center of the University of Amsterdam (16 of these tumors had MYCN amplifications (named “NB16”), whereas the remaining 72 tumors (named “NB72”) had no MYCN amplifications). We were especially interested to find whether ODC gene expression correlated with NB patient survival. Kaplan-Meier analysis of ODC mRNA levels in the NB88 tumors shows that indeed ODC mRNA content is correlated with survival prognosis (Fig. 1). During a 196-month follow-up, the overall survival of patients with low ODC tumor expression (n=72) was about 75%, while that of patients with high ODC tumor expression (n=16) fell to 0% after only 38 months (P = 9.4 • 10-8) (these two groups are not to be confused with the NB72 and NB16 tumor sets described above). A P value < 0.01 was found for the Kaplan-Meier analysis of several other ODC expression cut-offs within this tumor set (See Fig. 1 legend), suggesting a statistically robust relationship between ODC expression and NB patient prognosis. For all these groups, high ODC expression correlated with poor prognosis.
Figure 1.
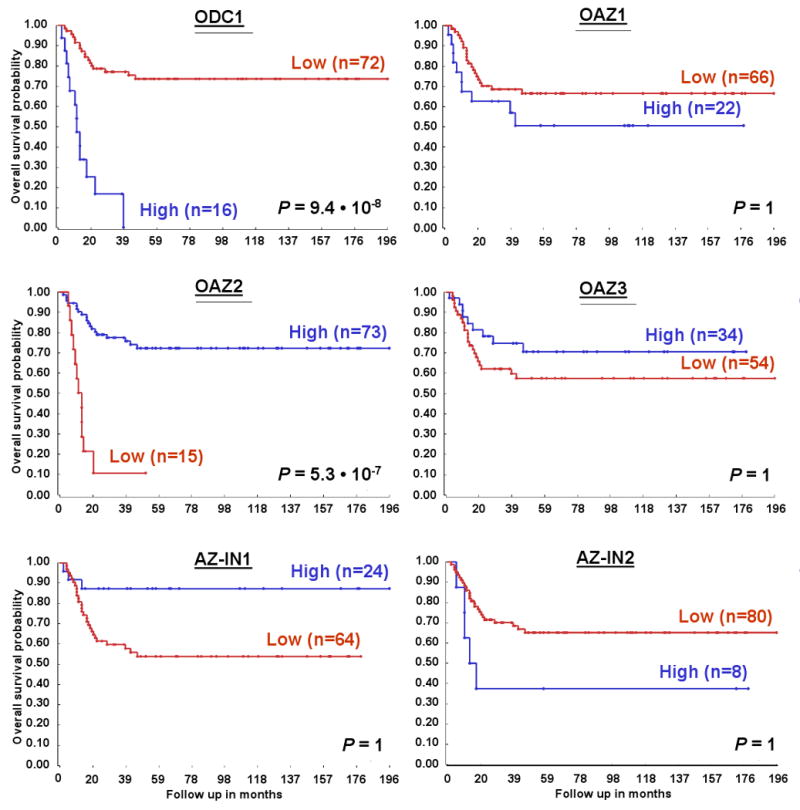
Correlation of ODC and ODC activity-regulating gene expression with NB patient survival prognosis. Kaplan-Meier graphs representing the survival prognosis of 88 NB patients based on high or low expression levels of ODC, or of the ODC activity-regulating genes OAZ1, OAZ2, OAZ3 as well as AZ-IN1 and AZ-IN2. The survival probability of NB patients (follow-up over 196 months) with low ODC expression is significantly higher than of patients with high ODC expression. In contrast, patients with high OAZ2 expression have significantly better survival prognosis than patients with low OAZ2 expression. No significant correlations were apparent between patient survival prognosis and OAZ1, OAZ3, AZ-IN1, or AZ-IN2 expression; the differences seen between the “high” and “low” groups do not represent significantly different populations after Bonferoni correction for multiple testing. For the Kaplan-Meier analysis, the P values were calculated for all 72 groups tested. For ODC, the 72 “low” versus the 16 “high” group represents the highest P value (P = 9.4 · 10-8), but the P value was < 1.4 · 10-4 (P < 0.01, corrected for multiple testing) for all groups from 27 “low”/61 “high” to 79 “low”/9 “high”. For OAZ2, the 73 “high” versus the 15 “low” group represents the highest P value (P = 5.3 · 10-7), and in addition the P value was < 1.4 · 10-4 for all groups from 9 “low”/79 “high” to 25 “low”/63 “high”. Statistical analysis was performed with the log-rank test.
Next, we tested the correlation between gene expression and patient survival prognosis for genes known to influence ODC activity: the AZ antizymes and the AZ-IN antizyme-inhibitors (See Materials and Methods for gene names and annotation). We first studied the ODC-inhibiting antizymes OAZ1, OAZ2, and OAZ3. While no significant correlation between gene expression and survival was found for OAZ1 and OAZ3, OAZ2 mRNA content was identified as an excellent predictor of survival. Interestingly, high NB tumor expression of OAZ2 correlated with the patient group with good prognosis (n=73, ∼75% overall survival), whereas low OAZ2 expression correlated with poor prognosis (n=15, ∼10% survival after only 20 months, P = 5.3 • 10-7). Similar to ODC, significant prognostic results for OAZ2 were obtained for a large number of different groups (see Fig. 1 legend). Finally, no significant results were obtained for the expression of the antizyme inhibitors AZ-IN1 and AZ-IN2 (Fig. 1). Based on these findings, we further investigated the association of ODC and OAZ2 expression with NB genetic and clinical characteristics.
Correlation of ODC expression with NB clinical features
Using Affymetrix profiling, we were able to detect ODC mRNA expression in all tumors of the NB88 set. The average ODC expression was high (1,828 ± 159, compared with GAPDH expression values of ∼6,200). Similarly, ODC was also expressed to very high levels in all 24 samples of a NB cell line set (average expression 3,571 ± 379, not shown).
Next, the statistical significance between ODC expression and each important clinical NB feature was established (see Introduction). For the correlation of ODC expression with age at diagnosis, we compared the 40 patient samples of patients older than 1 year with those of ages ≤ 1 year. This yielded a significant difference between the two clinically important age groups: NB tumors from patients older than 1 year have a significant higher ODC expression (P = 2.0 · 10-6, Fig. 2A). In addition, ODC expression correlates well with overall survival: it is higher in 31 tumor samples from patients that had died, compared with 57 samples from patients that were still alive at the moment of analysis (P = 4.1 · 10-7, Fig. 2A). These findings further confirmed the data from the Kaplan-Meier analysis (Fig. 1).
Figure 2.
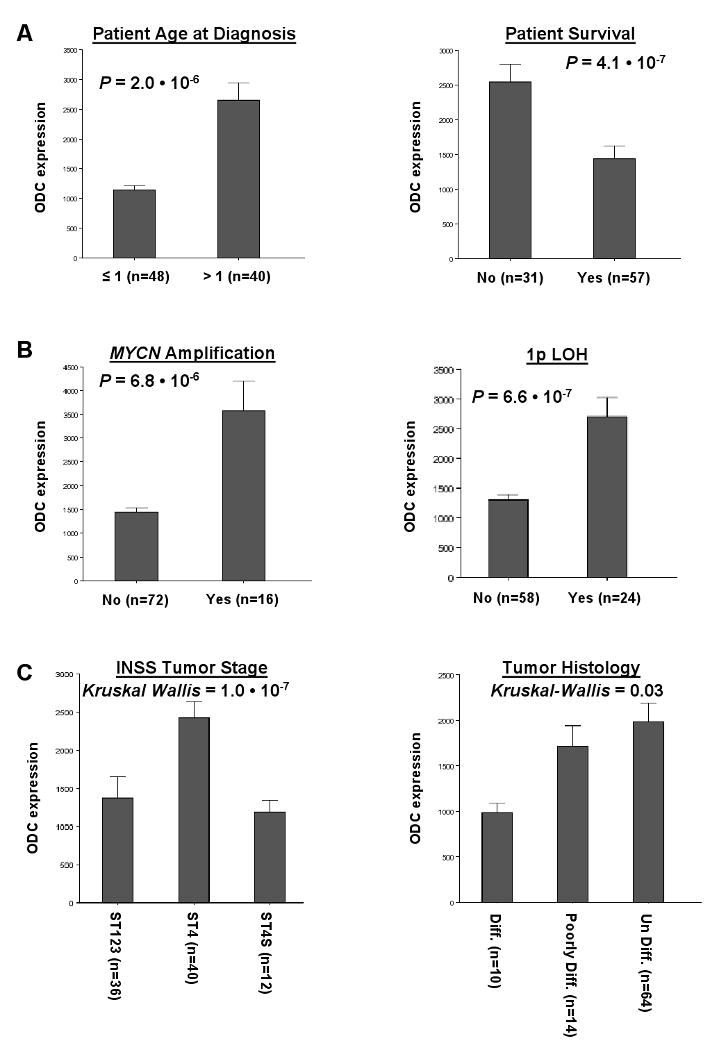
Correlation of ODC expression levels with important clinical features of NB. A, Correlation with patient data. Children with NB of ages >1 year (40 samples) show significantly higher ODC tumor expression than infants of ages <1 year (48 samples; P = 2.0 · 10-6). In addition, NB patients that have died before the moment of analysis (31 samples) expressed significantly higher ODC tumor levels than patients that were still alive at that time (57 samples; P = 4.1 · 10-7). B, Correlation with common genetic aberrations. NB tumors with MYCN amplification (16 samples) showed significantly higher ODC expression than tumors without MYCN amplification (72 samples; P = 6.8 · 10-6). Also, in NB tumors with 1p LOH (24 samples), ODC expression was significantly higher than in tumors without 1p loss (58 samples; P = 6.6 · 10-7). C, Correlation with tumor staging and histology. ODC expression was significantly elevated in high-stage tumors (ST4, 40 samples) compared to lower stage tumors (ST1-3, 36 samples and 4S, 12 samples; Kruskal-Wallis P = 1.0 · 10-7) tumors. The P values between ST1-3 and 4, and between ST4 and 4S were P = 2.7 · 10-9, and 3.3 · 10-5, respectively. ODC expression was lowest in differentiated NB tumors (10 samples), and higher in less differentiated NB tumors (poorly differentiated, 14 samples; or undifferentiated, 64 samples) (Kruskal-Wallis P = 0.03). The P value between differentiated NB tumors and poorly differentiated NB tumors was P = 5.4 · 10-3. Only significant correlations between ODC expression and NB clinical features are shown, for a list of correlations tested see Materials and Methods. Statistical analysis was performed using the non-parametric Mann-Whitney U test or Kruskal-Wallis tests where indicated. For reasons of representation, the bar plots show actual expression values. For expression value calculations, see Materials and Methods.
Amplification of the MYCN oncogene on chromosome 2p occurs in ∼20% of NB tumors. This genomic aberration is typical for very poor prognosis, and is therefore one of the most used predictors for NB tumor risk stratification 1, 2. As shown in Fig. 2B, the relation between MYCN amplification and ODC expression in the NB16 tumor set is highly significant and approximately 2.5 times higher than in the NB72 tumor set without MYCN amplification (P = 6.8 · 10-6), thus further supporting a role of ODC in NB tumorigenesis. Furthermore, ODC expression positively correlates with 1p LOH (P = 6.6 · 10-7, Fig. 2B). Like MYCN amplification, 1p LOH is a common genetic defect with established prognostic value for poor NB patient outcome. Therefore, ODC expression is correlated with two important genetic features that frequently occur in the most aggressive NB tumors 1, 2.
ODC expression levels were also compared between NB tumors of different INSS stages and histology. We found that the most advanced, stage 4 tumors express higher levels of ODC mRNA than lower stage tumors (stages 1-3 and 4S; P = 1.0 · 10-7, Fig. 2C). Moreover, ODC expression was found to correlate with tumor differentiation: its expression is lowest in differentiated NB tumors, and increased in poorly or non-differentiated NB tumor subclasses (Fig. 2C).
ODC expression in relationship to MYCN amplification
A number of studies have provided evidence for the regulation of the ODC gene by MYCN 4, 5, 16. In addition, the results above indicated a correlation between ODC expression and MYCN amplification in NB (Fig. 2B). Indeed, the ODC expression in NB tumors with MYCN amplification was more than twice that in tumors without (3,566 ± 626 versus 1,442 ± 90, respectively, P = 6.8 · 10-6).
We therefore wondered whether the poor prognosis found for tumors with high ODC expression could be ascribed to the MYCN amplification in these tumors. To that end, the Kaplan-Meier analysis performed in Fig. 1 was repeated stratified for non-MYCN amplified NB tumors (“NB72”, Fig. 3), and for MYCN-amplified NB tumors (“NB16”, not shown), respectively. Remarkably, we found that high ODC expression is also indicative of poor prognosis in NB tumors without MYCN amplification (Fig. 3). An about 2-fold difference in survival (during a 196-month follow-up period) was found between tumors with low or high ODC expression (P = 4.5 · 10-4). In contrast, NB tumors with MYCN amplification and much higher ODC values showed no significant difference in survival between tumors with low or high ODC expression (not shown).
Figure 3.
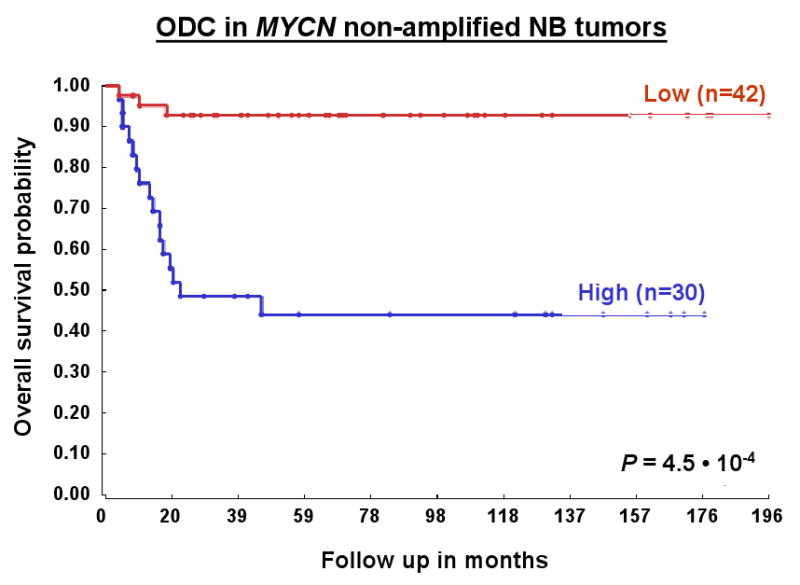
Prognostic significance of ODC expression in NB patients dependent on MYCN amplification status. Kaplan-Meier graphs representing the survival prognosis of 88 NB patients based on high or low expression levels of ODC separated for MYCN amplification status. NB72 represents the 72 patients without tumor MYCN amplification: The survival probability of NB patients with low ODC expression is significantly higher than of patients with high ODC expression (ODC expression cut-off point is 1,355). The ODC expression was between 420 and 3,383. For the Kaplan-Meier analysis, the P values were calculated for all 56 groups. For patients with NB without MYCN amplification, the 42 “low” versus the 30 “high” group represents the highest P value (P = 4.5 · 10-4), but the P value was < 1.8 · 10-4 (< 0.01 after correction for multiple testing) for all groups from 31 “low”/41 “high” to 56 “low”/16 “high”. P values were determined as described for Fig. 1. For the 16 patients with tumor MYCN amplification (NB16), no significant difference in survival prognosis could be found between patients with high ODC tumor expression and patients with low ODC tumor expression (not shown).
Correlation of OAZ2 expression with NB clinical features
In contrast to ODC, expression of the ODC-inhibiting OAZ2 gene showed significant correlation with good prognosis using Kaplan-Meier analysis (Fig. 1). We therefore also investigated the relation between OAZ2 and NB clinical features in detail.
Affymetrix analysis of the NB88 set allowed detection of OAZ2 mRNA in 86 of 88 tumors, with a moderate average expression (382 ± 12). OAZ2 was also expressed in all 24 samples of a NB cell line set (average expression 296 ± 22, not shown). In contrast to ODC, OAZ2 expression correlates well with favorable overall survival: OAZ2 expression is significantly lower in the 31 tumor samples from patients that had died than in the 57 samples from patients that still lived (P = 1.6 · 10-4, Fig. 4A).
Figure 4.
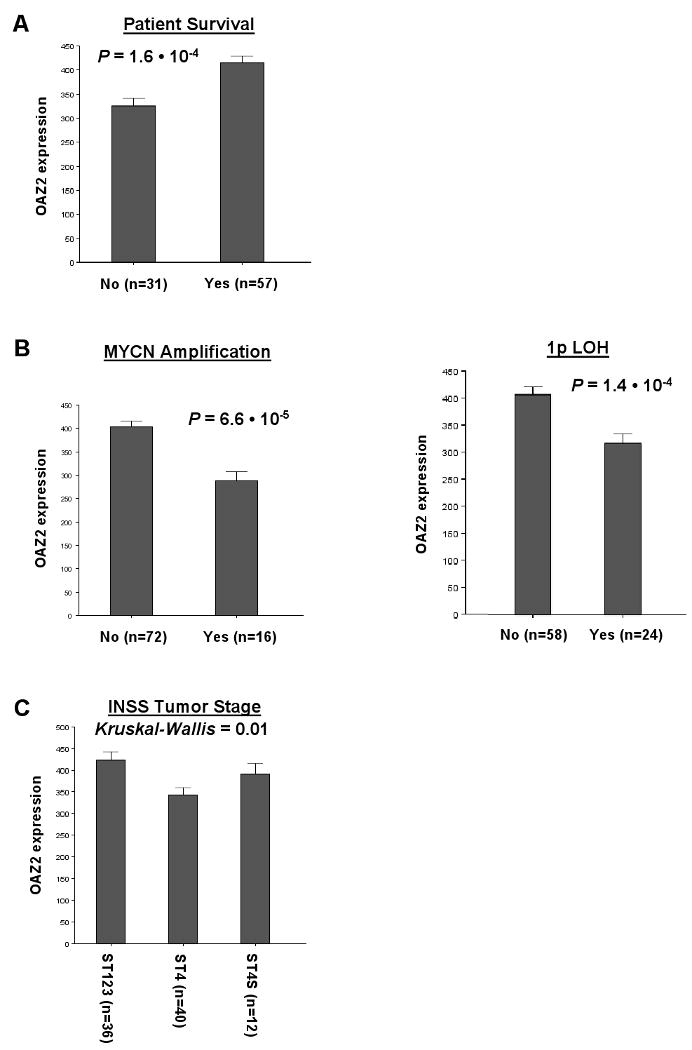
Correlation of OAZ2 expression levels with important clinical features of NB. A, Correlation with patient survival. Tumor samples from NB patients that have died before the moment of analysis (31 samples) exhibited significantly lower OAZ2 mRNA content than tumors from patients that were still alive at that time (57 samples; P = 1.6 · 10-4). B, Correlation with common genetic aberrations. NB tumors with MYCN amplification (16 samples) showed significantly lower OAZ2 expression than tumors without MYCN amplification (72 samples; P = 6.6 · 10-5). Also, in NB tumors with 1p LOH (24 samples), OAZ2 expression was significantly lower than in tumors without 1p loss (58 samples; P = 1.4 · 10-4). C, Correlation with INSS tumor staging. OAZ2 expression was significantly decreased in high-stage tumors (ST4, 40 samples) compared to lower stage tumors (ST1-3, 36 samples and 4S, 12 samples; Kruskal-Wallis P = 0.01) tumors. The P value between ST1-3 and 4 was P = 2.9 · 10-3. Only significant correlations between OAZ2 expression and NB clinical features are shown, for a list of correlations tested see Materials and Methods. Statistical analysis, bar plot representation, and expression value calculations are as in Figure 2.
OAZ2 expression also shows a significant relation with MYCN amplification: the tumors in “NB16” had lower OAZ2 expression than those in “NB72” (P = 6.6 · 10-5, Fig. 4B). Similarly, OAZ2 expression correlates with chromosome 1p LOH; tumors with 1p loss (24 samples) have lower OAZ2 mRNA levels than those with normal 1p chromosome arms (58 samples, P = 1.4 · 10-4, Fig. 4B). Like ODC, OAZ2 expression is therefore correlated with these two important NB genetic features. In contrast to ODC, OAZ2 expression is lowest in NB tumors with these two frequent NB chromosomal aberrations.
Finally, OAZ2 expression levels were assessed in NB tumors of different INSS stages. We found that the most advanced, stage 4 tumors expressed the lowest levels of OAZ2 mRNA when compared with the lower stage tumors of stages 1-3 and 4S (Fig. 4C).
ODC and OAZ2 expression in NB and other tumors and in normal tissue
In the previous paragraph we observed inverse correlations for ODC and OAZ2 expression with important NB features. We therefore wondered whether we could find an actual inverse expression correlation between these two genes in the NB88 tumor set. Fig. 5A shows a visual representation of ODC and OAZ2 mRNA expression measured with Affymetrix profiling for every tumor in the NB88 set. A clear inverse correlation between ODC and OAZ2 was observed (r = -0.411, P = 6.9 · 10-5 (2log Pearson)). In addition, a group of 8 tumors could be identified that had very high ODC expression values in combination with most of the lowest OAZ2 expression levels. These 8 tumors were present in the “poor prognosis” groups in both the ODC and the OAZ2 Kaplan-Meier analyses shown in Fig. 1. Six of these 8 patients have died within 2 years of diagnosis; the group therefore indeed represents a cluster of particularly aggressive NB tumors.
Figure 5.
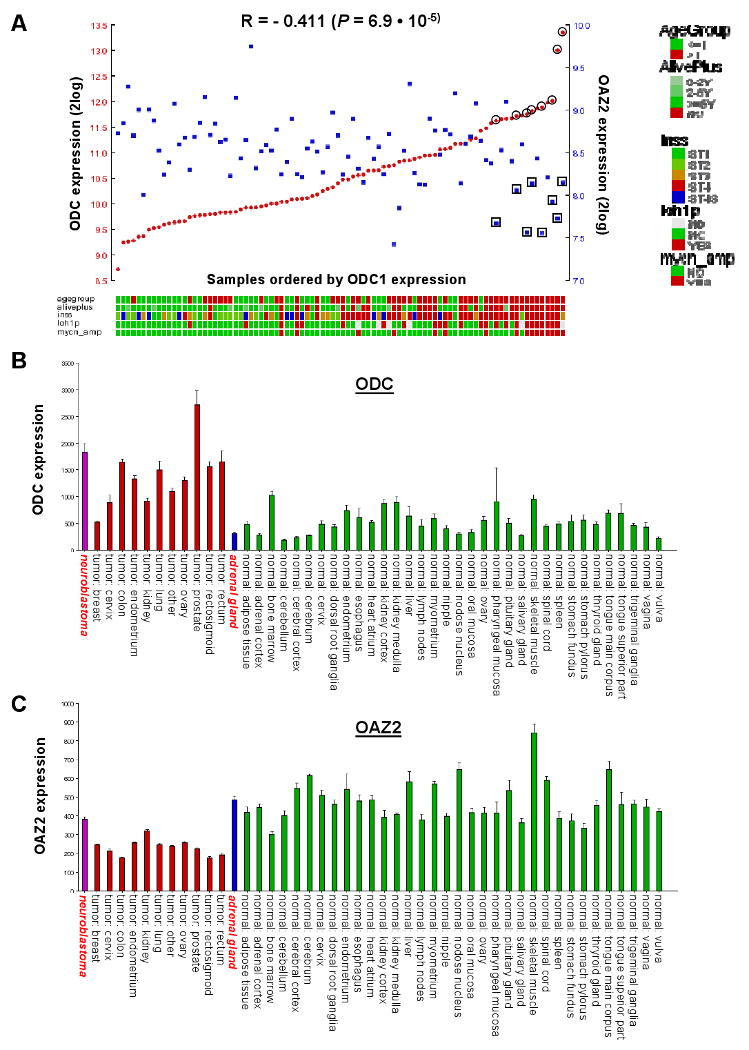
ODC and OAZ2 expression in NB and other tumors and normal tissues. A, ODC and OAZ2 expression correlation in NB tumors: Visual representation of ODC and OAZ2 expression in all 88 NB tumors, ranked horizontally from left to right according to their ODC expression. ODC and OAZ2 expression values for each tumor are visualized with red circles and blue rectangles, respectively. The correlation between ODC and OAZ2 expression is r = -0.411, with a P value of 6.9 · 10-5 (2log Pearson). Below the graph is the clinical annotation of all 88 tumor samples, the annotation legend is to the right of the graph. Eight tumors expressing high levels of ODC as well as low levels of OAZ2 are marked by a double circle or rectangle; these are the 8 tumors with poor prognosis found in both the ODC and OAZ2 Kaplan-Meier analyses in Fig. 1. B, ODC Affymetrix expression profiling in three sets of expression data in the public domain: a set of 41 different human tumor types (EXPO, 1,908 samples total), a set of 65 different normal human tissue types (Roth, 353 samples total), normal adrenal gland tissue (13 samples), and a new set of NB tumors (88 samples). Average ODC expression was: EXPO 1,215 ± 25, Roth 436 ± 17, normal adrenal gland 313 ± 26, NB set 1,828 ± 159 (for comparison: GAPDH expression is 6,000-9,000). Set annotation is below the graph. NB tumors are shown in purple, other tumors in red, normal adrenal gland in blue and normal tissues (Roth) in green. NB tumors and normal adrenal gland are annotated in red, italics, boldface font. For reasons of representation, only Roth sets containing 4 or more samples are shown, the results remain similar to an analysis of the complete Roth set. C, OAZ2 Affymetrix expression profiling. Average OAZ2 expression was: EXPO 238 ± 2, Roth 528 ± 7, normal adrenal gland 488 ± 89, NB set 382 ± 12. Other details are as in A. Note the difference in ODC and OAZ2 expression in normal vs. tumor cervix, endometrium, and ovary tissue.
We also investigated ODC and OAZ2 expression in several Affymetrix expression datasets in the public domain: a set of 13 samples of normal human adrenal gland (the major site for primary NB tumors), the EXPO Set of 41 different human tumor types, and the Roth Set of 65 different normal human tissues. ODC expression in NB was ∼ 4 times higher in NB tumors than in normal adrenal gland (Fig. 5B) suggesting high ODC expression in NB is linked to its tumorigenesis. In addition, ODC expression in fetal neuroblasts, dissected from fetal adrenal gland was similar to that of normal adrenal gland, and much lower than that of neuroblast cells in NB tumors (Supplemental Fig. 1). Opposite to ODC, OAZ2 expression was higher in normal adrenal gland than in NB (Fig. 5C). In addition, ODC expression is about ∼2 fold higher in the EXPO tumor set than in the Roth normal tissue set, and OAZ2 expression about ∼1.5 fold lower in the EXPO set than in the Roth set. Indeed, several tumor sets could be identified in which ODC expression in the tumor series is higher than in the normal tissues, and vice versa for OAZ2 (for details see Figure 5 legend).
Expression of MYCN and ODC mRNA in MYCN-2 NB cells
The foregoing experiments provided important information on the expression of ODC and OAZ2 mRNAs in NB tumors. To investigate at the cellular level whether ectopic expression of MYCN affects ODC levels, we used a MYCN-inducible NB cell culture system 31. Induced or non-induced MYCN-2 cells were harvested at different time points (0, 6, 12, 24, 48, and 72 hours) and mRNA levels were first determined by semi-quantitative RT-PCR. As shown in Fig. 6A, ODC mRNA levels are higher in MYCN-induced NB cells. In an identical manner, MYCN mRNA levels were measured, confirming that the MYCN-2 cell system is functional and expresses MYCN mRNA upon induction with doxycycline (Fig. 6A). In addition, Western blot analysis confirmed the production of MYCN protein as a result of doxycycline addition (Supplemental Fig. 2). OAZ2 mRNA levels did not change in response to MYCN expression (Fig. 6A).
Figure 6.
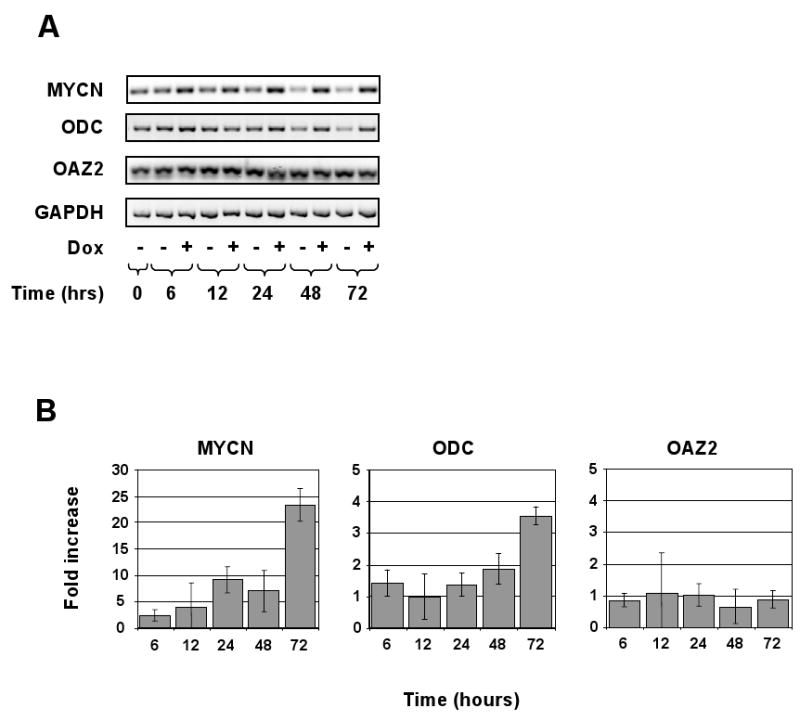
Expression of MYCN regulates ODC mRNA levels in the MYCN-2 NB cell line. A, The MYCN-inducible NB cell line MYCN-2 was used to determine the effect of ectopic MYCN expression on ODC mRNA levels. Cells were induced with doxycycline (Dox) or left untreated for 0, 6, 12, 24, 48, and 72 hours. RNA was isolated and reverse-transcriptase polymerase chain reaction (RT-PCR) performed using MYCN, ODC, OAZ2, and GAPDH (control) primers and the RT-PCR reaction was resolved by agarose gel electrophoresis. ODC mRNA expression was higher in cells that over-express MYCN. Data are representative of four independent experiments (n=4). B, The RNA samples shown in (A) were analyzed by real-time RT-PCR and the fold-change compared to control was determined.
To quantify the mRNA levels in MYCN-2 cells, the same mRNA collections were analyzed by real-time RT-PCR. As shown in Fig. 6B, ODC mRNA levels were several-fold higher than in non-induced MYCN-2 cells, while OAZ2 levels did not change, thus confirming the data in Fig. 6A.
Discussion
In this study, we found that ODC mRNA expression shows highly significant correlations with several important clinical and genetic NB features, all of which are common to aggressive, high-stage NB tumors with poor prognosis. In addition, our data suggest that OAZ2 expression is significantly correlated with several NB features that are most common to more benign, low-stage NB tumors with good prognosis. Indeed, high ODC expression, combined with low OAZ2 expression, occurs in a very aggressive subset of NB tumors. These results suggest that high tumor PA biosynthesis rates, as a result of high ODC expression negatively influence NB patient prognosis, further aided by low ODC inhibition and high PA caused by low OAZ2 expression. Indeed, 8 out of 16 tumors with poor prognosis in the ODC Kaplan-Meier analysis are also present in the group with poor prognosis for OAZ2 expression (15 tumors total). Within the NB88 set, we thus identified a group of 8 tumors characterized by very poor prognosis; high ODC expression and low OAZ2 expression. Data mining of Affymetrix data in the public domain suggest high ODC and low OAZ2 expression is also typical for other tumor types (see also Fig. 5).
The importance of ODC over-expression for tumor progression has been observed in a number of different cancers, but fewer studies have examined the role of the inhibitory proteins OAZ1, and especially OAZ2, in cancer. Transgenic mice with targeted overexpression of OAZ1 exhibit slower cancer induction in skin carcinogenesis protocols with chemical, genetic and physical stimuli (reviewed in 33). On the other hand, studies done in both animal models 34, 35 and humans 25, 36 have demonstrated a loss of OAZ1 expression or activity in tumor tissue relative to normal tissue. In contrast, much less is known about the role of OAZ2 in cancer. One study shows that OAZ2 over-expression leads to inhibition of NFκB, and thereby of NFκB-dependent transcription of e.g. cell-cycle genes important for tumorigenesis 37.
In general, the expression of OAZ1 is higher than that of OAZ2 in most tissues. This is also true in the NB88 set analyzed in this study. However, OAZ1 and OAZ2 seem to have only partially similar functions: OAZ1 has a much more efficient ODC-degrading activity than OAZ2, while OAZ2 is especially involved in the inhibition of PA uptake (reviewed in 9, 20, 21). It therefore seems that the combination of efficient PA production by a high ODC expression, combined with high PA uptake caused by low expression of the uptake inhibitor OAZ2 stimulates NB progression.
ODC expression in the NB88 set was significantly correlated to MYCN amplification (Fig. 2). Specifically, ODC expression was much higher in tumors with MYCN amplification compared to tumors without MYCN amplification (NB16 and NB72, respectively). In addition, there was a significant, positive correlation between ODC and MYCN expression in the NB88 set (r = 0.53, P = 1.3 · 10-7, Table 1). This prompted us to further investigate the relationship between ODC and MYCN. Although the ODC and MYCN genes are both located on chromosome band 2p24-25, and NB tumors with MYCN amplification regularly contain several different 2p amplicons, the two genes are not always co-amplified in NB tumors 17, 38-40. Therefore, the correlation between ODC and MYCN in NB does not seem to be caused by mere co-amplification of these two genes. In contrast, ODC transcriptional activation as a result of MYCN expression in NB cells has been clearly demonstrated 4, 5, 41 and we confirmed that ODC mRNA is up-regulated upon ectopic MYCN over-expression in a time-course cell culture experiment (Fig. 6). Finally, in NB72, no significant correlation between MYCN and ODC expression could be found (Table 1 and Supplemental Fig. 4). This implies that MYCN cannot be the sole transcription factor responsible for ODC expression in NB tumors without MYCN amplification. Also the two other MYC transcription factors, c-MYC and L-MYC, did not show significant correlation with ODC1 expression in NB72 (not shown).
Table 1. MYCN-MAX-MAD gene family expression, clinical significance, and correlation to ODC expression.
| Gene | Expression | Prognosis | Correlation with ODC (2logPearson) | |||||
|---|---|---|---|---|---|---|---|---|
| Name | Gene_ID | NB88 | NB88 | NB72 | NB88 | NB72 | ||
| P | P | R | P | R | P | |||
| MYCN | 4613 | 1370 (88) | 2.7 · 10-3 * | 0.72 | 0.53 | 1.3 · 10-7 | 0.19 | 0.11 |
| MAX | 4149 | 711 (88) | 0.72 | 1.00 | -0.01 | 0.94 | -0.14 | 0.24 |
| MAD1 (MXD1) | 4084 | 240 (88) | 1.00 | 1.00 | -0.18 | 0.09 | -0.31 | 0.01 |
| MAD2 (MXD2/MXI1) | 4601 | 1176 (88) | 1.6 · 10-3 ** | 1.1 · 10-5 ** | -0.25 | 0.02 | -0.46 | 5.7 · 10-5 |
| MAD3 (MXD3) | 83463 | 133 (11) | 1.00 | 1.00 | 0.27 | 0.01 | 0.28 | 0.02 |
| MAD4 (MXD4) | 10608 | 114 (67) | 1.00 | 1.00 | -0.05 | 0.67 | -0.31 | 0.01 |
| MAD5 (MXD5/MGA) | 23269 | 167 (88) | 1.00 | 1.00 | 0.38 | 2.7 · 10-4 | 0.30 | 0.01 |
| MAD6 (MXD6/MNT) | 4335 | 266 (87) | 0.72 | 0.72 | 0.12 | 0.27 | -0.06 | 0.64 |
| MAD7 (MXD7/MLX) | 6945 | 329 (88) | 1.00 | 3.6 · 10-3 * | 0.36 | 7.0 · 10-4 | 0.41 | 3.2 · 10-4 |
Gene: gene names and NCBI Gene_ID, Expression: average expression in the NB88 set, with in parentheses the number of tumors with detectable expression, Prognosis: P values of Kaplan-Meier analyses in the NB88 and NB72 sets. Statistical analysis was performed with the log-rank test.
* and ** denote that high expression is significantly correlated with poor and good prognosis, respectively. Correlation: 2logPearson correlations and P values between MYCN-MAX-MAD gene expression and that of ODC. Statistical analyses were performed using the non-parametric Mann-Whitney U test. Statistically significant correlations are signified by bold face print on a grey field.
We therefore investigated the expression of other transcription factor genes that could be involved in ODC regulation in NB. For full transcriptional activity, the MYCN protein has to dimerize with other bHLHZip (basic region/helix-loop-helix/leucine zipper) transcription factors, like MAX and MAD (also known as MXD). While both MYC and MAX activate their downstream target genes, the MAD proteins have a repressing effect on target gene activity 41. Transfection studies in NB cell lines using an ODC reporter construct showed that both MYC-MAX and MYC-MAD complexes influence ODC transcription. The MYC-MAX dimer had a positive effect on ODC gene activity, whereas MAD-MAX dimers diminished ODC transcription in a NB cell line 42. To explore the involvement of other bHLHZip factors in ODC regulation in NB tumors, we analyzed the expression of MAX and MAD genes in the NB88 and NB72 series. The MAX gene and the MAD genes MAD1-2 and MAD5-7 were expressed in all 88 NB tumors (Table 1). As expected, the significant correlation between MYCN and ODC in the NB88 set disappeared in the NB72 series, suggesting that MYCN is not solely responsible for ODC regulation in NB tumors without MYCN amplification. No correlation could be found between MAX and ODC expression in either NB88 or NB72. However, MAD2 and MAD7 (also known as MXI1 and MLX, respectively) revealed significant correlations with ODC in NB72. Interestingly, the MAD2 gene showed a negative correlation with ODC, suggesting it is involved in negative regulation of the ODC gene. In contrast, the MAD7 gene showed a positive regulation with ODC expression (Table 1 and Supplemental Fig. 4). Additional support for a role for MAD2 and MAD7 in NB tumorigenesis comes from the finding that MAD2 expression is a predictor for good prognosis, whereas MAD7 expression correlates with poor prognosis (Table 1). Inhibition of ODC activity by MAD2 over-expression has been shown in literature 43. Furthermore, the MAD2 gene is located in a region on chromosome 10q that is lost in 18% of NB tumors, and MAD2 was found to be hyper-methylated and silenced in NB tumors 44. Together, these data provide a new clue into ODC regulation in NB and suggest that, in addition to MYCN, MAD2 and MAD7 might be involved in the regulation of ODC in NB.
MYCN amplification has long been recognized as an outstanding predictor for poor prognosis in NB; it identifies about 20% of the most aggressive NB tumors 1-3. Also in our NB88 set, tumors with MYCN amplification show a significantly worse prognosis (Supplemental Fig. 3). However, the significance of MYCN expression in NB progression remains unclear. In NB tumors lacking MYCN amplification, most correlations between MYCN expression levels and NB clinical parameters are no longer highly significant: High MYCN expression, whether at the mRNA or protein level, is not a strong predictor for prognosis 45-47. This was also demonstrated in our study, where MYCN expression in NB72 lost its prognostic value (from P = 2.7 · 10-3 in NB88 to P = 0.72 in NB72, Table 1). In addition, no prognostic values were found for the two other MYC genes c-Myc and L-Myc (results not shown).
NB tumors without amplification of the MYCN gene are difficult to stratify for therapy, also for lack of dependable molecular markers. In this study, we show a significant correlation between mRNA expression and disease progression for ODC and OAZ2, two genes in the PA biosynthesis pathway. Both genes showed strong prognostic values not just in NB88, but also in NB72 (tumors without MYCN amplification). High ODC expression correlated with poor survival in both NB88 and NB72 (P = 9.4 · 10-8, Fig. 1 and P = 4.5 · 10-4, Fig. 3, respectively), which was confirmed in a very recent paper by Hogarty et al. 17. In contrast, high OAZ2 expression showed significant correlation with good survival in both NB88 and NB72 (P = 5.3 · 10-7, Fig. 1 and P = 2.7 · 10-3, not shown, respectively). The combination of high ODC expression and low OAZ2 expression therefore seems a superior prognostic marker for stratification of non-MYCN amplified NB tumors and suggests the selection of PA-targeted therapy. The combination of high ODC and low OAZ2 expression was seen in several tumors (Figure 5), suggesting this observation might be interesting to study in other cancers types as well.
In summary, we have found new clues to the importance of PA metabolism for NB progression. Our data present strong evidence that ODC, and possibly other enzymes of the PA pathway, are novel targets for therapeutic intervention. The use of ODC inhibitors (for example, DFMO or PA analogs) in combination with conventional chemotherapy (at possibly lower doses) or novel, biologically-targeted drugs might improve the therapeutic success rate of NB patients.
Supplementary Material
Acknowledgments
This work was initiated by A.S.B. It was funded by grants from the National Institutes of Health (NIH): R01 CA-111419 and R01 CA-111419-S1 to A.S.B, and R01 CA-018138 to A.E.P., the Dutch Cancer Society (“KWF Kankerbestrijding”): UVA2003-2849 to D.G. and R.V., and UVA2005-3665 to D.G., and the “Stichting Kinderen met Kanker” (SKK): to R.V. The funding organizations had no role in the study design; in the collection, analysis, and interpretation of data; in the writing of the manuscript; and in the decision to submit the manuscript for publication. We thank Dr. Jason Shohet (Texas Children's Hospital) for providing the NB cell line MYCN-2, Dr. Ingrid Øra and Peter van Sluis (University of Amsterdam) for the NB Affymetrix profiling and Dr. Tamas Borsics (Cancer Research Center of Hawaii) for excellent advice and primer design.
Abbreviations
- OAZ1
antizyme 1
- OAZ2
antizyme 2
- OAZ3
antizyme 3
- AZ-IN1
antizyme inhibitor 1
- AZ-IN2
antizyme inhibitor 2
- GAPDH
glyceraldehyde-3-phosphate dehydrogenase
- INSS
International Neuroblastoma Staging System
- LOH
loss of heterozygosity
- NB
neuroblastoma
- ODC
ornithine decarboxylase
- PA
polyamines
- Put
putrescine
- Spd
spermidine
- Spm
spermine
Footnotes
Novelty and impact of the paper: We show that high ornithine decarboxylase (ODC) and low antizyme 2 (OAZ2) gene expression in neuroblastoma tumors correlates with several unfavorable genetic and clinical features, including MYCN amplification. High ODC expression also showed significant correlation with poor survival prognosis in Kaplan-Meier analyses stratified for patients without MYCN amplification, thus suggesting an additional role for ODC independent of MYCN. We further provide evidence that transcription factors from the Mad/Max family might be involved in ODC regulation in these tumors. Collectively, our study provides strong evidence that ODC contributes to the malignant phenotype of NB, allows a first insight into the possible mechanism by which this occurs, and suggests that targeting ODC and ODC-regulating enzymes may be a new approach for NB therapy.
Conflict of interest statement: None declared.
Appendix: Supplementary material: Supplementary data associated with this article can be found in the online version.
References
- 1.Brodeur GM. Neuroblastoma: biological insights into a clinical enigma. Nat Rev Cancer. 2003;3:203–16. doi: 10.1038/nrc1014. [DOI] [PubMed] [Google Scholar]
- 2.Maris JM, Hogarty MD, Bagatell R, Cohn SL. Neuroblastoma. Lancet. 2007;369:2106–20. doi: 10.1016/S0140-6736(07)60983-0. [DOI] [PubMed] [Google Scholar]
- 3.Cohn SL, Tweddle DA. MYCN amplification remains prognostically strong 20 years after its “clinical debut”. Eur J Cancer. 2004;40:2639–42. doi: 10.1016/j.ejca.2004.07.025. [DOI] [PubMed] [Google Scholar]
- 4.Lu X, Pearson A, Lunec J. The MYCN oncoprotein as a drug development target. Cancer Lett. 2003;197:125–30. doi: 10.1016/s0304-3835(03)00096-x. [DOI] [PubMed] [Google Scholar]
- 5.Lutz W, Stohr M, Schurmann J, Wenzel A, Lohr A, Schwab M. Conditional expression of N-myc in human neuroblastoma cells increases expression of alpha-prothymosin and ornithine decarboxylase and accelerates progression into S-phase early after mitogenic stimulation of quiescent cells. Oncogene. 1996;13:803–12. [PubMed] [Google Scholar]
- 6.Pegg AE. Regulation of ornithine decarboxylase. J Biol Chem. 2006;281:14529–32. doi: 10.1074/jbc.R500031200. [DOI] [PubMed] [Google Scholar]
- 7.Casero RA, Jr, Marton LJ. Targeting polyamine metabolism and function in cancer and other hyperproliferative diseases. Nat Rev Drug Discov. 2007;6:373–90. doi: 10.1038/nrd2243. [DOI] [PubMed] [Google Scholar]
- 8.Gerner EW, Meyskens FL., Jr Polyamines and cancer: old molecules, new understanding. Nat Rev Cancer. 2004;4:781–92. doi: 10.1038/nrc1454. [DOI] [PubMed] [Google Scholar]
- 9.Wallace HM, Fraser AV, Hughes A. A perspective of polyamine metabolism. Biochem J. 2003;376:1–14. doi: 10.1042/BJ20031327. [DOI] [PMC free article] [PubMed] [Google Scholar]
- 10.Shantz LM, Levin VA. Regulation of ornithine decarboxylase during oncogenic transformation: mechanisms and therapeutic potential. Amino Acids. 2007;33:213–23. doi: 10.1007/s00726-007-0531-2. [DOI] [PubMed] [Google Scholar]
- 11.Levin VA, Hess KR, Choucair A, Flynn PJ, Jaeckle KA, Kyritsis AP, Yung WK, Prados MD, Bruner JM, Ictech S, Gleason MJ, Kim HW. Phase III randomized study of postradiotherapy chemotherapy with combination alpha-difluoromethylornithine-PCV versus PCV for anaplastic gliomas. Clin Cancer Res. 2003;9:981–90. [PubMed] [Google Scholar]
- 12.Meyskens FL, Jr, McLaren CE, Pelot D, Fujikawa-Brooks S, Carpenter PM, Hawk E, Kelloff G, Lawson MJ, Kidao J, McCracken J, Albers CG, Ahnen DJ, et al. Difluoromethylornithine plus sulindac for the prevention of sporadic colorectal adenomas: A randomized placebo-controlled, double-blind trial. Cancer Prev Res. 2008;1:32–8. doi: 10.1158/1940-6207.CAPR-08-0042. [DOI] [PMC free article] [PubMed] [Google Scholar]
- 13.Seiler N. Thirty years of polyamine-related approaches to cancer therapy. Retrospect and prospect. Part 1. Selective enzyme inhibitors. Curr Drug Targets. 2003;4:537–64. doi: 10.2174/1389450033490885. [DOI] [PubMed] [Google Scholar]
- 14.Simoneau AR, Gerner EW, Nagle R, Ziogas A, Fujikawa-Brooks S, Yerushalmi H, Ahlering TE, Lieberman R, McLaren CE, Anton-Culver H, Meyskens FL., Jr The effect of difluoromethylornithine on decreasing prostate size and polyamines in men: results of a year-long phase IIb randomized placebo-controlled chemoprevention trial. Cancer Epidemiol Biomarkers Prev. 2008;17:292–9. doi: 10.1158/1055-9965.EPI-07-0658. [DOI] [PMC free article] [PubMed] [Google Scholar]
- 15.Ravanko K, Jarvinen K, Paasinen-Sohns A, Holtta E. Loss of p27Kip1 from cyclin E/cyclin-dependent kinase (CDK) 2 but not from cyclin D1/CDK4 complexes in cells transformed by polyamine biosynthetic enzymes. Cancer Res. 2000;60:5244–53. [PubMed] [Google Scholar]
- 16.Wallick CJ, Gamper I, Thorne M, Feith DJ, Takasaki KY, Wilson SM, Seki JA, Pegg AE, Byus CV, Bachmann AS. Key role for p27Kip1, retinoblastoma protein Rb, and MYCN in polyamine inhibitor-induced G1 cell cycle arrest in MYCN-amplified human neuroblastoma cells. Oncogene. 2005;24:5606–18. doi: 10.1038/sj.onc.1208808. [DOI] [PubMed] [Google Scholar]
- 17.Hogarty MD, Norris MD, Davis K, Liu X, Evageliou NF, Hayes CS, Pawel B, Guo R, Zhao H, Sekyere E, Keating J, Thomas W, et al. ODC1 is a critical determinant of MYCN oncogenesis and a therapeutic target in neuroblastoma. Cancer Res. 2008;68:9735–45. doi: 10.1158/0008-5472.CAN-07-6866. [DOI] [PMC free article] [PubMed] [Google Scholar]
- 18.Rounbehler RJ, Li W, Hall MA, Yang C, Fallahi M, Cleveland JL. Targeting ornithine decarboxylase impairs development of MYCN-amplified neuroblastoma. Cancer Res. 2009;69:547–53. doi: 10.1158/0008-5472.CAN-08-2968. [DOI] [PMC free article] [PubMed] [Google Scholar]
- 19.Matsufuji S, Matsufuji T, Miyazaki Y, Murakami Y, Atkins JF, Gesteland RF, Hayashi S. Autoregulatory frameshifting in decoding mammalian ornithine decarboxylase antizyme. Cell. 1995;80:51–60. doi: 10.1016/0092-8674(95)90450-6. [DOI] [PMC free article] [PubMed] [Google Scholar]
- 20.Coffino P. Regulation of cellular polyamines by antizyme. Nat Rev Mol Cell Biol. 2001;2:188–94. doi: 10.1038/35056508. [DOI] [PubMed] [Google Scholar]
- 21.Mangold U. The antizyme family: polyamines and beyond. IUBMB Life. 2005;57:671–6. doi: 10.1080/15216540500307031. [DOI] [PubMed] [Google Scholar]
- 22.Albeck S, Dym O, Unger T, Snapir Z, Bercovich Z, Kahana C. Crystallographic and biochemical studies revealing the structural basis for antizyme inhibitor function. Protein Sci. 2008;17:793–802. doi: 10.1110/ps.073427208. [DOI] [PMC free article] [PubMed] [Google Scholar]
- 23.Mangold U. Antizyme inhibitor: mysterious modulator of cell proliferation. Cell Mol Life Sci. 2006;63:2095–101. doi: 10.1007/s00018-005-5583-4. [DOI] [PMC free article] [PubMed] [Google Scholar]
- 24.Keren-Paz A, Bercovich Z, Porat Z, Erez O, Brener O, Kahana C. Overexpression of antizyme-inhibitor in NIH3T3 fibroblasts provides growth advantage through neutralization of antizyme functions. Oncogene. 2006;25:5163–72. doi: 10.1038/sj.onc.1209521. [DOI] [PubMed] [Google Scholar]
- 25.Jung MH, Kim SC, Jeon GA, Kim SH, Kim Y, Choi KS, Park SI, Joe MK, Kimm K. Identification of differentially expressed genes in normal and tumor human gastric tissue. Genomics. 2000;69:281–6. doi: 10.1006/geno.2000.6338. [DOI] [PubMed] [Google Scholar]
- 26.Schaner ME, Davidson B, Skrede M, Reich R, Florenes VA, Risberg B, Berner A, Goldberg I, Givant-Horwitz V, Trope CG, Kristensen GB, Nesland JM, et al. Variation in gene expression patterns in effusions and primary tumors from serous ovarian cancer patients. Mol Cancer. 2005;4:26. doi: 10.1186/1476-4598-4-26. [DOI] [PMC free article] [PubMed] [Google Scholar]
- 27.van Duin M, van Marion R, Vissers K, Watson JE, van Weerden WM, Schroder FH, Hop WC, van der Kwast TH, Collins C, van Dekken H. High-resolution array comparative genomic hybridization of chromosome arm 8q: evaluation of genetic progression markers for prostate cancer. Genes Chromosomes Cancer. 2005;44:438–49. doi: 10.1002/gcc.20259. [DOI] [PubMed] [Google Scholar]
- 28.Kanerva K, Makitie LT, Pelander A, Heiskala M, Andersson LC. Human ornithine decarboxylase paralogue (ODCp) is an antizyme inhibitor but not an arginine decarboxylase. Biochem J. 2008;409:187–92. doi: 10.1042/BJ20071004. [DOI] [PubMed] [Google Scholar]
- 29.Revet I, Huizenga G, Chan A, Koster J, Volckmann R, van Sluis P, Ora I, Versteeg R, Geerts D. The MSX1 homeobox transcription factor is a downstream target of PHOX2B and activates the Delta-Notch pathway in neuroblastoma. Exp Cell Res. 2008;314:707–19. doi: 10.1016/j.yexcr.2007.12.008. [DOI] [PubMed] [Google Scholar]
- 30.Barrett T, Troup DB, Wilhite SE, Ledoux P, Rudnev D, Evangelista C, Kim IF, Soboleva A, Tomashevsky M, Edgar R. NCBI GEO: mining tens of millions of expression profiles--database and tools update. Nucleic Acids Res. 2007;35:D760–5. doi: 10.1093/nar/gkl887. [DOI] [PMC free article] [PubMed] [Google Scholar]
- 31.Slack A, Chen Z, Tonelli R, Pule M, Hunt L, Pession A, Shohet JM. The p53 regulatory gene MDM2 is a direct transcriptional target of MYCN in neuroblastoma. Proc Natl Acad Sci U S A. 2005;102:731–6. doi: 10.1073/pnas.0405495102. [DOI] [PMC free article] [PubMed] [Google Scholar]
- 32.Bewick V, Cheek L, Ball J. Statistics review 12: survival analysis. Crit Care. 2004;8:389–94. doi: 10.1186/cc2955. [DOI] [PMC free article] [PubMed] [Google Scholar]
- 33.Pegg AE, Feith DJ. Polyamines and neoplastic growth. Biochem Soc Trans. 2007;35:295–9. doi: 10.1042/BST0350295. [DOI] [PubMed] [Google Scholar]
- 34.Darwiche N, Ryscavage A, Perez-Lorenzo R, Wright L, Bae DS, Hennings H, Yuspa SH, Glick AB. Expression profile of skin papillomas with high cancer risk displays a unique genetic signature that clusters with squamous cell carcinomas and predicts risk for malignant conversion. Oncogene. 2007;26:6885–95. doi: 10.1038/sj.onc.1210491. [DOI] [PubMed] [Google Scholar]
- 35.Tsuji T, Todd R, Meyer C, McBride J, Liao PH, Huang MF, Chou MY, Donoff RB, Wong DT. Reduction of ornithine decarboxylase antizyme (ODC-Az) level in the 7,12-dimethylbenz(a)anthracene-induced hamster buccal pouch carcinogenesis model. Oncogene. 1998;16:3379–85. doi: 10.1038/sj.onc.1201887. [DOI] [PubMed] [Google Scholar]
- 36.Koike C, Chao DT, Zetter BR. Sensitivity to polyamine-induced growth arrest correlates with antizyme induction in prostate carcinoma cells. Cancer Res. 1999;59:6109–12. [PubMed] [Google Scholar]
- 37.Miyagawa J, Muguruma M, Aoto H, Suetake I, Nakamura M, Tajima S. Isolation of the novel cDNA of a gene of which expression is induced by a demethylating stimulus. Gene. 1999;240:289–95. doi: 10.1016/s0378-1119(99)00450-3. [DOI] [PubMed] [Google Scholar]
- 38.Chen QR, Bilke S, Wei JS, Whiteford CC, Cenacchi N, Krasnoselsky AL, Greer BT, Son CG, Westermann F, Berthold F, Schwab M, Catchpoole D, et al. cDNA array-CGH profiling identifies genomic alterations specific to stage and MYCN-amplification in neuroblastoma. BMC Genomics. 2004;5:70. doi: 10.1186/1471-2164-5-70. [DOI] [PMC free article] [PubMed] [Google Scholar]
- 39.George RE, Kenyon R, McGuckin AG, Kohl N, Kogner P, Christiansen H, Pearson AD, Lunec J. Analysis of candidate gene co-amplification with MYCN in neuroblastoma. Eur J Cancer. 1997;33:2037–42. doi: 10.1016/s0959-8049(97)00206-2. [DOI] [PubMed] [Google Scholar]
- 40.Lastowska M, Viprey V, Santibanez-Koref M, Wappler I, Peters H, Cullinane C, Roberts P, Hall AG, Tweddle DA, Pearson AD, Lewis I, Burchill SA, et al. Identification of candidate genes involved in neuroblastoma progression by combining genomic and expression microarrays with survival data. Oncogene. 2007;26:7432–44. doi: 10.1038/sj.onc.1210552. [DOI] [PubMed] [Google Scholar]
- 41.Luscher B. Function and regulation of the transcription factors of the Myc/Max/Mad network. Gene. 2001;277:1–14. doi: 10.1016/s0378-1119(01)00697-7. [DOI] [PubMed] [Google Scholar]
- 42.Cetinkaya C, Hultquist A, Su Y, Wu S, Bahram F, Pahlman S, Guzhova I, Larsson LG. Combined IFN-gamma and retinoic acid treatment targets the N-Myc/Max/Mad1 network resulting in repression of N-Myc target genes in MYCN-amplified neuroblastoma cells. Mol Cancer Ther. 2007;6:2634–41. doi: 10.1158/1535-7163.MCT-06-0492. [DOI] [PubMed] [Google Scholar]
- 43.Wu S, Pena A, Korcz A, Soprano DR, Soprano KJ. Overexpression of Mxi1 inhibits the induction of the human ornithine decarboxylase gene by the Myc/Max protein complex. Oncogene. 1996;12:621–9. [PubMed] [Google Scholar]
- 44.Lazcoz P, Munoz J, Nistal M, Pestana A, Encio IJ, Castresana JS. Loss of heterozygosity and microsatellite instability on chromosome arm 10q in neuroblastoma. Cancer Genet Cytogenet. 2007;174:1–8. doi: 10.1016/j.cancergencyto.2006.08.014. [DOI] [PubMed] [Google Scholar]
- 45.Chan HS, Gallie BL, DeBoer G, Haddad G, Ikegaki N, Dimitroulakos J, Yeger H, Ling V. MYCN protein expression as a predictor of neuroblastoma prognosis. Clin Cancer Res. 1997;3:1699–706. [PubMed] [Google Scholar]
- 46.Cohn SL, London WB, Huang D, Katzenstein HM, Salwen HR, Reinhart T, Madafiglio J, Marshall GM, Norris MD, Haber M. MYCN expression is not prognostic of adverse outcome in advanced-stage neuroblastoma with nonamplified MYCN. J Clin Oncol. 2000;18:3604–13. doi: 10.1200/JCO.2000.18.21.3604. [DOI] [PubMed] [Google Scholar]
- 47.Tang XX, Zhao H, Kung B, Kim DY, Hicks SL, Cohn SL, Cheung NK, Seeger RC, Evans AE, Ikegaki N. The MYCN enigma: significance of MYCN expression in neuroblastoma. Cancer Res. 2006;66:2826–33. doi: 10.1158/0008-5472.CAN-05-0854. [DOI] [PubMed] [Google Scholar]
Associated Data
This section collects any data citations, data availability statements, or supplementary materials included in this article.