

Abstract
Despite the considerable enthusiasm about the yield of novel and replicated discoveries of genetic associations from the new generation of genome-wide association studies (GWAS), the proportion of the heritability of most complex diseases that have been studied to date remains small. Some of this “dark matter” could be due to gene-environment (G×E) interactions or more complex pathways involving multiple genes and exposures. We review the basic epidemiologic study design and statistical analysis approaches to studying G×E interactions individually and then consider more comprehensive approaches to studying entire pathways or GWAS data. In addition to the usual issues in genetic association studies, particular care is needed in exposure assessment and very large sample sizes are required. Although hypothesis-driven pathway-based and “agnostic” GWAS approaches are generally viewed as opposite poles, we suggest that the two can be usefully married using hierarchical modeling strategies that exploit external pathway knowledge in mining genome-wide data.
Keywords: complex diseases, study design, hierarchical models, mechanistic models, synergism, Bayesian methods, exploratory methods for high-dimensional data
INTRODUCTION
Gene-environment (G×E) interactions are worth studying for several reasons (66). They can shed light on fundamental biological mechanisms. They can be important for risk prediction and for evaluating the benefit of changes in modifiable environmental exposures or environmental regulations. Consideration of G×E interactions can improve the power for discovering genes that are involved in the etiology of disease primarily through an interaction effect with no marginal effect (13); conversely, power for discovering environmental effects that act primarily in genetically susceptible individuals can be improved by searching for interactions. Finally, there is the possibility of disentangling the effects of constituents or sources of a complex mixture like air pollution where different components are metabolized by different pathways (51, 111); for example, a study now underway aims to combine epidemiologic analyses of gene-by-particulate interactions with toxicologic assays of biological effects of local particle samples on cell lines with these same genes modified (103). These various considerations motivate the recent NIH Genes, Environment, and Health Initiative1 aimed at leveraging the latest genomic technologies and encouraging the development of new environmental measurement methods to study G×E interactions.
The meaning of the terms “interaction,” “effect modification,” and “synergy/antagonism” has been widely discussed in the epidemiologic and statistical literature for decades (93). Here, we use the term in a generic sense to mean a description of the joint effect of both factors, whether in terms of a statistical model involving only main effects on some scale or requiring additional interaction terms. Effects going in opposite directions in different strata or effects of one factor that exist only in the presence or absence of the other factor intrinsically require interaction terms on any scale (“qualitative interactions”); however, if the effects go in the same direction but differ in magnitude, then any statement about “quantitative interaction” is scale dependent (e.g., additive or multiplicative for risk, natural or logarithmic for continuous traits) (45, 82, 127). This type of interaction should be distinguished from the public health concept of synergy as a joint effect that is greater than the sum of the excess risks from each factor alone or biological interaction as an effect of one factor at the cellular or molecular level that depends on the presence or absence of the other (97). Here, the genetic factor could be a single variant within a particular gene or a collection of variants within one or more genes considered in combination. While some variants may be functional, others may simply be markers for undiscovered genetic variants in linkage disequilibrium (LD) with it, which is particularly likely for the kinds of SNP markers used in genome-wide association studies (GWAS). If only because of the sample size requirements, our focus is primarily on common genetic variants and common exposures, although multiple rare variants could also be important (7, 53, 62, 88). Genetic or environmental effects on disease could also be mediated through somatic mutations, epigenetic changes, influences on gene expression, endogeneous responses (e.g., changes in hormone levels), or other mechanisms beyond the scope of this review (76).
One of the best established G×E interactions is between smoking and NAT2 for bladder cancer (Table 1). A Spanish case-control study (33) found a 1.6-fold interaction odds ratio comparing NAT2 slow vs. rapid or intermediate acetylators and smokers vs. nonsmokers. Subsequent reanalyses (71) found that the slope of the dose-response for pack-years was modified by NAT2 in an intensity-related manner. This interaction has been confirmed in a joint analysis of four other European case-control studies (115). NAT2 is involved in the detoxification of arylamines (Figure 1), which are found in tobacco smoke as well as hair dyes and certain occupations although interactions with the latter exposures are less well established. In colorectal cancer, only weak main effects of well-done meat consumption (a source of heterocyclic amines, HCA), the genes CYP1A2 and NAT2 that are involved in their metabolism, or tobacco smoking (which can induce CYP1A2) were found for colorectal cancer, but an OR of 8.8 was found for those who were both exposed and genetically susceptible (Figure 2); no lower-order interactions were significant (65).
Table 1.
| Smoking Status | NAT2 Phenotype |
Ratio | |
|---|---|---|---|
| Rapid / Intermediate | Slow | ||
| Never | 1 (ref.) | 0.9 (0.6–1.3) | 0.9 (0.6–1.3) |
| Ever | 2.9 (2.0–4.2) | 4.6 (3.2–6.6) | 1.6 (1.3–1.9) |
| Cigarettes per day | Excess RR per pack-year | Ratio | |
| 20 | 0.129 | 0.176 | 1.4 |
| 40 | 0.032 | 0.112 | 3.5 |
| 60 | 0.008 | 0.078 | 9.9 |
Figure 1.
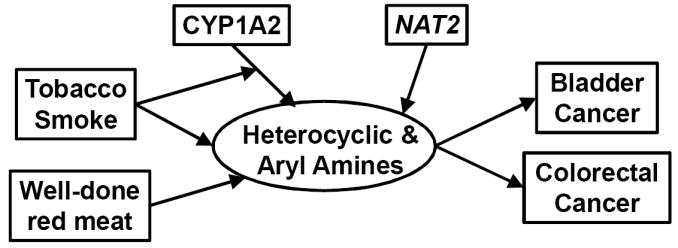
Conceptual basis for G×E interactions in bladder and colon cancer (33, 65, 71)
Figure 2.

Example of a four-way interaction among two environmental factors, well done red meat (R/M = rare-medium, WD = well done) and smoking, and two genes, CYP1A2 phenotype (L = ≤ median; H = > median) and NAT2 (S/I = slow-intermediate, R = rapid). Data from Table 6 of (65), risks scaled separately for ever and never smokers (baseline RR = 1.29 (95%CI 0.7–2.3)).
STUDY DESIGNS
Yang & Khoury (127) and Kraft & Hunter (60) have provided comprehensive reviews of study designs for G×E interactions, so we focus mainly on recent developments.
Case-control, cohort, nested case-control, case-cohort
Although any of the standard epidemiologic study designs can be used for testing interactions, cohort studies have the great advantage of allowing the collection of time-dependent exposure information before disease develops, overcoming the problem of “reverse causation” (the disease or its treatment affecting exposure or its measurement) (66). Since cohort studies of rare diseases would require enormous sample sizes or long follow-up (especially for diseases with long latent periods), case-control studies are the design of choice for studying rare diseases with common exposures. Reverse causation is a non-issue for genetic effects and generally not as big a concern for G×E interactions as for pure environmental effects. Nested case-control and case-cohort designs exploit the advantages of the basic designs, combining the avoidance of bias of cohort designs with the cost-efficiency of case-control designs. In general, the relative efficiency of the various designs for G×E interactions is similar to that of main effects (109).
Counter-matching and two-phase designs
Two novel alternatives allow stratification jointly on disease and exposure status, which would seem to violate the basic design principle that in cohort studies sampling should not depend on disease and in case-control studies not on exposure. The key to the validity of these alternative designs is explicit allowance for the sampling probabilities in the analysis. The two basic incarnations of this idea differ essentially in whether the design is matched. Counter-matching (63) entails selecting controls for cases in a matched fashion, systematically mismatching cases and controls on an exposure surrogate. Two-phase case-control designs (10) entail sampling jointly on disease and some surrogate for exposure in an unmatched fashion. These designs can be much more powerful for testing the main effects of exposure, but also for interaction effects. A variant that counter-matches cases with 3 controls on surrogates for both exposure and genotype can be substantially more efficient than counter-matching only on exposure, only on genotype, or neither (3).
Family-based designs
The most commonly cited advantage of family-based designs for association is protection from bias due to population stratification (a form of confounding by ancestral origins). This benefit comes, however, at the expense of some loss of power compared with using unrelated controls, essentially due to “overmatching” on genotype. However, it can be more powerful for testing G×E interactions (123), because by matching on genotype, the proportion of genotype-concordant, exposure-discordant case-control pairs may be much higher than in unrelated casecontrol series, depending upon allele frequency and exposure similarity within families (36).
In the case-parent-triad design, the genotypes of cases are compared to those that could have transmitted from their parents. For testing genetic main effects, the “transmission disequilibrium test” (100) is a McNemar test of the number of alleles transmitted from heterozygous parents to affected offspring compared with those not transmitted. For testing G×E interactions, the genetic RRs are compared between exposed and unexposed cases (96); no information about the parents’ exposures is needed. This method of testing for G×E interaction is not entirely immune to population-stratification bias, but the assumption required for its validity is that exposure and genotype are conditionally independent given parents’ genotypes, a weaker assumption than the independence across the population required for the case-only design.
Case-only design
Piegorsch et al. (86) introduced a test of G×E interaction based on testing G–E association only among cases. The presence of G–E association in cases can result from either G–E association in the source population or from G×E interaction in disease risk. If the former possibility can be dismissed, G–E association in cases can be interpreted as evidence of G×E interaction; by assuming G–E independence among controls, the case-only test becomes more powerful than the case-control test (118) and is not vulnerable to differential measurement error (19). For some exogenous exposures like air pollution, this assumption of G–E independence is quite plausible, but it is less obvious for behavioral variables like tobacco smoking or hormone-related factors. While tempting to first test G–E independence in controls and then decide whether to conduct a case-only or case-control test, this strategy has inflated type I error rates (1). Nevertheless, some empirical Bayes combinations of case-only and case-control tests have been proposed (68, 79) that take advantage of the power gain offered by case-only approaches while avoiding the bias involved in naïve two-stage tests.
Chen et al. (17) proposed a two-stage design using use a case-only comparison for screening, followed by a family-based comparison that does not require G–E independence. Van Steen et al.’s (114) design—screening associations using between-family comparisons, followed by testing using within-family comparisons—could also be applied to G×E interactions.
Challenge studies and other experimental designs
Although randomized controlled trials are seldom feasible or ethical for studying noxious exposures, chamber studies of trace-concentrations of hazardous exposures provide the advantages of randomization and within-individual cross-over comparisons. By stratifying on genotypes, such studies can explore G×E interactions. For example, Gilliland et al. (39) studied the effects of diesel exhaust particles and allergens on immunologic markers in atopic individuals using a double-blind factorial randomized cross-over design. Subjects with either the GSTM1 null or the I105 GSTP1 genotype had higher IgE levels in response to diesel exhaust particles and allergens, and still higher levels with both risk genotypes.
Clinical trials provide unique opportunities to study G×E interactions because both treatment and genotype are randomly assigned. Possible designs are described in (107): sampling individuals from a clinical trial for genotyping based on their outcomes and/or treatments, sampling individuals from an epidemiologic study based on their genotypes for a randomized intervention trial (preventive or therapeutic), or sampling individuals for biomarker measurements conditional on treatment and genotype.
Mendelian randomization
Where the goal is to test for the effects of a modifiable environmental factor on disease risk, “Mendelian randomization” (26) gets around the difficulties of confounding and reverse causation by testing separately the associations of the intermediate variable and of disease with some gene that influences the intermediate variable. For example, the gene MTHFR governs a key step in folate metabolism; an association of MTHFR with disease would therefore support a causal role for folate. The genotype plays the role of an instrumental variable (44), under the assumption that the gene has no effect on the disease independently of the intermediate phenotype (28).
Exposure assessment
Key to the success of G×E studies is careful assessment of the exposure variables, as in purely environmental epidemiology. Environmental factors can be complex (104), measured on continuous scales, time-dependent, multi-dimensional, spatially correlated, or available only at an aggregate level (e.g., ambient air pollution). Measurements may not be available on individuals, requiring a prediction model based on area measurements, time-activity patterns, dispersion modeling, subsample data, expert opinion, or other information. Uncertainties in exposure assignments — measured or imputed — can be large and lead to unpredictable biases, including inducing spurious interactions (43) and different effects at the individual and ecologic levels (9), even if non-differential. Methods of correction for exposure (110) or genotype (41) measurement error have seldom been applied to interaction analyses. Multistage sampling designs that leverage readily available exposure surrogates (e.g., ecologic-level exposures) to select individuals for more in-depth exposure assessment and/or genotyping may be efficient.
Power and sample size
Much larger sample sizes are needed for detection of interactions than for main effects. As a useful rule of thumb, an interaction requires at least a four-fold larger sample size than a main effect of comparable magnitude (99). Sample size or power for interaction effects can be determined using the Quanto2 software (35). For genome-wide studies, much higher significance levels are required, but not astronomically larger sample sizes (122). For 90% power, for example, the ratio of sample sizes needed for GWAS (α=10−7) and individual SNP studies (α=.05) for any given effect size is only 4.15. Nevertheless, to detect interaction RRs of about 1.5 would still require sample sizes of thousands of cases and controls for a candidate gene study or 10s of thousands for a GWAS. Power for detecting interactions would be further diminished by measurement error in either exposure or genotype (12, 125) and can have unpredictable effects on the direction of an interaction (43), particularly if one or both is differentially misclassified (34). However, power may be improved by enriching the sample for individuals likely to be involved in an interaction, with a positive family history or highly exposed (66).
ANALYSIS APPROACHES
Interactions with single genes
Analyses of interactions of single genetic variants with single binary exposure factors are straight-forward comparisons of the genetic RRs for the exposed and unexposed subjects or equivalently of the exposure RRs in genetically susceptible and non-susceptible subjects. The full 2×2 or 3×2 array of RRs by genotype and environmental exposure should generally be presented rather than just the conditional relative risks for G given E or vice versa (70) because the latter may obscure the existence of crossing interactions. The presence of a significant RR in one subgroup and its absence in another is not necessarily evidence of a significant interaction, as non-significance may simply be due to inadequate sample sizes. Logistic or Cox regression methods allow trichotomous genotype and complex exposure data to be modeled flexibly and adjusted for multiple confounders. Since one is often interested in identifying genes that are involved in a disease, whether through main effects or G×E interactions, a 2 df joint test for both can be more powerful than the traditional approach of first testing for a main effect and then for an interaction conditional on main effects (61).
Because candidate genes could contain many variants, single-SNP methods may not fully answer whether a particular gene is involved. Multiple SNPs within a gene might need to be considered in combination, either because of interactive effects or because they are simply markers for some undiscovered causal variant. Haplotypes may provide a better description of genetic risk than any multi-SNP model and their interactions with exposure variables could be analyzed in much the same way as SNPs. However, unless the hypothesis concerns an interactive effect of multiple variants on the same haplotype, one could simply impute the unmeasured variants that are tagged by the available SNPs in LD with them, using HapMap data and an analysis that takes account of the uncertainty of the imputations (69); these methods are readily extended to interaction effects.
Multiple genes
The same environmental factor could interact with multiple genes, either through a common mechanism or separate ones. A comprehensive model for a disease involving multiple genes and multiple environmental risk factors must therefore also consider G×G interactions (23). In considering many candidate genes, the number of possible interaction effects can grow rapidly: among 10 genes, there are 45 possible two-way interactions and 120 possible three-way interactions, so some thought is warranted before embarking on an exhaustive search. One way might be to limit the scope to sets of genes implicated in the same pathway, using one of the pathway modeling strategies described below.
There are many exploratory tools for analyzing high-dimensional interactions. Cordell (23) provides a good review of some of the more widely used methods in the context of G×G interactions, although most of these could also be applied to G×E. Currently the most popular is Multifactor Dimension Reduction (MDR) (30), which searches across all possible partitions of the cells of the multi-way contingency table for the best possible classifier of disease risk on multiple training sets and tests their predictions on the remaining data. Application to the 4-way table of colorectal cancer risks in relation to smoking, red meat, CYP1A2, and NAT2 (Figure 2) confirms that the 4-way interaction model mentioned earlier yielded best classification in training sets but cross-validation shows that this predictor fares no better than chance, mainly due to the small samples size (12 cases and 2 controls) in the one high-risk category. While MDR and other exploratory techniques have shown great promise in discovering interactions with no marginal effects, traditional stepwise methods, such as the Focused Interaction Testing Framework (77), which builds through a sequence of main effects and interactions of higher order, may be more powerful where interactions generate at least weak main effects (84).
Pathway-driven approaches and systems biology
As an alternative to these purely data-driven approaches to detecting interaction effects, there is growing interest in hypothesis-driven pathway-based approaches (66, 101, 105). For example, Clayton and McKeigue (18) argued “We suggest that epidemiologists should focus instead on use of genetic associations to test hypotheses about causal pathways amenable to intervention.” One approach uses traditional regression modeling tools, supplemented by external information about the set of plausible models or their parameters. A general framework is hierarchical Bayes modeling (21, 121, 124). A typical setup might involve two levels, the first a model for the epidemiologic data in relation to various main effects and interactions, the second a model for the first-level regression coefficients in relation to “prior covariates” that describe characteristics of the variables like which pathways they act in (50). The prior covariates and can be derived from various pathway ontology databases, such as the Kyoto Encyclopedia of Genes and Genomes3, Gene Ontology4, Ingenuity Pathways Analysis5, or Protein Analysis Through Evolutionary Relationships6 or literature mining (54). Rebbeck et al. (90) review various other sources of prior covariate information. Additional levels could be added to allow for SNPs within genes, different variables describing each environmental factor, or to distinguish each type of main effect or interaction, and the second level model could include in information on gene networks in the covariances of the first level coefficients (108). Hierarchical models have the effect of stabilizing the regression coefficients from the first-level model by “borrowing strength” from the estimates of coefficients of other similar variables, and also provides estimates of the overall effects of each pathway. Prior covariates only define potential “exchangeability classes” within which no a priori distinctions can be made. Whether these classes actually differ and, if so, by how much is estimated from the data in the second-level regression. Stochastic Search Variable Selection (38) or Bayesian model averaging (48) can be used to address model uncertainty, incorporating prior covariates in the probability that variables are included in the first-level model (21, 67). Other techniques like Monte Carlo logic regression (58) address model uncertainty by exploring a large space of possible models and reporting marginal distributions of models or specific main effect or interaction terms.
Mechanistic models have also received some attention in the epidemiologic literature, particularly physiologically-based pharmacokinetic (PBPK) models for metabolic pathways and stochastic models of carcinogenesis, such as the multistage (4) and two-stage clonal-expansion (78) models. PBPK models are generally specified in terms of a system of differential equations for the unobserved intermediate metabolite concentrations in one or more compartments (possibly with biomarker measurements) and rate parameters for reaction kinetics and/or transport between compartments that can be genotype-dependent with some inter-individual variability (Figure 2) (6, 37, 85, 116). The entire system can then be fitted using Markov chain Monte Carlo methods (24).
Conti et al. (22) describe the use of hierarchical modeling and ontologies for nicotine addiction. Gilliland et al. (40) outline a theoretical framework for studying the various genes, exposures, and co-factors such as anti-oxidant intake through oxidative stress and inflammatory pathways, which has served as the conceptual basis for candidate gene studies within the Children’s Health Study (11, 52, 94). PBPK models have been used to analyze data on colorectal polyps in relation to meat consumption and smoking through HCA and PAH pathways (21, 24). The WECARE study (5) of second breast cancers following radiotherapy is based on a model for genes involved in DNA damage response pathways for double-strand breaks caused by ionizing radiation. Several candidate gene studies nested within the Colon Cancer Family Registry are motivated by pathways, such as folate metabolism (81, 113). Hierarchical and mechanistic modeling are illustrated on simulated data for the folate pathway in (108).
Incorporation of Biomarkers
There is an extensive literature on the use of biomarkers in molecular epidemiology, including markers of exposure, preclinical disease, susceptibility, or intermediate biological processes (112). Biomarker measurements may allow one to look inside the “black box” to understand the processes that account for G×E and G×G interactions by measuring some of the intermediate metabolites. Because biomarkers can be expensive or impractical on a large scale, particularly before disease onset, some form of stratified sampling conditional on exposure, disease, or genotypes may be desirable, while ensuring valid joint analysis of the main study and biomarker measurement substudy (10, 102).
Genome-wide association studies
The advent of genotyping technologies that can assay up to a million SNPs at a cost of a few hundred dollars per sample has now made the idea of GWAS a reality. Hundreds of studies have been published within the last two years7, along with numerous review articles (2, 59, 75, 106). While the yield of replicated novel main effects of SNPs from GWAS has been remarkable, investigators are only now turning their attention to G×G and G×E interactions in GWASs, or GEnome-Wide Interaction Scans (GEWIS) (55). Recently, there has been growing interest in using pathways to mine the wealth of GWAS associations that failed to achieve genome-wide significance but may in the aggregate implicate novel pathways (14); to date, most such analyses have been restricted to genetic main effects, but this may be due to the limited amount of useful environmental data in either the GWASs or the pathway databases currently available. Methods for addressing G×E and G×G interaction are similar, differing mainly in the magnitude of the search: perhaps about 10 million for the former, but nearly a trillion for the latter! While the same basic study designs are applicable, the sheer scale of GEWIS scans requires efficient ways of identifying effects worth pursuing. Two broad lines of research have been explored, one based on prescreening possible interactions for main effects, the other based on combinations of case-only and case-control comparisons (Box 1).
Marchini et al. (74) were first to suggest the feasibility of scanning the entire genome for all possible pairwise G×G interactions. They showed that, despite the need to attain significance levels of the order of 10−13 to claim genome-wide significance, it could be more powerful for identifying loci than restricting the interaction scan to those with main effects, or between significant main effects and all other SNPs (31). For both G×E and G×G interactions, some form of pre-screening can improve power. For G×E, Murcray et al. (80) proposed a two-step approach by first scanning for G–E association over all markers in the combined case-control sample and then testing only the subset that attain some pre-specified significance level α1 (typically 0.001) in a conventional case-control comparison, correcting only for the number of tests performed at the second step. This combined procedure is more powerful than a conventional case-control scan and is completely robust to G–E association in the source population. Alternatively, one could perform the first stage screen on the basis of marginal effects alone (57). Similar methods have been proposed for quantitative traits in random samples, based on scanning for heterogeneity of variances across genotypes induced by a missing interaction effect (83). The various hybrid case-only/case-control estimators discussed earlier could be used in a GEWIS setting (15) and may be more powerful than the Murcray et al. approach for small interaction RRs.
For testing main effects, two-stage genotyping designs have been proposed (95, 98, 106), in which part of the available sample is scanned using a commercial panel and then some subset of the most significant markers is genotyped using a custom panel on the remainder of the sample, the final test based on a joint analysis of both samples. Such designs could be used for G×E interactions, allocating some proportion of the second stage to SNPs showing significant main effects and some to those involved in significant G×E or G×G interactions. Le Marchand and Wilkens (66) have argued that, rather than limiting a GWAS scan for interactions to those showing significant marginal effects, a scan for G×E interactions across the entire genome should be a major goal. Several approaches have been described for prioritizing main effects, based on weighted False Discovery Rate (91, 120), Bayes factors (117), and Bayesian hierarchical models (16, 67). Extending such approaches to GEWIS requires only the availability of comprehensive ontologies for organizing information on G×E interactions (22, 49) and sheer computational power or clever parallel processing algorithms. Since it is unlikely that any GWAS would be undertaken only for discovering interactions, a multistage design would have to specify the relative priority of SNPs selected on the basis of main effects and interactions. While the expected number of false positive associations with SNPs discovered by main effects or interactions can be readily computed, as can the power for detecting true effects of different sizes, the expected yield of true positive SNPs at different first-stage significance thresholds depends on the true effect sizes, so the optimal balance remains a matter of guesswork. The trade-off depends in part on whether the goal is to identify interactions per se or simply genes that are involved in interaction effects.
FUTURE CHALLENGES AND PUBLIC HEALTH RELEVANCE
We are now entering the “post-GWAS” era, aimed at large meta-analyses to replicate findings of individual studies and discover additional associations or interactions that failed to attain genome-wide significance in any single study, and by the use of additional sequence data to uncover the causal variants responsible for the GWAS associations. Whole exome sequencing methods (29) allow exhaustive testing of all variants in transcribed regions. The latter will pose new study design challenges, particularly for discovering associations with rare variants and G×E interactions. For example, suppose a GWAS has revealed an interaction of an environmental exposure with one or more SNPs at a particular locus. To discover the causal variant(s), one might wish to re-sequence a subsample of the original GWAS and then perform a joint analysis of the main study and re-sequencing subsample (106). Given the high cost of sequencing, this subsample should be selected so as to maximize the expected yield of causal variants by stratified sampling based on disease, associated SNPs, and exposure, while ensuring that all sampling strata are represented for use in the joint analysis.
The choice of the null model for testing interaction has important public health implications. The pattern of relative risks may not depart significantly from a purely multiplicative model, but if both factors have strong marginal effects, those exposed to both are at substantially greater excess risk than predicted by either factor alone. For example, suppose the joint effect of mutations in BRCA1/2 and radiotherapy were approximately multiplicative. Then even if the radiation effect in mutation carriers alone was not statistically significant or the joint effect was not significantly greater than additive, it might be misleading to conclude that radiotherapy was no more dangerous for carriers than for noncarriers, owing to their much higher baseline risk.
G×E interactions have potentially important implications for environmental regulation. As directed by the Clean Air Act, the U.S. Environmental Protection Agency generally aims to set standards that would be protective for the most susceptible individuals, including children, the elderly, those with various chronic diseases, as well as genetically susceptible individuals (64). The practical difficulty is that there can be a broad spectrum of susceptibility (particularly if many genes are involved), susceptible individuals may not be identifiable, or the relevant susceptibility factors may not be known. If the distribution of susceptibility is continuous, there may be no clear upper bound for the risk to be regulated. This raises difficult policy issues about how information about genetic susceptibility should be taken into account in setting standards while balancing equity across the entire population (25, 32). Indeed, Rose (92) has argued that in many circumstances, public health interventions aimed at the whole population may be more effective. See Chapter 15 of (104) for a discussion of the statistical problem of estimating the distribution of heterogeneity in dose-response relations.
The success of GWASs at uncovering novel genetic loci for complex diseases has come with the recognition that the vast majority of the associations discovered with common variants have modest effect sizes, generally with RRs of 1.2–1.5 (2, 46, 47, 75). Even in the aggregate, these variants explain only a small proportion of the heritability of these traits, suggesting that a substantial amount of “dark matter” remains to be discovered. Whether this will turn out to comprise rare variants, structural variants, heritable epigenetic effects, or other unknown mechanisms remains to be seen (75). New technological developments, such as next-gen sequencing, the cataloging of full sequence data in the 1000 Genomes Project8, and proteomic, metabolomic, transcriptomic, and other –omic technologies, may help in these discoveries. However, one potential source of dark matter that has not yet been adequately explored is interactions, both G×E and G×G. The technology for studying them is already available, lacking primarily the much larger sample sizes needed; for G×E interactions, what is needed is large consortia of epidemiologic studies with well-characterized exposure data and databases tying together exposure-genetic-disease data from epidemiology, toxicology, and molecular biology (27).
Despite the importance of studying G×E interactions, it must be admitted that the track record of replication of such findings has generally been poor (8, 51, 89), leading some to question the utility of such studies (19). Some non-replication may, of course, simply reflect true heterogeneity due to differences in the distribution of exposures or confounders (e.g., different co-pollutants or size/chemical composition of air pollutants in different regions) or differences in exposure measurement error or population substructure across studies (42). Hopefully, the new generation of much larger studies, with close attention to rigorous design and exposure measurement and more sophisticated statistical methods will remedy this defect. Several large are already established (56, 126) or being proposed (20, 73, 87); nested case-control studies within these cohorts may provide cost-efficient ways to further refine the exposure information needed for G×E studies. These approaches are likely to be more useful than pure genetic screens using shared controls (72, 119) for which no environmental comparisons will be possible.
Footnotes
References
- 1.Albert PS, Ratnasinghe D, Tangrea J, Wacholder S. Limitations of the case-only design for identifying gene-environment interactions. Am J Epidemiol. 2001;154:687–93. doi: 10.1093/aje/154.8.687. [DOI] [PubMed] [Google Scholar]
- 2.Altshuler D, Daly MJ, Lander ES. Genetic mapping in human disease. Science. 2008;322:881–8. doi: 10.1126/science.1156409. [DOI] [PMC free article] [PubMed] [Google Scholar]
- 3.Andrieu N, Goldstein AM, Thomas DC, Langholz B. Counter-matching in studies of gene-environment interaction: efficiency and feasibility. Am J Epidemiol. 2001;153:265–74. doi: 10.1093/aje/153.3.265. [DOI] [PubMed] [Google Scholar]
- 4.Armitage P, Doll R. The age distribution of cancer and a multistage theory of carcinogenesis. Br J Cancer. 1954;8:1–12. doi: 10.1038/bjc.1954.1. [DOI] [PMC free article] [PubMed] [Google Scholar]
- 5.Bernstein JL, Langholz B, Haile RW, Bernstein L, Thomas DC, et al. Study design: evaluating gene-environment interactions in the etiology of breast cancer - the WECARE study. Breast Cancer Res. 2004;6:R199–214. doi: 10.1186/bcr771. [DOI] [PMC free article] [PubMed] [Google Scholar]
- 6.Best NG, Tan KK, Gilks WR, Spiegelhalter DJ. Estimation of population pharmacokinetics using the Gibbs sampler. J Pharmacokinet Biopharm. 1995;23:407–35. doi: 10.1007/BF02353641. [DOI] [PubMed] [Google Scholar]
- 7.Bodmer W, Bonilla C. Common and rare variants in multifactorial susceptibility to common diseases. Nat Genet. 2008;40:695–701. doi: 10.1038/ng.f.136. [DOI] [PMC free article] [PubMed] [Google Scholar]
- 8.Brennan P. Gene-environment interaction and aetiology of cancer: what does it mean and how can we measure it? Carcinogenesis. 2002;23:381–7. doi: 10.1093/carcin/23.3.381. [DOI] [PubMed] [Google Scholar]
- 9.Brenner H, Savitz DA, Jockel KH, Greenland S. Effects of nondifferential exposure misclassification in ecologic studies. Am J Epidemiol. 1992;135:85–95. doi: 10.1093/oxfordjournals.aje.a116205. [DOI] [PubMed] [Google Scholar]
- 10.Breslow NE, Chatterjee N. Design and analysis of two-phase studies with binary outcome applied to Wilms tumor prognosis. Appl Statist. 1999;48:457–68. [Google Scholar]
- 11.Breton CV, Vora H, Salam MT, Islam T, Wenten M, et al. Variation in the GST mu locus and tobacco smoke exposure as determinants of childhood lung function. Am J Resp Crit Care Med. 2009;179:601–7. doi: 10.1164/rccm.200809-1384OC. [DOI] [PMC free article] [PubMed] [Google Scholar]
- 12.Burton PR, Hansell AL, Fortier I, Manolio TA, Khoury MJ, et al. Size matters: just how big is BIG?: Quantifying realistic sample size requirements for human genome epidemiology. Int J Epidemiol. 2009;38:263–73. doi: 10.1093/ije/dyn147. [DOI] [PMC free article] [PubMed] [Google Scholar]
- 13.Chapman J, Clayton D. Detecting association using epistatic information. Genet Epidemiol. 2007;31:894–909. doi: 10.1002/gepi.20250. [DOI] [PubMed] [Google Scholar]
- 14.Chasman DI. On the utility of gene set methods in genomewide association studies of quantitative traits. Genet Epidemiol. 2008;32:658–68. doi: 10.1002/gepi.20334. [DOI] [PubMed] [Google Scholar]
- 15.Chatterjee N, Wacholder S. Invited commentary: efficient testing of gene-environment interaction. Am J Epidemiol. 2009;169:231–3. doi: 10.1093/aje/kwn352. discussion 4-5. [DOI] [PMC free article] [PubMed] [Google Scholar]
- 16.Chen GK, Witte JS. Enriching the analysis of genomewide association studies with hierarchical modeling. Am J Hum Genet. 2007;81:397–404. doi: 10.1086/519794. [DOI] [PMC free article] [PubMed] [Google Scholar]
- 17.Chen YH, Lin HW, Liu H. Two-stage analysis for gene-environment interaction utilizing both case-only and family-based analysis. Genet Epidemiol. 2008 doi: 10.1002/gepi.20357. [DOI] [PubMed] [Google Scholar]
- 18.Clayton D, McKeigue PM. Epidemiological methods for studying genes and environmental factors in complex diseases. Lancet. 2001;358:1356–60. doi: 10.1016/S0140-6736(01)06418-2. [DOI] [PubMed] [Google Scholar]
- 19.Clayton DG, McKeigue PM. Epidemiological methods for studying genes and environmental factors in complex diseases. Lancet. 2001;358:1357–60. doi: 10.1016/S0140-6736(01)06418-2. [DOI] [PubMed] [Google Scholar]
- 20.Collins FS. The case for a US prospective cohort study of genes and environment. Nature. 2004;429:475–7. doi: 10.1038/nature02628. [DOI] [PubMed] [Google Scholar]
- 21.Conti DV, Cortessis V, Molitor J, Thomas DC. Bayesian modeling of complex metabolic pathways. Hum Hered. 2003;56:83–93. doi: 10.1159/000073736. [DOI] [PubMed] [Google Scholar]
- 22.Conti DV, Lewinger JP, Swan GE, Tyndale RF, Benowitz NL, Thomas PD. Using ontologies in hierarchical modeling of genes and exposures in biologic pathways. In: Swan GE, editor. Phenotypes, Endophenotypes, and Genetic Studies of Nicotine Dependence. Vol. 22. 2009. in press: NCI Monograph. Number of in press pp. [Google Scholar]
- 23.Cordell HJ. Detecting gene-gene interactions that underlie human diseases. Nat Rev Genet. 2009;10:392–404. doi: 10.1038/nrg2579. [DOI] [PMC free article] [PubMed] [Google Scholar]
- 24.Cortessis V, Thomas DC. Toxicokinetic genetics: An approach to gene-environment and gene-gene interactions in complex metabolic pathways. In: Bird P, Boffetta P, Buffler P, Rice J, editors. Mechanistic considerations in the molecular epidemiology of cancer. Vol. 157. Lyon, France: IARC Scientific Publications; 2003. pp. 127–50. Number of 127-50 pp. [PubMed] [Google Scholar]
- 25.Cullen AC, Corrales MA, Kramer CB, Faustman EM. The application of genetic information for regulatory standard setting under the clean air act: a decision-analytic approach. Risk Anal. 2008;28:877–90. doi: 10.1111/j.1539-6924.2008.01084.x. [DOI] [PubMed] [Google Scholar]
- 26.Davey Smith G, Ebrahim S. ‘Mendelian randomization’: can genetic epidemiology contribute to understanding environmental determinants of disease? Int J Epidemiol. 2003;32:1–22. doi: 10.1093/ije/dyg070. [DOI] [PubMed] [Google Scholar]
- 27.De Roos AJ, Smith M, Channock S, Rothman N. Toxicologic considerations in the application and interpretation of susceptibility biomarkers in epidemiologic studies. In: Bird P, Boffetta P, Buffler P, Rice J, editors. Mechanistic Considerations in the Molecular Epidemiology of Cancer. Vol. 157. Lyon: IARC Scientific Publications; 2001. pp. 105–25. Number of 105-25 pp. [PubMed] [Google Scholar]
- 28.Didelez V, Sheehan N. Mendelian randomisation and instrumental variables: what can and what can’t be done. 2006. [Google Scholar]
- 29.Droege M, Hill B. The Genome Sequencer FLX System--longer reads, more applications, straight forward bioinformatics and more complete data sets. J Biotechnol. 2008;136:3–10. doi: 10.1016/j.jbiotec.2008.03.021. [DOI] [PubMed] [Google Scholar]
- 30.Edwards TL, Lewis K, Velez DR, Dudek S, Ritchie MD. Exploring the performance of Multifactor Dimensionality Reduction in large scale SNP studies and in the presence of genetic heterogeneity among epistatic disease models. Hum Hered. 2009;67:183–92. doi: 10.1159/000181157. [DOI] [PMC free article] [PubMed] [Google Scholar]
- 31.Evans DM, Marchini J, Morris AP, Cardon LR. Two-stage two-locus models in genome-wide association. PLoS Genet. 2006;2:e157. doi: 10.1371/journal.pgen.0020157. [DOI] [PMC free article] [PubMed] [Google Scholar]
- 32.Freedman AN, Seminara D, Gail MH, Hartge P, Colditz GA, et al. Cancer risk prediction models: a workshop on development, evaluation, and application. J Natl Cancer Inst. 2005;97:715–23. doi: 10.1093/jnci/dji128. [DOI] [PubMed] [Google Scholar]
- 33.Garcia-Closas M, Malats N, Silverman D, Dosemeci M, Kogevinas M, et al. NAT2 slow acetylation, GSTM1 null genotype, and risk of bladder cancer: results from the Spanish Bladder Cancer Study and meta-analyses. Lancet. 2005;366:649–59. doi: 10.1016/S0140-6736(05)67137-1. [DOI] [PMC free article] [PubMed] [Google Scholar]
- 34.Garcia-Closas M, Thompson WD, Robins JM. Differential misclassification and the assessment of gene-environment interactions in case-control studies. Am J Epidemiol. 1998;147:426–33. doi: 10.1093/oxfordjournals.aje.a009467. [DOI] [PubMed] [Google Scholar]
- 35.Gauderman WJ. Sample size requirements for matched case-control studies of gene-environment interaction. Stat Med. 2002;21:35–50. doi: 10.1002/sim.973. [DOI] [PubMed] [Google Scholar]
- 36.Gauderman WJ, Witte JS, Thomas DC. Family-based association studies. J Natl Cancer Inst Monogr. 1999:31–7. doi: 10.1093/oxfordjournals.jncimonographs.a024223. [DOI] [PubMed] [Google Scholar]
- 37.Gelman A, Bois F, Jiang J. Physiological pharmacokinetic analysis using population modeling and informative prior distributions. J Am Statist Assoc. 1996;91:1400–12. [Google Scholar]
- 38.George EI, McCulloch RE. Variable selection via Gibbs sampling. J Am Stat Assoc. 1993;88:881–9. [Google Scholar]
- 39.Gilliland FD, Li YF, Saxon A, Diaz-Sanchez D. Effect of glutathione-S-transferase M1 and P1 genotypes on xenobiotic enhancement of allergic responses: randomised, placebo-controlled crossover study. Lancet. 2004;363:119–25. doi: 10.1016/S0140-6736(03)15262-2. [DOI] [PubMed] [Google Scholar]
- 40.Gilliland FD, McConnell R, Peters J, Gong H., Jr A theoretical basis for investigating ambient air pollution and children’s respiratory health. Environ Health Persp. 1999;107:403–7. doi: 10.1289/ehp.99107s3403. [DOI] [PMC free article] [PubMed] [Google Scholar]
- 41.Gordon D, Yang Y, Haynes C, Finch SJ, Mendell NR, et al. Increasing power for tests of genetic association in the presence of phenotype and/or genotype error by use of double-sampling. Stat Appl Genet and Mol Biol. 2004;3:Article 26. doi: 10.2202/1544-6115.1085. [DOI] [PubMed] [Google Scholar]
- 42.Greene CS, Penrod NM, Williams SM, Moore JH. Failure to replicate a genetic association may provide important clues about genetic architecture. PLoS One. 2009;4:e5639. doi: 10.1371/journal.pone.0005639. [DOI] [PMC free article] [PubMed] [Google Scholar]
- 43.Greenland S. The effect of misclassification in the presence of covariates. Am J Epidemiol. 1980;112:564–9. doi: 10.1093/oxfordjournals.aje.a113025. [DOI] [PubMed] [Google Scholar]
- 44.Greenland S. An introduction to instrumental variables for epidemiologists. Int J Epidemiol. 2000;29:1102. doi: 10.1093/oxfordjournals.ije.a019909. [DOI] [PubMed] [Google Scholar]
- 45.Haldane JBS. Heredity and Politics. New York: W.W Norton; 1938. [Google Scholar]
- 46.Hardy J, Singleton A. Genomewide Association Studies and Human Disease. N Engl J Med. 2009 doi: 10.1056/NEJMra0808700. [DOI] [PMC free article] [PubMed] [Google Scholar]
- 47.Hindorff LA, Sethupathy P, Junkins HA, Ramos EM, Mehta JP, et al. Potential etiologic and functional implications of genome-wide association loci for human diseases and traits. Proc Natl Acad Sci. 2009;106:9362–7. doi: 10.1073/pnas.0903103106. [DOI] [PMC free article] [PubMed] [Google Scholar]
- 48.Hoeting JA, Madigan D, Raftery AE, Volinsky CT. Bayesian model averaging: a tutorial. Statist Sci. 1999;14:382–417. [Google Scholar]
- 49.Holmans P, Green EK, Pahwa JS, Ferreira MA, Purcell SM, et al. Gene Ontology Analysis of GWA Study Data Sets Provides Insights into the Biology of Bipolar Disorder. Am J Hum Genet. 2009 doi: 10.1016/j.ajhg.2009.05.011. [DOI] [PMC free article] [PubMed] [Google Scholar]
- 50.Hung RJ, Brennan P, Malaveille C, Porru S, Donato F, et al. Using hierarchical modeling in genetic association studies with multiple markers: application to a case-control study of bladder cancer. Cancer Epidemiol Biomarkers Prev. 2004;13:1013–21. [PubMed] [Google Scholar]
- 51.Hunter DJ. Gene-environment interactions in human diseases. Nat Rev Genet. 2005;6:287–98. doi: 10.1038/nrg1578. [DOI] [PubMed] [Google Scholar]
- 52.Islam T, Berhane K, McConnell R, Gauderman WJ, Avol E, et al. Glutathione-Stransferase (GST) P1, GSTM1, exercise, ozone and asthma incidence in school children. Thorax. 2009;64:197–202. doi: 10.1136/thx.2008.099366. [DOI] [PMC free article] [PubMed] [Google Scholar]
- 53.Iyengar SK, Elston RC. The genetic basis of complex traits: rare variants or “common gene, common disease”? Methods Mol Biol. 2007;376:71–84. doi: 10.1007/978-1-59745-389-9_6. [DOI] [PubMed] [Google Scholar]
- 54.Jensen LJ, Saric J, Bork P. Literature mining for the biologist: from information retrieval to biological discovery. Nat Rev Genet. 2006;7:119–29. doi: 10.1038/nrg1768. [DOI] [PubMed] [Google Scholar]
- 55.Khoury MJ, Wacholder S. Invited commentary: from genome-wide association studies to gene-environment-wide interaction studies--challenges and opportunities. Am J Epidemiol. 2009;169:227–30. doi: 10.1093/aje/kwn351. discussion 34-5. [DOI] [PMC free article] [PubMed] [Google Scholar]
- 56.Kimmel CA, Collman GW, Fields N, Eskenazi B. Lessons learned for the National Children’s Study from the National Institute of Environmental Health Sciences/U.S. Environmental Protection Agency Centers for Children’s Environmental Health and Disease Prevention Research. Environ Health Persp. 2005;113:1414–8. doi: 10.1289/ehp.7669. [DOI] [PMC free article] [PubMed] [Google Scholar]
- 57.Kooperberg C, Leblanc M. Increasing the power of identifying gene x gene interactions in genome-wide association studies. Genet Epidemiol. 2008;32:255–63. doi: 10.1002/gepi.20300. [DOI] [PMC free article] [PubMed] [Google Scholar]
- 58.Kooperberg C, Ruczinski I. Identifying interacting SNPs using Monte Carlo logic regression. Genet Epidemiol. 2005;28:157–70. doi: 10.1002/gepi.20042. [DOI] [PubMed] [Google Scholar]
- 59.Kraft P, Cox DG. Study designs for genome-wide association studies. Adv Genet. 2008;60:465–504. doi: 10.1016/S0065-2660(07)00417-8. [DOI] [PubMed] [Google Scholar]
- 60.Kraft P, Hunter D. Integrating epidemiology and genetic association: the challenge of gene-environment interaction. Philos Trans R Soc Lond B Biol Sci. 2005;360:1609–16. doi: 10.1098/rstb.2005.1692. [DOI] [PMC free article] [PubMed] [Google Scholar]
- 61.Kraft P, Yen YC, Stram DO, Morrison J, Gauderman WJ. Exploiting gene-environment interaction to detect genetic associations. Hum Hered. 2007;63:111–9. doi: 10.1159/000099183. [DOI] [PubMed] [Google Scholar]
- 62.Kryukov GV, Pennacchio LA, Sunyaev SR. Most rare missense alleles are deleterious in humans: Implications for complex disease and association studies. Am J Hum Genet. 2007;80:727–39. doi: 10.1086/513473. [DOI] [PMC free article] [PubMed] [Google Scholar]
- 63.Langholz B, Goldstein L. Risk set sampling in epidemiologic cohort studies. Statist Sci. 1996;11:35–53. [Google Scholar]
- 64.Lave LB, Omenn GS. Clearing the air: reforming the Clean Air Act [Monograph] 1981. Medium X; Size: Pages: 59 pp. [Google Scholar]
- 65.Le Marchand L, Hankin JH, Wilkens LR, Pierce LM, Franke A, et al. Combined effects of well-done red meat, smoking, and rapid N-acetyltransferase 2 and CYP1A2 phenotypes in increasing colorectal cancer risk. Cancer Epidemiol Biomarkers Prev. 2001;10:1259–66. [PubMed] [Google Scholar]
- 66.Le Marchand L, Wilkens LR. Design considerations for genomic association studies: importance of gene-environment interactions. Cancer Epidemiol Biomarkers Prev. 2008;17:263–7. doi: 10.1158/1055-9965.EPI-07-0402. [DOI] [PubMed] [Google Scholar]
- 67.Lewinger JP, Conti DV, Baurley JW, Triche TJ, Thomas DC. Hierarchical Bayes prioritization of marker associations from a genome-wide association scan for further investigation. Genet Epidemiol. 2007;31:871–82. doi: 10.1002/gepi.20248. [DOI] [PubMed] [Google Scholar]
- 68.Li D, Conti DV. Bayesian combination of the case-only and case-control analysis: A powerful and robust test for gene-environment interaction (abstract) Genet Epidemiol. 2006;13:453. [Google Scholar]
- 69.Lin DY, Hu Y, Huang BE. Simple and efficient analysis of disease association with missing genotype data. Am J Hum Genet. 2008;82:444–52. doi: 10.1016/j.ajhg.2007.11.004. [DOI] [PMC free article] [PubMed] [Google Scholar]
- 70.Little J, Bradley L, Bray MS, Clyne M, Dorman J, et al. Reporting, appraising, and integrating data on genotype prevalence and gene-disease associations. Am J Epidemiol. 2002;156:300–10. doi: 10.1093/oxfordjournals.aje.a000179. [DOI] [PubMed] [Google Scholar]
- 71.Lubin JH, Kogevinas M, Silverman D, Malats N, Garcia-Closas M, et al. Evidence for an intensity-dependent interaction of NAT2 acetylation genotype and cigarette smoking in the Spanish Bladder Cancer Study. Int J Epidemiol. 2007;36:236–41. doi: 10.1093/ije/dym043. [DOI] [PubMed] [Google Scholar]
- 72.Luca D, Ringquist S, Klei L, Lee AB, Gieger C, et al. On the use of general control samples for genome-wide association studies: genetic matching highlights causal variants. Am J Hum Genet. 2008;82:453–63. doi: 10.1016/j.ajhg.2007.11.003. [DOI] [PMC free article] [PubMed] [Google Scholar]
- 73.Manolio TA, Bailey-Wilson JE, Collins FS. Genes, environment and the value of prospective cohort studies. Nat Rev Genet. 2006;7:812–20. doi: 10.1038/nrg1919. [DOI] [PubMed] [Google Scholar]
- 74.Marchini J, Donnelly P, Cardon LR. Genome-wide strategies for detecting multiple loci that influence complex diseases. Nat Genet. 2005;37:413–7. doi: 10.1038/ng1537. [DOI] [PubMed] [Google Scholar]
- 75.McCarthy MI, Abecasis GR, Cardon LR, Goldstein DB, Little J, et al. Genome-wide association studies for complex traits: consensus, uncertainty and challenges. Nat Rev Genet. 2008;9:356–69. doi: 10.1038/nrg2344. [DOI] [PubMed] [Google Scholar]
- 76.Miller RL, Ho SM. Environmental epigenetics and asthma: current concepts and call for studies. Am J Resp Crit Care Med. 2008;177:567–73. doi: 10.1164/rccm.200710-1511PP. [DOI] [PMC free article] [PubMed] [Google Scholar]
- 77.Millstein J, Conti DV, Gilliland FD, Gauderman WJ. A testing framework for identifying susceptibility genes in the presence of epistasis. Am J Hum Genet. 2006;78:15–27. doi: 10.1086/498850. [DOI] [PMC free article] [PubMed] [Google Scholar]
- 78.Moolgavkar S, Knudson A. Mutation and cancer: a model for human carcinogenesis. J Natl Cancer Inst. 1981;66:1037–52. doi: 10.1093/jnci/66.6.1037. [DOI] [PubMed] [Google Scholar]
- 79.Mukherjee B, Ahn J, Gruber SB, Rennert G, Moreno V, Chatterjee N. Tests for gene-environment interaction from case-control data: a novel study of type I error, power and designs. Genet Epidemiol. 2008;32:615–26. doi: 10.1002/gepi.20337. [DOI] [PubMed] [Google Scholar]
- 80.Murcray CE, Lewinger JP, Gauderman WJ. Gene-environment interaction in genome-wide association studies. Am J Epidemiol. 2009;169:219–26. doi: 10.1093/aje/kwn353. [DOI] [PMC free article] [PubMed] [Google Scholar]
- 81.Nijhout HF, Reed MC, Ulrich CM. Mathematical models of folate-mediated one-carbon metabolism. Vitam Horm. 2008;79:45–82. doi: 10.1016/S0083-6729(08)00402-0. [DOI] [PubMed] [Google Scholar]
- 82.Ottman R. An epidemiologic approach to gene-environment interaction. Genet Epidemiol. 1990;7:177–85. doi: 10.1002/gepi.1370070302. [DOI] [PMC free article] [PubMed] [Google Scholar]
- 83.Pare G, Cook NR, Ridker PM, Chasman DI. Finding that elusive gene-environment or gene-gene interaction: prioritizing SNPs for quantitative trait interaction testing. Genet Epidemiol. 2009 under review. [Google Scholar]
- 84.Park MY, Hastie T. Penalized logistic regression for detecting gene interactions. Biostatistics. 2008;9:30–50. doi: 10.1093/biostatistics/kxm010. [DOI] [PubMed] [Google Scholar]
- 85.Parl F, Crooke P, Conti DV, Thomas DC. Pathway-based methods in molecular cancer epidemiology. In: Rebbeck TR, Ambrosone CB, Shields PG, editors. Fundamentals of Molecular Epidemiology. New York: Informa Healthcare; 2008. pp. 189–204. Number of 189-204 pp. [Google Scholar]
- 86.Piegorsch W, Weinberg C, Taylor J. Non-hierarchical logistic models and case-only designs for assessing susceptibility in population-based case-control studies. Stat Med. 1994;13:153–62. doi: 10.1002/sim.4780130206. [DOI] [PubMed] [Google Scholar]
- 87.Potter JD. Toward the last cohort. Cancer Epidemiol Biomarkers Prev. 2004;13:895–7. [PubMed] [Google Scholar]
- 88.Pritchard JK. Are rare variants responsible for susceptibility to complex diseases? Am J Hum Genet. 2001;69:124–37. doi: 10.1086/321272. [DOI] [PMC free article] [PubMed] [Google Scholar]
- 89.Rebbeck TR, Martinez ME, Sellers TA, Shields PG, Wild CP, Potter JD. Genetic variation and cancer: Improving the environment for publication of association studies. Cancer Epidemiol Biomarkers Prev. 2004;13:1985–6. [PubMed] [Google Scholar]
- 90.Rebbeck TR, Spitz M, Wu X. Assessing the function of genetic variants in candidate gene association studies. Nat Rev Genet. 2004;5:589–97. doi: 10.1038/nrg1403. [DOI] [PubMed] [Google Scholar]
- 91.Roeder K, Devlin B, Wasserman L. Improving power in genome-wide association studies: weights tip the scale. Genet Epidemiol. 2007;31:741–7. doi: 10.1002/gepi.20237. [DOI] [PubMed] [Google Scholar]
- 92.Rose G. The strategy of preventive medicine. Oxford: Oxford University Press; 1992. [Google Scholar]
- 93.Rothman KJ, Greenland S, Lash TL. Modern Epidemiology. 3. Philadelphia: Lippincott-Williams-Wilkins; 2008. [Google Scholar]
- 94.Salam MT, Islam T, Gauderman WJ, Gilliland FD. Roles of arginase variants, atopy, and ozone in childhood asthma. J Allergy Clin Immunol. 2009;123:596–602. e1–8. doi: 10.1016/j.jaci.2008.12.020. [DOI] [PMC free article] [PubMed] [Google Scholar]
- 95.Satagopan JM, Elston RC. Optimal two-stage genotyping in population-based association studies. Genet Epidemiol. 2003;25:149–57. doi: 10.1002/gepi.10260. [DOI] [PMC free article] [PubMed] [Google Scholar]
- 96.Schaid D. Case-parents design for gene-environment interaction. Genet Epidemiol. 1999;16:261–73. doi: 10.1002/(SICI)1098-2272(1999)16:3<261::AID-GEPI3>3.0.CO;2-M. [DOI] [PubMed] [Google Scholar]
- 97.Siemiatycki J, Thomas DC. Biological models and statistical interactions: an example from multistage carcinogenesis. Int J Epidemiol. 1981;10:383–7. doi: 10.1093/ije/10.4.383. [DOI] [PubMed] [Google Scholar]
- 98.Skol AD, Scott LJ, Abecasis GR, Boehnke M. Optimal designs for two-stage genome-wide association studies. Genet Epidemiol. 2007;31:776–88. doi: 10.1002/gepi.20240. [DOI] [PubMed] [Google Scholar]
- 99.Smith PG, Day NE. The design of case-control studies: the influence of confounding and interaction effects. Int J Epidemiol. 1984;13:356–65. doi: 10.1093/ije/13.3.356. [DOI] [PubMed] [Google Scholar]
- 100.Spielman RS, McGinnis RE, Ewens WJ. Transmission test for linkage disequilibrium: The insulin gene region and insulin-dependent diabetes mellitus (IDDM) Am J Hum Genet. 1993;52:506–16. [PMC free article] [PubMed] [Google Scholar]
- 101.Thomas DC. The need for a systematic approach to complex pathways in molecular epidemiology. Cancer Epidemiol Biomarkers Prev. 2005;14:557–9. doi: 10.1158/1055-9965.EPI-14-3-EDB. [DOI] [PubMed] [Google Scholar]
- 102.Thomas DC. Multistage sampling for latent variable models. Lifetime Data Anal. 2007;13:565–81. doi: 10.1007/s10985-007-9061-1. [DOI] [PubMed] [Google Scholar]
- 103.Thomas DC. Using gene-environment interactions to dissect the effects of complex mixtures. J Expo Sci Environ Epidemiol. 2007;17(Suppl 2):S71–4. doi: 10.1038/sj.jes.7500630. [DOI] [PubMed] [Google Scholar]
- 104.Thomas DC. Statistical Methods in Environmental Epidemiology. Oxford: Oxford University Press; 2009. [Google Scholar]
- 105.Thomas DC, Baurley JW, Brown EE, Figueiredo J, Goldstein A, et al. Approaches to complex pathways in molecular epidemiology: summary of an AACR special conference. Cancer Res. 2008;68:10028–30. doi: 10.1158/0008-5472.CAN-08-1690. [DOI] [PubMed] [Google Scholar]
- 106.Thomas DC, Casey G, Conti DV, Haile RW, Lewinger JP, Stram DO. Methodological issues in multistage genome-wide association studies. Statist Sci. 2009 doi: 10.1214/09-sts288. in press. [DOI] [PMC free article] [PubMed] [Google Scholar]
- 107.Thomas DC, Conti DV. Two stage genetic association studies. In. In: Elston RC, editor. Encycolpedia of Clinical Trials. New York: Wiley; 2007. Number of. [Google Scholar]
- 108.Thomas DC, Conti DV, Baurley J, Nijhout F, Reed M, Ulrich CM. Use of pathway information in molecular epidemiology. Hum Genomics. 2009 doi: 10.1186/1479-7364-4-1-21. in press. [DOI] [PMC free article] [PubMed] [Google Scholar]
- 109.Thomas DC, Greenland S. The efficiency of matching in case-control studies of risk-factor interactions. J Chron Dis. 1985;38:569–74. doi: 10.1016/0021-9681(85)90045-1. [DOI] [PubMed] [Google Scholar]
- 110.Thomas DC, Stram D, Dwyer J. Exposure measurement error: Influence on exposure-disease relationships and methods of correction. Annu Rev Publ Health. 1993;14:69–93. doi: 10.1146/annurev.pu.14.050193.000441. [DOI] [PubMed] [Google Scholar]
- 111.Thomas DC, Witte JS, Greenland S. Dissecting effects of complex mixtures: who’s afraid of informative priors? Epidemiology. 2007;18:186–90. doi: 10.1097/01.ede.0000254682.47697.70. [DOI] [PubMed] [Google Scholar]
- 112.Tonolio P, Boffetta P, Shuker DEK, Rothman N, Hulka B, Pearce N. Application of biomarkers in cancer epidemiology. Lyon: IARC Scientific Publications; 1997. [Google Scholar]
- 113.Ulrich CM, Neuhouser M, Liu AY, Boynton A, Gregory JF, 3rd, et al. Mathematical modeling of folate metabolism: predicted effects of genetic polymorphisms on mechanisms and biomarkers relevant to carcinogenesis. Cancer Epidemiol Biomarkers Prev. 2008;17:1822–31. doi: 10.1158/1055-9965.EPI-07-2937. [DOI] [PMC free article] [PubMed] [Google Scholar]
- 114.Van Steen K, McQueen MB, Herbert A, Raby B, Lyon H, et al. Genomic screening and replication using the same data set in family-based association testing. Nat Genet. 2005;37:683–91. doi: 10.1038/ng1582. [DOI] [PubMed] [Google Scholar]
- 115.Vineis P, Marinelli D, Autrup H, Brockmoller J, Cascorbi I, et al. Current smoking, occupation, N-acetyltransferase-2 and bladder cancer: a pooled analysis of genotype-based studies. Cancer Epidemiol Biomarkers Prev. 2001;10:1249–52. [PubMed] [Google Scholar]
- 116.Wakefield J. The Bayesian analysis of population pharmacokinetic models. J Am Stat Assoc. 1996;91:62–75. [Google Scholar]
- 117.Wakefield J. Bayes factors for genome-wide association studies: comparison with P-values. Genet Epidemiol. 2008;33:79–86. doi: 10.1002/gepi.20359. [DOI] [PubMed] [Google Scholar]
- 118.Weinberg CR, Umbach DM. Choosing a retrospective design to assess joint genetic and environmental contributions to risk. Am J Epidemiol. 2000;152:197–203. doi: 10.1093/aje/152.3.197. [DOI] [PubMed] [Google Scholar]
- 119.Welcome_Trust_Case_Control_Consortium. Genome-wide association study of 14,000 cases of seven common diseases and 3,000 shared controls. Nature. 2007;447:661–78. doi: 10.1038/nature05911. [DOI] [PMC free article] [PubMed] [Google Scholar]
- 120.Whittemore AS. A Bayesian false discovery rate for multiple testing. J Appl Statist. 2007;34:1–9. [Google Scholar]
- 121.Witte JS. Genetic analysis with hierarchical models. Genet Epidemiol. 1997;14:1137–42. doi: 10.1002/(SICI)1098-2272(1997)14:6<1137::AID-GEPI96>3.0.CO;2-H. [DOI] [PubMed] [Google Scholar]
- 122.Witte JS, Elston RC, Cardon LR. On the relative sample size required for multiple comparisons. Stat Med. 2000;19:369–72. doi: 10.1002/(sici)1097-0258(20000215)19:3<369::aid-sim335>3.0.co;2-n. [DOI] [PubMed] [Google Scholar]
- 123.Witte JS, Gauderman WJ, Thomas DC. Asymptotic bias and efficiency in casecontrol studies of candidate genes and gene-environment interactions: Basic family designs. Am J Epidemiol. 1999;148:693–705. doi: 10.1093/oxfordjournals.aje.a009877. [DOI] [PubMed] [Google Scholar]
- 124.Witte JS, Greenland S, Kim L-L. Software for hierarchical modeling of epidemiologic data. Epidemiology. 1998;9:563–6. [PubMed] [Google Scholar]
- 125.Wong M, Day N, Luan J, Chan K, Wareham N. The detection of gene-environment interaction for continuous traits: should we deal with measurement error by bigger studies or better measurement? Int J Epidemiol. 2003;32:51–7. doi: 10.1093/ije/dyg002. [DOI] [PubMed] [Google Scholar]
- 126.Wright AF, Carothers AD, Campbell H. Gene-environment interactions--the BioBank UK study. Pharmacogenomics J. 2002;2:75–82. doi: 10.1038/sj.tpj.6500085. [DOI] [PubMed] [Google Scholar]
- 127.Yang Q, Khoury MJ. Evolving methods in genetic epidemiology. III. Gene-environment interaction in epidemiologic research. Epidemiol Rev. 1997;19:33–43. doi: 10.1093/oxfordjournals.epirev.a017944. [DOI] [PubMed] [Google Scholar]