Abstract
Gold microplates were synthesized in aqueous solutions by reducing HAuCl4 with the hydroxyl groups in both serine and threonine of bovine serum albumin (BSA), which is a globular protein in its native state. In this article, we systematically investigated the effects of temperature, pH value, the concentration of BSA, and ionic species on the reduction kinetics and thus the size and morphology of the final product. The optimal experimental conditions for producing uniform Au microplates include the following: an elevated temperature in the range of 55–65 °C, an acidic solution with pH ≈ 3, and in the presence of NaCl (0.14 M). We found that if any one of these parameters was deviated from the optimal condition, Au microplates would not be formed in high yields. We also found that the surfaces of the as-synthesized Au microplates were covered by a dense array of BSA bumps.
Keywords: gold, microplates, nanostructures, proteins, bovine, serum albumin
Introduction
Anisotropic 2-D structures have recently gained interests because of their unique optical properties and potential use in chemical and biological sensing. Triangular and hexagonal plates are of interest because they have particularly attractive optical properties. They exhibit both dipole and quadrupole plasmon resonance peaks due to the anisotropic shape. It has been demonstrated that as Au nanoplates grow larger into microplates, their dipole resonance shifts into the near-infrared region while their quadrupole resonance peak becomes more prominent.[1,2] The optical resonance features in the near-infrared region are useful for biomedical applications because soft tissues are only transparent in this range. Moreover, the sharp corners and edges of the plates also make them potentially useful as substrates for surface-enhanced Raman scattering (SERS).[3]
Researchers have long studied the synthesis of plates and their mechanism of formation using electron microscopy and theoretical modeling.[4–7] The major conclusions reached thus far are the following: plates are derived from seeds with planar defects (e.g., lamellar twins or stacking faults). These planar defects can be obtained from a kinetically controlled synthesis, in which the reduction of a salt precursor is relatively slow and the atoms will rearrange in a random hexagonal close-packed (rhcp) structure, that is, a random mixture of both hexagonal close-packed (hcp) and cubic close-packed (ccp) stacking. Nucleus with an rhcp structure can easily evolve into a plate-like seed which is characterized by vertical stacking faults. Nanoplates have been synthesized in various ways through thermal and photochemical methods.[8,9] Recently, there has been a number of green chemistry methods developed to generate Au plates (with both micro- and nanoscale dimensions) using biological macromolecules.
Biological systems assemble inorganic nanoscale building blocks into larger structures with controlled size and complex patterning, such as bones and shells. Researchers have long tried to understand this process, and more recently, to harness it to grow nanostructures with controllable morphologies. For gold, previous syntheses have employed extracts from lemongrass,[10] brown seaweed,[11] unicellular green alga[12] and filamentous fungus[13] to grow nanoplates. Because these extracts are inherently mixtures of proteins, it is difficult to identify the particular protein structure responsible for guiding the growth of nanoplates.
Serum albumin is the most abundant plasma protein in mammals and is essential for the regulation of the colloidal osmotic pressure and maintenance of pH levels in blood.[14] It is the principal transporter for a variety of substances with different properties (e.g., hydrophobic or hydrophilic, and anionic or cationic). Bovine serum albumin (BSA) is one of the most thoroughly characterized, inexpensive, and ubiquitous proteins. BSA has a molecular weight of ~66 kDa and is composed of 582 amino acids, of those, 35 are threonine and 32 are serine units.[15–18] These amino acids bearing hydroxyl group can serve as a mild reducing agent. This is similar to the case of poly(vinyl pyrrolidone) (PVP) containing hydroxyl end groups, which has been shown to be a mild reducing agent capable of producing nanoplates of noble metals such as Au, Ag, Pt, and Pd.[19]
Previously, BSA has been shown to be a good stabilizer for the synthesis of Au-Ag and Ag-Pt alloy nanoparticles owing to their excellent foaming behavior and an ability to simultaneously bind to Ag+ and AuCl4− (or PtCl6−) ions, respectively, due to its zwitterionic characteristic at the isoelectric point (BSA pI = 4.7).[20,21] We found that BSA can serve as not only a stabilizing agent against the aggregation of Au nanoparticles but also a reducing agent due to the hydroxyl groups, so no additional reductant is required. In this study, we synthesized Au microplates by using BSA as both the reducing and stabilizing agent in an aqueous buffered solution. We systematically investigated the effects of temperature, pH value, the concentration of BSA, and ionic strength on the morphology of the final product. Using this simple and environmentally benign approach, we have been able to produce Au microplates in a high yield under the optimum conditions. We also investigated the surface of the as-synthesized Au microplates and found that they were covered by a dense array of BSA bumps.
Results and Discussion
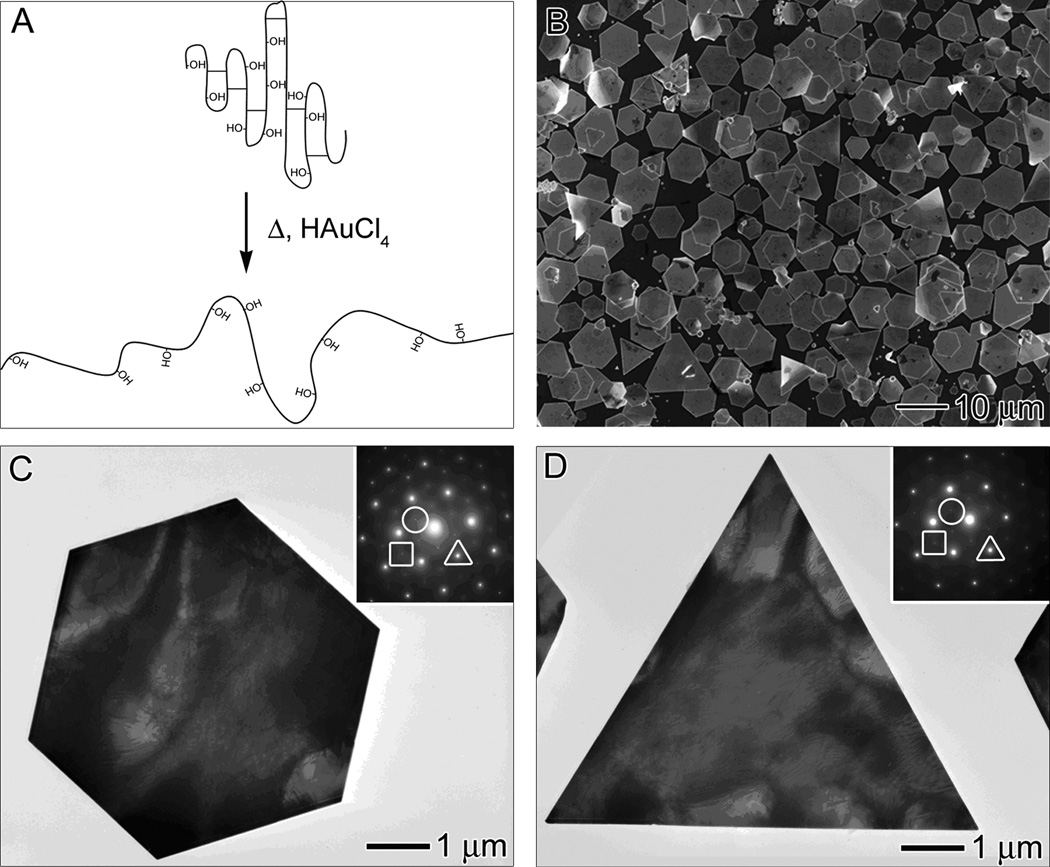
In its native state, BSA is a heart-shaped protein and consisted of three homologous domains (I, II, and III), each bearing a number of ionizable groups.[22,23] The secondary structure of BSA consists of 67% helix, 10% turn, and 23% extended chain.[24] The cysteine units are responsible for the tertiary structure of the protein. They form a total of 17 disulfide bonds, which results in nine loops. It is worth pointing out that BSA has one free sulfhydryl group located at the cysteine residue in position 34 of the amino acid sequence (Cys-34). Cys-34 is located in a crevice near the surface of the protein and is thereby protected by neighboring residues. Figure 1A shows an illustration of a portion of BSA. When the protein is exposed to heat and HAuCl4, the structure of BSA can unfold to reveal the reductive hydroxyl group on threonine and serine units. Customarily, disulfide bonds in a protein are reduced with mercaptans such as thioglycolic acid, 2-mercaptoethanol, or cysteine.[25] However, in the presence of a gold surface, the disulfide bond will break spontaneously to form two Au-thiolate bonds. It has been previously observed that HAuCl4 can from a Au-chloride-sulfur complex in the presence of a thiol.[26] Recently, it was reported the cys-34 residue of BSA and thiomalate (Stm) can react to form albumin-S-Au-Stm.[27] Hence, it is possible that such an intermediate complex could be formed during the reaction, which will facilitate the breaking of the disulfide bonds in BSA and further promote the unfolding of the protein and expose more hydroxyl groups. It is worth emphasizing that both hydroxyl and sulfhydryl groups are instrumental to the synthesis of Au microplates: the hydroxyl group serves as a reducing agent while the sulfhydryl group can provide an additional reactive site for attaching the BSA molecule to the Au surface and thus stabilizing the final product.
Figure 1.
(A) Illustration of a portion of BSA undergoing structural changes when exposed to heat and/or HAuCl4. The protein unfolds and the disulfide bonds break, thereby exposing the reductive hydroxyl groups in threonine and serine. (B) SEM and (C, D) TEM images of hexagonal and triangular plates synthesized using the standard procedure, with the addition of 3 mL of 18.8 mM HAuCl4 into a 5 mL TBS solution (pH = 7.4) containing 0.050 g BSA at 55 °C for 2 h. The insets in (C) and (D) show the corresponding ED pattern taken by directing the electron beam perpendicular to the flat faces of each plate. The spots triangled, circled, and squared can be indexed to the {220}, 1/3{422}, and 2/3{422} reflections, respectively.
Figure 1B shows scanning electron microscopy (SEM) images of the microplates obtained at the experimentally determined optimal conditions. In this case, 0.050 g of BSA was dissolved in 5 mL of tris-buffered saline (TBS, pH = 7.4) and heated at 55 °C for 30 min before the addition of 3 mL of 18.8 mM HAuCl4 in TBS. Throughout this paper, this protocol will be referred to as the standard procedure or method. The initial BSA solution was clear and colorless. Upon the addition of HAuCl4, the solution became cloudy and yellow (Figure S1 in the Supporting Information). This yellow color was due to the presence of Au3+ ions and the turbidity was caused by the denaturation of BSA. Within 10 min, the yellow color disappeared, leaving behind a white opaque solution. The loss of the yellow color indicated the reduction of Au3+ to Au1+. The cloudy solution then developed a light reddish-brown color, indicating the formation of Au nanoparticles. As the reaction continued, the Au nanoparticles grew to form micrometer-sized plates and the solution evolved to a clear, shimmery yellow state within 2 h. The absorbance spectrum of the Au microplates displayed a broad band in the visible and near-infrared regions (Figure S2 in the Supporting Information). The pH of the solution was measured after the addition of HAuCl4 and was found to have dropped from 7.4 to 2.0 during the synthesis. The majority of the product was hexagonal and triangular plates with mean edge lengths of 3.6 ± 0.6 µm and 8.6 ± 2.0 µm, respectively. Figure 1, C and D, shows TEM images of single hexagonal and triangular plates, respectively. The insets show their corresponding electron diffraction (ED) patterns that were taken by directing the electron beam perpendicular to the flat faces. Three sets of patterns can be resolved. The triangled, circled, and squared spots can be indexed to the {220}, 1/3{422}, and 2/3{422} reflections, respectively. Such diffraction patterns are consistent with previously observed patterns for Au and Ag nanoplates.[2,5,28] The observation of the forbidden 1/3{422} reflection indicates the presence of stacking faults in the {111} plane perpendicular to the electron beam. This planar defect disrupts the fcc symmetry of gold and is responsible for the formation of an anisotropic, plate-like structure. It should be noted out that planar defects can be produced by the slow reduction derived from the mild reducing power of BSA.
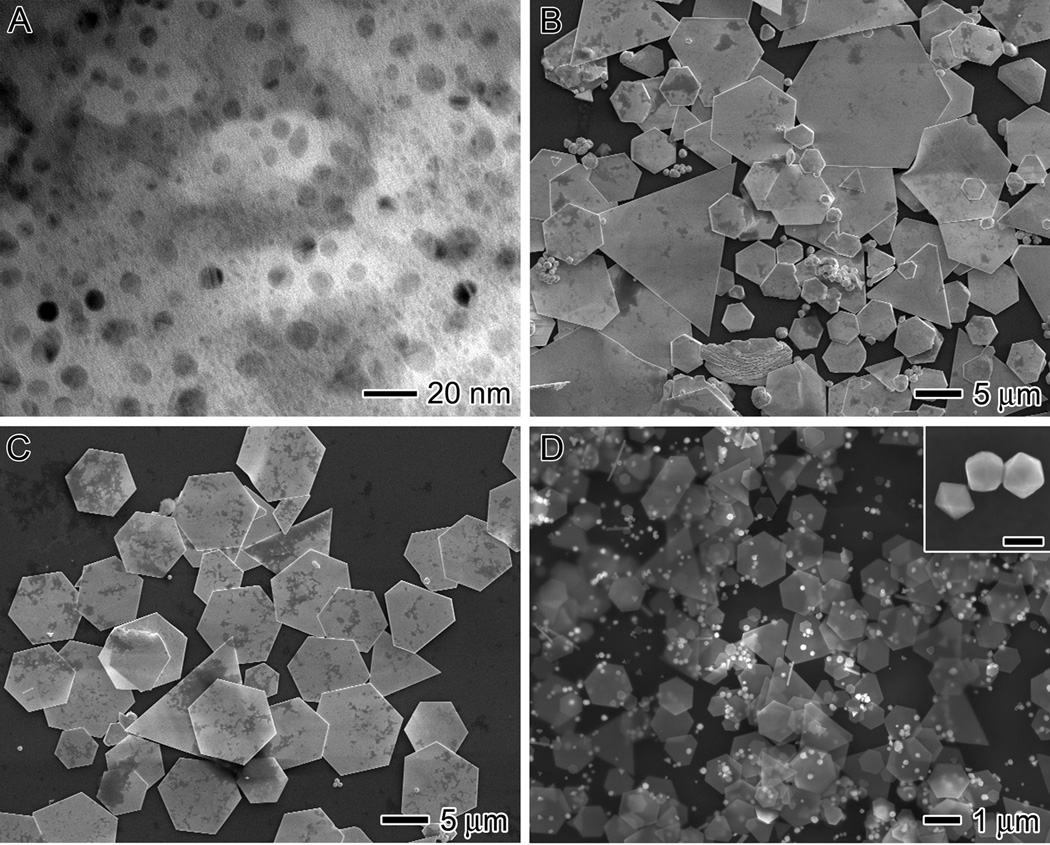
Temperature plays an important role in this synthesis. As previously discussed, it is expected to influence the conformation of the protein. The major driving force for protein denaturation is entropy, and a rise in temperature would increase the entropic effect. Moreover, the temperature should affect the reduction rate of Au ions as well as the rates for the nucleation and growth of the nanoparticles. We explored various temperatures ranging from 4 °C to 75 °C, while keeping the rest of the parameters the same as the standard procedure. We found that at 4 °C, BSA had very little reduction capability. The reaction solution remained yellow and cloudy for up to one week. Figure 2A shows TEM image of this sample at 40 h, revealing that 1–10 nm Au particles were formed and embedded within the proteins. In a second experiment, we increased the temperature of the reaction to the physiological temperature, 37 °C. The reaction was completed within 18 h and exhibited the same color progression as the standard method over this period of time. Few hydroxyl groups are expected to be exposed at 37 °C since BSA only begins to denature at 40 °C. As a result, the reduction of Au ions was still slow. Figure 2B shows SEM image of the product obtained at 37 °C, which contained hexagonal and triangular plates in addition to irregular particles with a broad size distribution. When we conducted the synthesis at 45 °C, the reaction rate increased considerably; the reaction was completed within 4 h. However, the product was still a polydispersed sample containing both plates and irregular particles (not shown).
Figure 2.
Influence of temperature on size and morphology. (A) TEM and (B-D) SEM images of the products synthesized using the standard procedure except at a temperature of 4, 37, 65, and 75 °C, respectively. The scale bar in the inset of (D) is 200 nm.
It was not until the temperature was increased to 55 °C that we obtained a narrow distribution in size for the Au plates, as shown in Figure 1B. The unfolding of the α-helices of BSA was irreversible at temperatures higher than 52 °C because the cysteine pocket unfolded and formed disulphide bonds between the β-sheets.[24,29–31] Thus, we expect the structure of the protein to be quite stable at 55 °C, which will aid in the formation of uniform plates. Figure 2C shows hexagonal and triangular plates that were obtained at 65 °C. The plates have a size distribution similar to those obtained with the standard procedure. It seems that within the temperature range of 55 – 65 °C, the structure of BSA was relatively stable, leading to the formation of uniform plates. The color of the reaction progressed differently when the temperature was increased to 75 °C. It evolved from yellow and turbid, to cloudy white, and then finally opaque dark reddish-brown. The SEM image in Figure 2D shows that the product obtained at 75 °C consisted of a mixture of microplates and polyhedral nanoparticles. The inset shows SEM image at a higher magnification for the polyhedral particles, revealing that they had actually decahedral and icosahedral structures. The hexagonal and triangular plates have mean edge lengths of 1.5 ± 0.7 and 3.0 ± 2.5 µm, respectively. Note that the sizes of the hexagonal and triangular plates synthesized at 75 °C were significantly smaller than those synthesized at 55 °C.
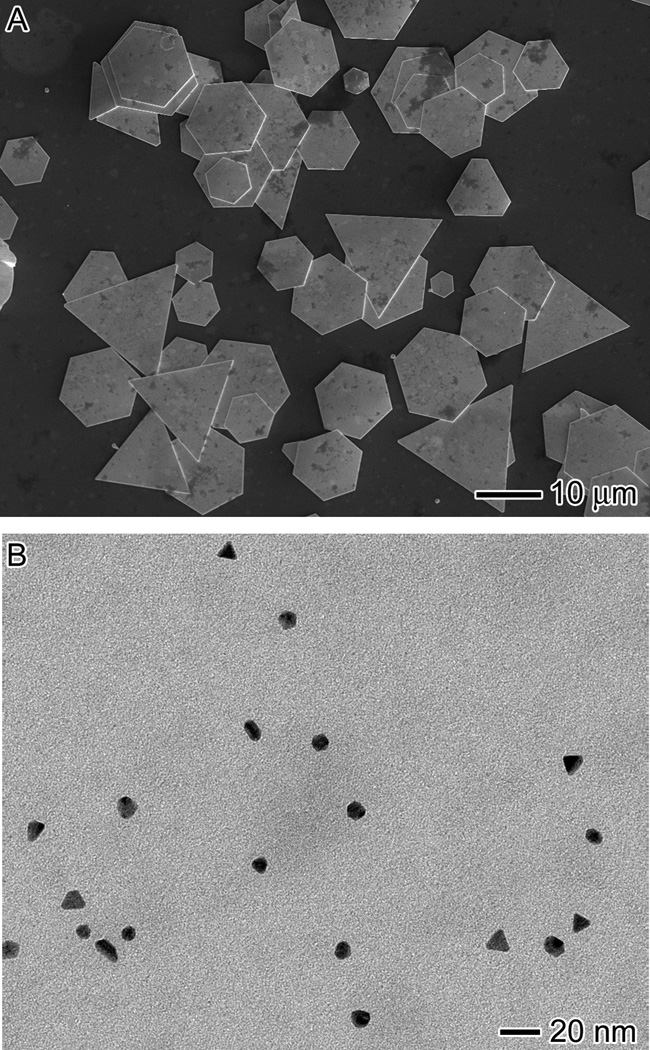
We examined the effect of pH by changing the initial pH value of TBS solution from 9.0 to 3.0 or 10.0 through the addition of HCl or NaOH. The reaction was carried out the same manner as the standard method, except the TBS solution utilized in the reaction had a pH value of 3.0 or 10.0. When the reaction was conducted in TBS with pH = 3.0, the color changes progressed similar to what was observed for the standard procedure. The final solution was a clear, shimmery yellow solution. Figure 3A shows SEM image of the Au microplates obtained at pH = 3.0. We also measured the pH of the solution at the end of the reaction and found that it had decreased to 1.7, which was slightly less than the pH value of 2.0 that was measured for the standard synthesis. The mean edge lengths of hexagonal and triangular plates were 5.8 ± 1.6 and 15.8 ± 3.9 µm, respectively. These plates were significantly larger than the plates obtained using the standard procedure. It was previously observed that in acidic conditions, Au plates grew larger than those synthesized in a less acidic environment.[32] It is likely that the presence of additional H+ ions provided a higher stability for the Au ions to remain in the HAuCl4 complex and hence slowed down the reduction of Au ions. As a result, the number of seeds formed was reduced and more atoms could be added onto the seeds, leading to the formation of larger plates.
Figure 3.
Influence of pH value on size and morphology. (A) SEM and (B) TEM images of the products synthesized using the standard procedure, except at a starting pH value of 3.0 and 10.0, respectively.
For the synthesis conducted in TBS with pH = 10.0, the reaction progressed in a different manner. Upon the injection of HAuCl4, the reaction was a clear yellow solution instead of the previously cloudy solution. The solution started turning cloudy after one hour and remained light yellow and cloudy for the next day and a half. About 40 h into the reaction, the solution turned light purple, indicating the formation of nanoparticles. When the reaction was carried out for longer periods of time, the solution turned into a dark purple color. Figure 3B shows TEM image of the product obtained at t = 40 h, which was actually a mixture of nanoparticles. While most of the product was spherical nanoparticles with a mean diameter of 8.6 ± 1.0 nm, triangular nanoplates with a mean edge length of 12.2 ± 3.5 nm were also produced. When the reaction was completed, the pH of the solution was measured and it was found to have dropped from 10 to 5.6, suggesting that microplates tended to form under acidic conditions.
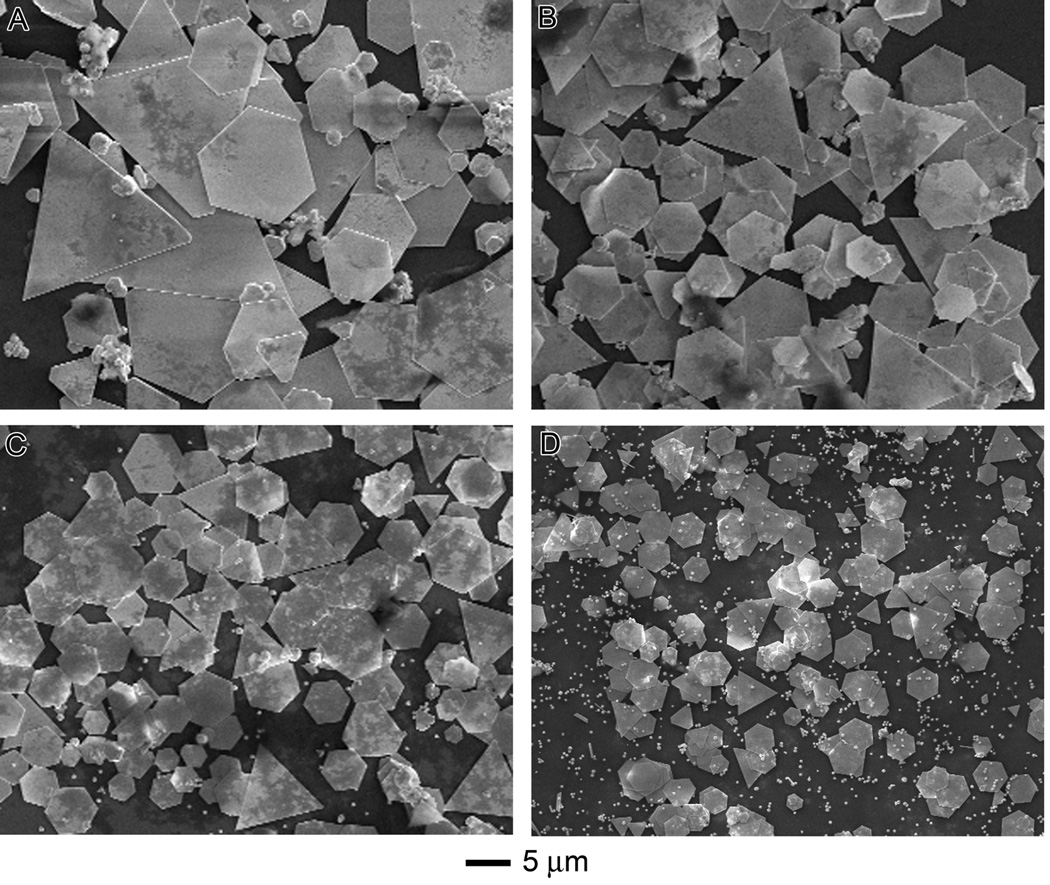
Figure 4 shows SEM images of the products synthesized with different amounts of BSA while keeping the rest of the parameters the same as the standard method. In general, as the amount of BSA increased from 0.010 to 0.090 g, the edge length of hexagonal plates decreased from 4.6 µm ± 1.9 µm to 1.8 µm ± 0.2 µm. This trend has been observed in many other systems and can be attributed to the following logic: the increase of reductant resulted in the formation of more nuclei. Consequently, less salt precursor was available per nuclei so crystals could not grow to larger sizes.[33] Considering BSA as a stabilizing agent, an increased concentration of stabilizing agent would more effectively form a stabilizing layer around each plate thus preventing the formation of larger plates. There was no color change to indicate reduction for reactions with less than 0.010 g of BSA. Reactions containing more than 0.15 g of BSA resulted in the formation of gels.
Figure 4.
Influence of BSA concentration on size and morphology. SEM images of the products synthesized using the standard procedure, except with different amounts of BSA: (A) 0.03, (B) 0.04, (C) 0.07, and (D) 0.09 g.
In a biological system, the solvent is not pure water; it contains many ions which are involved in the regulation of protein structure and function. Proteins have charges distributed non-uniformly across their surface. For BSA, domains I, II, and III have a calculated net charge of −10, −8 and 0, respectively, at pH = 7.0. The ions in solution stabilize these charges, and therefore the BSA structure, via direct interactions through salt bridges, as well as indirect interactions through the electrostatic shielding or osmotic stress.[34] Hence, the ionic species can induce numerous protein conformations.
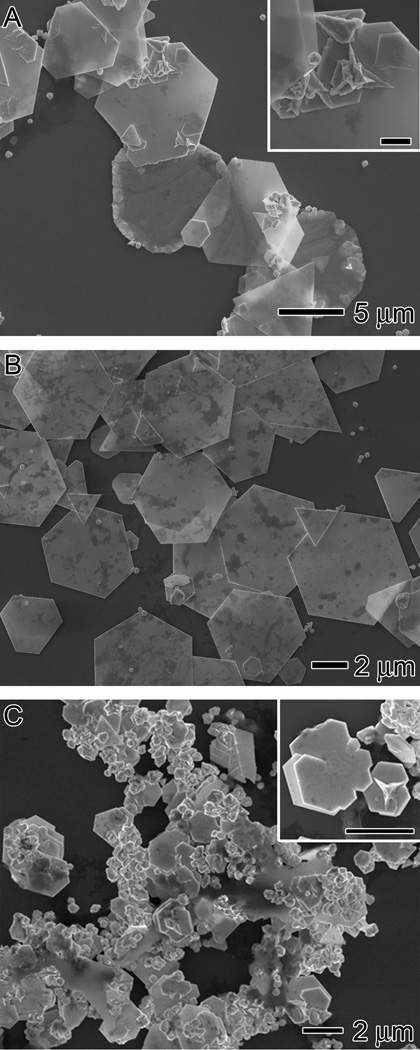
To understand the effect of ionic species on our synthesis, the reaction was first conducted in the absence of any additional ions (i.e., tris, NaCl, HCl, or NaOH). The TBS was replaced with 18 MΩ water while keeping the rest of the parameters the same as the standard procedure. We observed the formation of multiple screw dislocations near the edges of the resultant plates (Figure 5A), indicating that the removal of ionic species had a significant impact on the final morphology of the Au microplates.
Figure 5.
Influence of ions on morphology. (A) SEM image of the product synthesized using the standard procedure except that the TBS solution was replaced with 18 MΩ water. (B, C) SEM images of the products obtained using the standard procedure, except that the TBS solution was substituted with 18 MΩ water supplemented with (B) NaCl and (C) tris, respectively. The scale bars in the insets of (A) and (C) are 2 µm.
A variety of proteins are known to denature at low salt concentrations.[35–38] There are two main components for TBS: sodium chloride (NaCl) and tris (hydroxymethyl aminomethane) (tris). NaCl is the primary constituent in the TBS solution, about five times more than tris. NaCl is found in nearly all biological systems and is known to affect the structure of BSA. BSA is in its native state at NaCl concentrations greater than 0.1 M. Decreasing the concentration of NaCl was previously reported to denature BSA, similar to the effect of heat-induced denaturation.[34] The other constituent is tris, a weak base commonly used for buffers. To determine the effects these two ionic species have in our system, we performed syntheses following the standard procedure, except that the TBS solution was replaced with 18 MΩ water supplemented with either NaCl or tris. The concentration of NaCl or tris was consistent to the concentration in the standard protocol. Figure 5B shows SEM image of the product acquired when the reaction was performed in 18 MΩ water containing NaCl. Screw dislocations were not observed; hexagonal Au microplates were obtained once more, with an average edge length of 3.3 ± 1.2 µm. These hexagonal plates were bigger and had a larger size distribution than those obtained using the standard protocol. When the reaction was conducted with tris instead of NaCl, screw dislocations were again observed along with relatively small irregular shaped particles, as shown in Figure 5C. These products were different from those obtained in pure water (Figure 5A). From these results, it was clear that NaCl was critical to the formation of microplates given that experiments carried out without NaCl resulted in Au structures with screw dislocations. Additionally, it was possible that NaCl may also affect the nucleation and growth of the crystal, but the exact mechanism is yet to be resolved. Tris alone did not seem to play a major role in synthesizing Au microplates; however, we found that the addition of tris with NaCl yielded plates with a narrower size distribution than the reactions without tris. Tris and NaCl may interact with each other, consequently resulting in different structures for BSA that can affect the quality of the products. The exact structure of BSA in these conditions has yet to be determined.
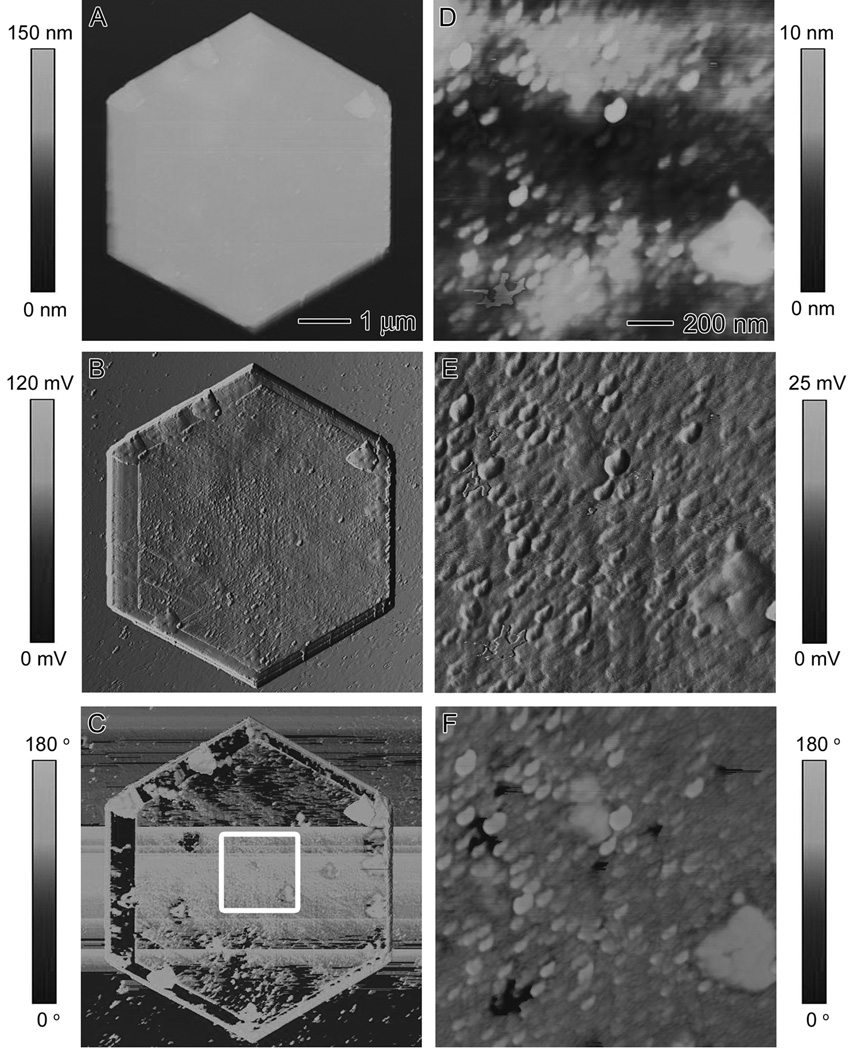
The Au microplates synthesized using the standard method were also characterized by atomic force microscopy (AFM) in tapping mode. Figure 6A shows the height image of a single hexagonal plate. The thickness of the plates was measured and found to have a mean thickness of 90 ± 10 nm. Figure 6B shows the corresponding amplitude image of the same plate. In the amplitude image, finer structures on the surface of the microplates can be observed. When we zoomed in on these finer features, small regular bumps were observed on the surface of the microplate. The phase image shown in Figure 6C indicates that there were significant phase lags of the cantilever probe along the surface, suggesting that the surface has a heterogeneous chemical composition, or at least different adhesion and friction properties at the surfaces. The phase lags do not correspond to the height difference. The bumps are likely BSA on the surface of the Au microplate since there were only two ingredients in this recipe, gold and BSA. Figure 6, D-F, shows the height, amplitude, and phase images, respectively, of the boxed region in Figure 6C.
Figure 6.
AFM characterization of the surface of a Au microplate. (A) Height, (B) amplitude, and (C) phase contrast images of a Au microplate synthesized using the standard procedure. (D-F) Height, amplitude, and phase contrast images, respectively, of the boxed region in (C).
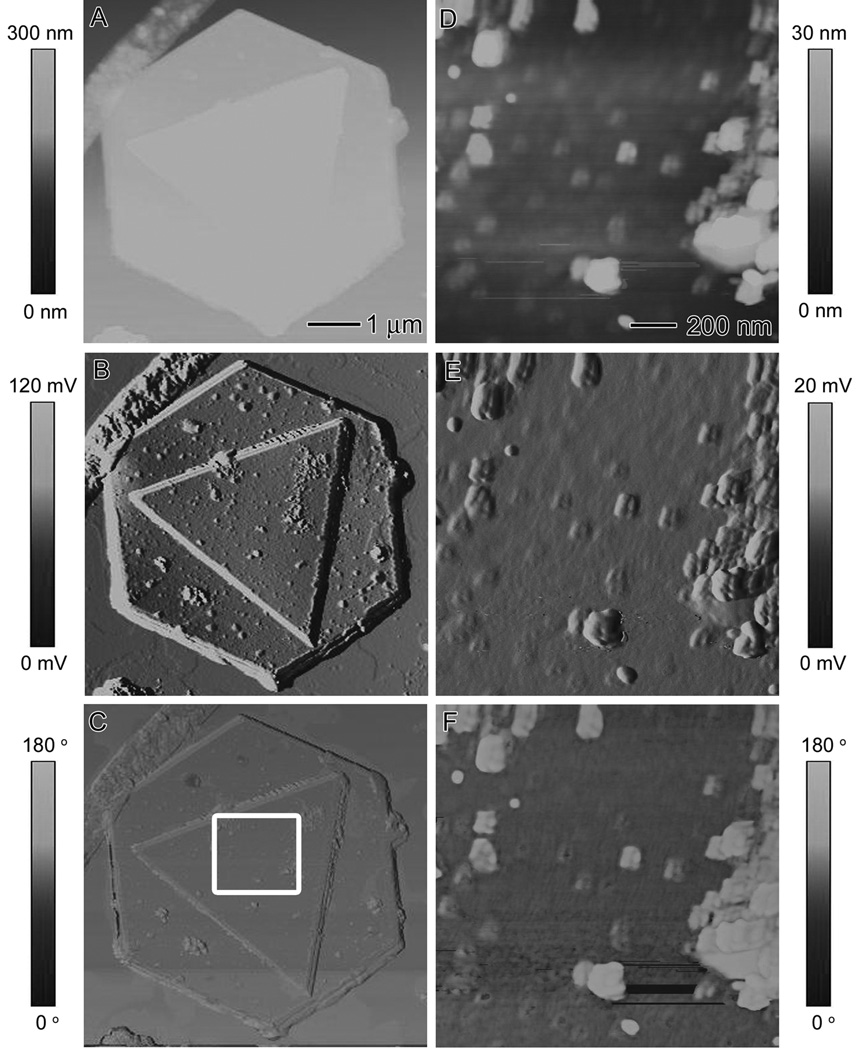
To determine whether the bumps on the surface of Au microplates are BSA, we attempted to displace the proteins from the surface. Proteins are known to be digested in a solution of strong acid (i.e., food digestion). We soaked the Au microplates in a 50/50 solution of HNO3 and water overnight. The Au was not expected to oxidize under this condition because this noble metal requires both HCl and HNO3 for oxidation. Gold can form a complex with chloride in oxidizing environments, so prior to incubation with HNO3, the microplates were washed multiple times with water to ensure no NaCl was left behind from the reaction solution. The sample was reimaged using AFM. Figure 7, A-C, shows the height, amplitude, and phase images, respectively, of two overlapped Au microplates. The HNO3 treatment did not have any effect on the overall shape and size of the Au microplates; however, a closer look at the surface of the microplates revealed that the surface morphology had changed. The height, amplitude, and phase images of the boxed region in Figure 7C are shown in Figure 7, D-F, respectively. The bumps on the surface of the microplates no longer appear regular; instead they seem to have aggregated into larger clumps. These results confirmed that the bumps on the surface were indeed BSA and not Au, since the metal should not have been affected by HNO3. The strong acid caused the protein on the surface to denature, thus to form larger aggregates. Additionally, no divots were observed on the surface of the plates after HNO3 treatment, suggesting that the BSA molecules were not embedded within the Au microplates but rather reside on the surface only.
Figure 7.
AFM characterization of the surface of Au microplates after treatment with HCl. (A) Height, (B) amplitude, and (C) phase contrast images of Au microplates synthesized using the standard procedure after HNO3 treatment in an attempt to remove BSA from the surface. (D) Height, (E) amplitude, and (F) phase contrast images of the boxed region in (C). The observed aggregation of the bumps after treatment with HNO3 indicates that it was caused by BSA residing on the surface of the Au microplate.
Conclusions
We have shown a systematic study on the synthesis of Au microplates using BSA, one of the most ubiquitous proteins, as both the reducing and stabilizing agents in an aqueous buffered solution. The hydroxyl groups in BSA served as a weak reducing agent at mild temperatures, thus providing a kinetically controlled pathway to generate seeds with planar defects, which then grow into Au microplates. The hydroxyl groups were exposed by denaturing the structure of BSA through various conditions such as temperature, pH, and the ionic concentration. The cysteine residues provided a chemical method of adhering BSA onto the Au surface to function as a stabilizing agent. Gold microplates were obtained in a high yield when the structure of BSA denatured at 55–65 °C in an acidic solution containing NaCl. We have also demonstrated that the surface of the Au microplates obtained from this approach was covered by a dense array of BSA bumps. These Au microplates are expected to be readily translated into biological studies. For example, they can be used as a platform for confining cellular growth or as a substrate for the SERS detection of biomarkers. Additionally, these microplates have both nano- and micro- characteristics. The thickness of the Au microplates was on the scale of nanometers which give them optical transparency, and the lateral dimensions were on the scale of micrometer, which gave these plates their reflective and conductive characteristics. Hence, Au microplates can potentially serve as transparent electrodes and deformable mirrors. We have only begun to examine the possibilities of using biological molecules to control the growth of nanostructures into a desired morphology. Using biological molecules provided a simple method to control the assembly of metal atoms in solution.
Experimental Section
TBS solutions were prepared by dissolving tris (0.030 M, Fisher) and NaCl (0.14 M) in 18 MΩ water. The pH was adjusted to 3.0, 7.4, or 10.0 using HCl or NaOH. In a typical synthesis, BSA (0.0100 g to 0.0900 g, Aldrich, A9647) was dissolved in TBS (5.0 mL) in a 24 mL vial and at the given temperature specified in the text for 30 min. Meanwhile, a HAuCl4 solution (18.8 mM, Aldrich, 520198) was prepared in the appropriate TBS solutions. Afterwards, the HAuCl4 solution (3 mL) was injected rapidly into the vial. The entire synthesis was carried out under magnetic stirring. The reaction product was collected by centrifugation at 13,200 rpm for 5 min. The Au microplates were washed with water three times to remove loosely bound BSA. A drop of the aqueous suspension of the Au product was placed on a piece of silicon water (for SEM and AFM) or carbon-coated copper grid (Ted Pella, Redding, CA, for TEM and ED) and dried under ambient conditions for characterization. SEM images were collected using a FEI field-emission scanning microscope (Sirion XL) operated at an accelerating voltage of 10 kV. TEM images and ED patterns were captured using a Phillips 420 transmission electron microscope operated at 100 kV. All height, amplitude, and phase contrast images were collected simultaneously under ambient laboratory conditions in tapping mode using a Nanoscope V Multimode SPM (Veeco Instruments Inc.) Probes were 125 µm length, phosphorus (n) doped silicon tips (a nominal tip radius of 10 nm, MPP-11100–10, Veecoprobes). The images were collected with drive frequencies of 312–320 kHz, typical spring constants of 20–80 N/m, and scan rates of around 1–1.2 Hz. Topography features were measured using the Nanoscope 7.20 software from the same company.
Supplementary Material
Acknowledgements
This work was supported in part by a 2006 Director’s Pioneer Award from the NIH (DP1 OD000798-04), a research grant from the NSF (DMR-0804088), and start-up funds from Washington University in St. Louis. This work was performed in part at the Nano Research Facility (NRF), a member of the National Nanotechnology Infrastructure Network (NNIN), which is supported by the National Science Foundation under award no. ECS-0335765. NRF is part of the School of Engineering and Applied Science at Washington University in St. Louis.
References
- 1.Millstone JE, Park S, Shuford KL, Qin L, Schatz GC, Mirkin CA. J. Am. Chem. Soc. 2005;127:5312. doi: 10.1021/ja043245a. [DOI] [PubMed] [Google Scholar]
- 2.Kan C, Zhu X, Wang G. J. Phys. Chem. B. 2006;110:4651. doi: 10.1021/jp054800d. [DOI] [PubMed] [Google Scholar]
- 3.Xiong Y, McLellan JM, Chen J, Yin Y, Li Z-Y, Xia Y. J. Am. Chem. Soc. 2005;127:17118. doi: 10.1021/ja056498s. [DOI] [PubMed] [Google Scholar]
- 4.Xue C, Metraux GS, Millstone JE, Mirkin CA. J. Am. Chem. Soc. 2008;130:8337. doi: 10.1021/ja8005258. [DOI] [PMC free article] [PubMed] [Google Scholar]
- 5.Lim B, Camargo PHC, Xia Y. Langmuir. 2008;24:10437. doi: 10.1021/la801803z. [DOI] [PubMed] [Google Scholar]
- 6.Xia Y, Xiong Y, Lim B, Skrabalak SE. Angew. Chem. Int. Ed. 2009;48:60. doi: 10.1002/anie.200802248. [DOI] [PMC free article] [PubMed] [Google Scholar]
- 7.Lofton C, Sigmund W. Adv. Funct. Mater. 2005;15:1197. [Google Scholar]
- 8.Jin R, Cao Y, Mirkin CA, Kelly KL, Schatz GC, Zheng JG. Science. 2001;294:1901. doi: 10.1126/science.1066541. [DOI] [PubMed] [Google Scholar]
- 9.Sun Y, Mayers B, Xia Y. Nano Lett. 2003;3:675. [Google Scholar]
- 10.Shankar SS, Rai A, Ankamwar B, Singh A, Ahmad A, Sastry M. Nat. Mater. 2004;3:482. doi: 10.1038/nmat1152. [DOI] [PubMed] [Google Scholar]
- 11.Liu B, Xie J, Lee JY, Ting YP, Chen JP. J. Phys. Chem. B. 2005;109:15256. doi: 10.1021/jp051449n. [DOI] [PubMed] [Google Scholar]
- 12.Xie J, Lee JY, Wang DIC, Ting YP. Small. 2007;3:672. doi: 10.1002/smll.200600612. [DOI] [PubMed] [Google Scholar]
- 13.Xie J, Lee JY, Wang DIC, Ting YP. J. Phys. Chem. C. 2007;111:16858. [Google Scholar]
- 14.Carter DC, Ho JX. Advances in Protein Chemistry. Academic Press; 1994. pp. 153–203. [DOI] [PubMed] [Google Scholar]
- 15.Brown JR. Fed. Proc. 1975;34:591. [Google Scholar]
- 16.Patterson JE, Geller DM. Biochem. Biophys. Res. Comm. 1977;74:1220. doi: 10.1016/0006-291x(77)91648-5. [DOI] [PubMed] [Google Scholar]
- 17.McGillivray RTA, Chung DW, Davie EW. Eur. J. Biochem. 1979;98:477. doi: 10.1111/j.1432-1033.1979.tb13209.x. [DOI] [PubMed] [Google Scholar]
- 18.Hirayama K, Akashi S, Furuya M, Fukuhara KI. Biochem. Biophys. Res. Comm. 1990;173:639. doi: 10.1016/s0006-291x(05)80083-x. [DOI] [PubMed] [Google Scholar]
- 19.Xiong Y, Washio I, Chen J, Cai H, Li Z-Y, Xia Y. Langmuir. 2006;22:8563. doi: 10.1021/la061323x. [DOI] [PubMed] [Google Scholar]
- 20.Singh AV, Bandgar BM, Kasture M, Prasad BLV, Sastry M. J. Mater. Chem. 2005;15:5115. [Google Scholar]
- 21.Singh AV, Patil R, Kasture MB, Gade WN, Prasad BLV. Colloid Surf. B. 2009;69:239. doi: 10.1016/j.colsurfb.2008.11.021. [DOI] [PubMed] [Google Scholar]
- 22.Bos OJM, Labro JFA, Fischer MJE, Witling J, Janssen LHM. J. Biol. Chem. 1989;264:953. [PubMed] [Google Scholar]
- 23.Carter DC, He XM, Munson SH, Twigg PD, Gernert KM, Broom MB, Miller TY. Science. 1989;244:1195. doi: 10.1126/science.2727704. [DOI] [PubMed] [Google Scholar]
- 24.Murayama K, Tomida M. Biochem. 2004;43:11526. doi: 10.1021/bi0489154. [DOI] [PubMed] [Google Scholar]
- 25.Rüegg UT, Rudinger J, Hirs CHW, Serge NT. Reductive cleavage of cystine disulfides with tributylphosphine, Methods in Enzymology. Academic Press; 1977. pp. 111–116. [DOI] [PubMed] [Google Scholar]
- 26.Smith GM. J. Am. Chem. Soc. 2002;44:1769. [Google Scholar]
- 27.Shaw CF., III Chem. Rev. 1999;99:2589. [Google Scholar]
- 28.Germain V, Li J, Ingert D, Wang ZL, Pileni MP. J. Phys. Chem. B. 2003;107:8717. [Google Scholar]
- 29.Clark AH, Saunderson DHP, Suggett A. Int. J. Pept. Protein Res. 1981;17:353. doi: 10.1111/j.1399-3011.1981.tb02002.x. [DOI] [PubMed] [Google Scholar]
- 30.Lin VJC, Koenig JL. Biopolymers. 1976;15:203. doi: 10.1002/bip.1976.360150114. [DOI] [PubMed] [Google Scholar]
- 31.Wetzel R, Becker M, Behlke J, Billwitz H, Bohm S, Ebert B, Hamann H, Krumbiegel J, Lassmann G. Eur. J. Biochem. 1980;104:469. doi: 10.1111/j.1432-1033.1980.tb04449.x. [DOI] [PubMed] [Google Scholar]
- 32.Suito E, Uyeda N. Bull. Inst. Chem. Res. 1965;42:511. [Google Scholar]
- 33.Li X, Li Y, Tan Y, Yang C, Li Y. J. Phys. Chem. B. 2004;108:5192. [Google Scholar]
- 34.Zimmerman RJ, Kanal KM, Sanders J, Cameron IL, Fullerton GD. J. Biochem. Biophys. Meth. 1995;30:113. doi: 10.1016/0165-022x(94)00070-t. [DOI] [PubMed] [Google Scholar]
- 35.Krishnan G, Altekar W. Biochemistry. 2002;32:791. doi: 10.1021/bi00054a008. [DOI] [PubMed] [Google Scholar]
- 36.Lanyi JK. Bacteriol. Rev. 1974;38:272. doi: 10.1128/br.38.3.272-290.1974. [DOI] [PMC free article] [PubMed] [Google Scholar]
- 37.Baxter RM, Gibbons NE. Can. J. Microbiol. 1956;2:599. doi: 10.1139/m56-072. [DOI] [PubMed] [Google Scholar]
- 38.Holmes PK, Halvarson HO. J. Bacteriol. 1965;90:312. doi: 10.1128/jb.90.2.312-315.1965. [DOI] [PMC free article] [PubMed] [Google Scholar]
Associated Data
This section collects any data citations, data availability statements, or supplementary materials included in this article.


