

Abstract
Studies of dyslexia using diffusion tensor imaging (DTI) have reported fractional anisotropy (FA) differences in left inferior frontal gyrus (LIFG) and left temporo-parietal white matter, suggesting that impaired reading is associated with atypical white matter microstructure in these regions. These anomalies might reflect abnormalities in the left perisylvian language network, long implicated in dyslexia. While DTI investigations frequently report analyses on multiple tensor-derived measures (e.g., FA, orientation, tractography), it is uncommon to integrate analyses to examine the relationships between atypical findings. For the present study, semi-automated techniques were applied to DTI data in an integrated fashion to examine white matter microstructure in 14 children with dyslexia and 17 typically developing readers (ages 7-16 years). Correlations of DTI metrics (FA and fiber orientation) to reading skill (accuracy and speed) and to probabilistic tractography maps of the left perisylvian language tracts were examined. Consistent with previous reports, our findings suggest FA decreases in dyslexia in LIFG and left temporo-parietal white matter. The LIFG FA finding overlaps an area showing differences in fiber orientation in an anterior left perisylvian language pathway. Additionally,a positive correlation of FA to reading speed was found in a posterior circuit previously associated with activation on functional imaging during reading tasks. Overall, integrating results from several complementary semi-automated analyses reveals evidence linking atypical white matter microstructure in dyslexia to atypical fiber orientation in circuits implicated in reading including the left perisylvian language network.
Keywords: dyslexia, perisylvian language network, left inferior frontal gyrus, diffusion tensor imaging, fractional anisotropy
1. Introduction
Dyslexia is a common developmental disorder that affects an estimated 5-17% of the population (Shaywitz, 1998). Dyslexia is defined as an unexpected difficulty learning to read in someone who otherwise demonstrates age-appropriate intellectual ability and who is receiving (or has received) typical instruction that allows most individuals to learn to read (Shaywitz, 1998). It is precisely this focal and resistant/persistent nature of this disorder that has suggested that learning differences are connected to neurological differences in affected individuals.
Models attempting to predict reading-associated brain differences in dyslexia have postulated both disruptions of white matter and anomalous function of cortical regions (see Catani and Mesulam, 2008 for a review). Postmortem neuropathological studies have demonstrated cortical ectopias and other microdysgeneses in dyslexia predominantly along the left perisylvian region (Galaburda et al, 1985; Kaufmann & Galaburda, 1989; Humphreys et al, 1990). Recent studies using structural neuroimaging also suggest widespread regions of atypical cortex including posterior temporal, parietal and occipital regions (Brown et al., 2001). In the past, hypotheses regarding potential effects of structural and/or functional differences were generally untestable in living humans. However, due to advances in functional neuroimaging, investigators now have tools that facilitate non-invasive, in vivo experiments designed to better under the neurobiological correlates of reading skill and reading behavior.
Using a variety of functional neuroimaging techniques, researchers have demonstrated atypical patterns of activation in dyslexia in left inferior frontal gyrus (LIFG or Broca's territory) as well as in more posterior temporal, parietal, and occipital regions (to include both Wernicke's and Geschwind's territories - see Catani et al, 2005). For example, in contrast to skilled readers, individuals with dyslexia frequently show a relative underactivation of left temporo-parietal and occipito-temporal regions (Eden et al., 2004; Paulesu et al., 2001; Pugh et al., 2000; Rumsey et al., 1997; Shaywitz et al., 2004; Shaywitz et al., 2002; Simos et al., 2006), and relatively greater activation in the homologous right-hemisphere regions (Pugh et al., 2000; Simos et al., 2000a; Simos et al., 2000b). There have also been differences in activation demonstrated in the LIFG; although the evidence is contradictory as to whether, compared to controls, dyslexia is associated with increases (Pugh et al., 2000; Simos et al., 2000a; Simos et al., 2000b) or decreases (Eden et al., 2004) in activation in this region.
To investigate whether disrupted (or otherwise atypical) white matter connectivity is also associated with dyslexia, several investigators have used Diffusion Tensor Imaging (DTI) -- a uniquely well-suited tool for in vivo examination of white matter microstructure. Primary measures derived from the diffusion tensor matrix include Fractional Anisotropy (FA), commonly used as an indicator of preservation of localized white matter structure (including composition, organization and/or structural integrity), and Principal Diffusion Direction (PDD), commonly used to indicate local white matter fiber orientation. Information obtained during DTI can also be used for tractography, a method for mapping white matter trajectories to reconstruct white matter tracts in vivo (Melhem et al., 2002; Lin et al., 2001; Stietltjes et al., 2001).
Several investigations using DTI have examined FA in children and adults, both with and without dyslexia. The most consistent finding across these studies is FA differences in left temporo-parietal white matter in individuals with dyslexia as compared to normal readers (in adults: Gold et al., 2007; Klingberg et al., 2000; Richards et al., 2008; Steinbrink et al., 2008; and in children: Beaulieu et al., 2005; Deutsch et al., 2005; Dougherty et al., 2007; Nagy et al., 2004; Niogi and McCandliss, 2006; Carter et al., 2009) and of the LIFG (Deutsch et al., 2005; Gold et al., 2007; Qiu et al., 2008; Richards et al., 2008; Steinbrink et al., 2008). Investigators have suggested that their left temporo-parietal and LIFG FA findings may be located within a bundle of perisylvian white matter referred to as the superior longitudinal fasciculus (“SLF”; Klingberg et al., 2000; Carter et al., 2009); in some cases this has been confirmed with atlas-based or region-of-interest localization (Carter et al., 2009, Richards et al., 2008). Other investigators have suggested that FA differences that are located near this long suspected perisylvian language network (oriented along the anterior to posterior axis) are, in fact, within the callosal pathways between left and right hemispheres (Dougherty et al., 2007) or oriented along the superior to inferior axis within the internal capsule (Beaulieu et al., 2005).
Beyond FA findings, DTI studies (Beaulieu et al., 2005; Deutsch et al., 2005; Dougherty et al., 2007; Gold et al., 2007; Klingberg et al., 2000; Molko et al., 2002; Nagy et al., 2004; Niogi and McCandliss, 2006; Carter et al., 2009) have also reported on the primary orientation of fibers, but only a few have statistically compared the differences between good and poor readers in principal diffusion direction (Schwartzman et al., 2005; Steinbrink et al., 2008; Carter et al., 2009). For example, Schwartzman et al used a statistical method for calculating whether the mean orientation was different between two groups and were able to demonstrate previously undetected differences of orientation in focal fiber projections from the corpus callosum, suggesting that the corona radiata of the participants with dyslexia extended more anteriorly than in controls (Schwartzman et al., 2005). A different method, used by Steinbrink et al, calculated a difference image of color maps to demonstrate generalized (rather than focal) differences in orientation of white matter between good and poor readers. Their data in adults showed a greater overall anterior-to-posterior orientation of white matter in control participants compared to those with dyslexia (Steinbrink et al., 2008). Recently, we employed a color map approach within regions of interest to derive metrics of orientation on individual participant images in order to perform statistical testing of differences across participants (Carter et al, 2009). Results demonstrated focal areas of orientation difference between children with and without dyslexia, particularly in the right temporal-parietal region of the perisylvian language network.
Nevertheless, while the aforementioned studies have provided insights into the microstructure of the white matter in dyslexia, to date no study has used tractography to map the perisylvian fiber network in children with dyslexia. Our overarching goal for the present study was to extend previous findings by examining FA and orientation differences between children with and without dyslexia, and then to measure how any indications of white matter difference may relate to the location of the perisylvian white network as defined using tractography. We hypothesized that (1) we would find regional decreases in FA in left temporo-parietal regions and perhaps also in left inferior frontal gyrus, (2) we would detect differences in fiber orientation in these same areas, and (3) these differences would be related to the location of the perisylvian language network.
2. Methods
2.1. Participants
Thirty-three children between 7-16 years old --fourteen children with dyslexia and nineteen typically developing controls -- were scanned using the protocol described below. Data on two control subjects was excluded due to poor data quality (see Image Acquisition section for details). Thus, DTI data was incorporated in this analysis for 31 children: 14 with reading-disabilities (7 males; Age: 11 +/- 3) and 17 Controls (9 males; Age: 11 +/- 2). There was no significant difference in mean age between the two groups (p = .8). Of this group, 9 had ADHD (6 with dyslexia, 3 controls). Additionally, there were 2 left-hand preferring participants, both in the control group and one of whom also had ADHD.
It should be noted that to address any potential influences of ADHD or hand-preference on our results, the analyses were repeated on a more homogenous subset (consisting of 17 of the original 31 participants). This subset excluded participants with ADHD and/or left-hand preference, as well as children less than 10 years of age (to address concern that our adult template would less likely be a good match in terms of size and white matter structure for these young children). This more homogeneous subset included 6 participants with dyslexia (5 males, Age: 12 +/- 3; range 10-16 years) and 11 controls (5 males, Age: 11 +/- 2; range 10-16 years). There was no significant difference in age between these two groups (p = .4). The results of DTI analyses were the same as those of the original sample of 31; therefore, only the results of the data analyses on the larger group are reported.
All subjects were screened for diagnoses of developmental and psychiatric disorders (including ADHD) using the Diagnostic Interview for Children and Adolescents-IV (DICA-IV; Reich et al., 1997), and for any contraindications to the MR environment, e.g., metal braces. Written consent was obtained from each participant at the start of the study in accordance with the Johns Hopkins Medical Institution Review Board.
2.2. Behavioral Data
All participants underwent reading-related behavioral testing and IQ testing as part of a larger project, but relevant to this study were the un-timed and timed (e.g., fluency) measures of word reading and decoding skills. The Basic Skills reading subscale of the Woodcock Johnson 3rd edition (WJ-III; Woodcock et al., 2001) is a composite of the subtests Letter-Word Identification and Word Attack (i.e., decoding pseudowords), and the Test of Word Reading Efficiency (TOWRE; Torgesen, et al., 1999) is a composite of the subtests of Sight Word Efficiency (i.e., rate of word identification) and Phonemic Decoding Efficiency (i.e., rate of decoding pseudowords). In addition to decoding and identifying words, both measures (Basic Skills and TOWRE) require participants to articulate the words or pseudowords aloud; Basic Skills measures accuracy while TOWRE measures speed of accurate articulation. Scores for these measures are reported in standard scores with a mean score being 100 with a standard deviation of 15 points (i.e., in the same manner as IQ scores are reported).
Participants were assigned to the dyslexia group when at least one of their WJ-III subtests (Letter-Word Identification and Word Attack) standard scores was < 90 (i.e., <25th percentile) and their WJ-III Basic Skills composite score was not > 95 (i.e., approximately 40th percentile). One additional participant was categorized as having dyslexia despite WJ-III Word Identification standard score = 92 and WJ-III Word Attack standard score = 93, based on clinical impression from all tests administered as part of the larger study, including his Wechsler Individual Achievement Test 2nd edition (WIAT-II; 2001) Basic Reading composite standard score of 86 (18th percentile). Participants were considered controls if neither of their WJ-III subtest standard scores were < 90 and their WJ-III Basic Skills composite score was > 95. Mean standard scores for the fourteen children with dyslexia were WJ-III Basic Skills 86.5 +/- 5, and for the seventeen controls WJ-III Basic Skills: 104 +/- 6. The groups were also significantly different on Full Scale IQ on the Wechsler Intelligence Scales for Children, version 4 (WISC-IV: control group mean FSIQ = 101 +/- 10; dyslexia group mean FSIQ = 90 +/- 12; p= .01).
The TOWRE Composite score was not used to define control and dyslexia groups but instead was used in correlations of reading ability to fractional anisotropy. Mean standard scores for the children with dyslexia were: TOWRE Composite 77 +/- 11 (standard scores ranged from 45 to 89), and for the controls: TOWRE Composite 101 +/- 10 (standard scores ranged from 85 to 116). The TOWRE scores were distributed similarly to Basic Skills scores (i.e., children with dyslexia tended to perform poorly on the TOWRE as well).
2.3. Image Acquisition
DTI was performed using single-shot EPI with SENSE acquisition (reduction factor of 2.5) on a 3T Philips Gyroscan NT. 2.5 mm slices with no gap, were collected to cover the entire cerebrum and brainstem (TE = 86 msec, TR = 3 sec). Acquisition matrix was 96 × 96 reconstructed to 256 × 256 with a field-of-view of 240 × 240 mm for a .94 mm isotropic in-plane resolution. Diffusion-weighting was applied along 32 spherically-distributed axes with b-value = 700 s/mm2, in addition to a least diffusion-weighted image. Detailed descriptions about the protocol are available in (Mori et al., 2000; Wakana et al., 2004). The measurements were repeated twice to enhance the signal to noise ratio. Only one repetition was collected in two subjects. Two control subjects were excluded from our analysis for substandard image quality defined as a noise level 1.5 standard deviations or more above the mean noise level for all subjects. Noise level was defined as the standard deviation of the difference between the two runs as implemented in CATNAP (Landman et al., 2007a).Visual inspection of images with a wide range of noise levels confirmed that this metric of data quality agrees with qualitative impressions.
2.4. DTI Processing
The diffusion-weighted images were processed on an online Sun SPARC server using CATNAP (Landman et al., 2007b). Motion correction was done using FLIRT (Jenkinson and Smith, 2001) by registering each DWI for an individual to his/her corresponding template dataset created by the mean of that individual's two DWI repetitions (Landman, 2006). The gradient tables were adjusted according to the coregistration parameters (Landman et al., 2007c). To reduce the impact of motion, ghosting and susceptibility artifacts, the diffusion tensor was estimated with the RESTORE method (Chang et al., 2005), as implemented by the Camino diffusion toolkit (Cook et al., 2006); 2.8% of brain voxels across all individuals were identified as outliers and excluded from the tensor fit. There were no significant differences in number of outliers identified across the dyslexia and control groups, indicating that RESTORE did not bias our results.
2.5. Voxel-based analyses of FA Maps
2.5.1. Group Contrasts
In CATNAP a fractional anisotropy map was calculated for each subject and normalized into MNI standard space at 2mm isotropic resolution by affine registration to the JHU DWI template and smoothed with an 8mm FWHM Gaussian kernel. Individual normalized and smoothed FA maps were included in a non-parametric permutation-based group model using “randomize” in FSL (Nichols & Holmes, 2002) to compute the contrast images (Dyslexia > Control and Control > Dyslexia). Both contrasts were computed using 5000 permutations. Results are reported at uncorrected threshold p < 0.001.
2.5.2. Correlation to Behavioral Reading Fluency Measure
A non-parametric regression using “randomize” in FSL examined the areas of FA most correlated (both negatively and positively) with a behavioral measure of reading fluency (TOWRE Composite). Atlas assignments were obtained from three sources Talairach Daemon (Lancaster et al., 2000), AAL (Automated Anatomical Labeling map, Tzourio-Mazoyer et al., 2002; http://www.sph.sc.edu/comd/rorden/template.html), and Harvard/Oxford Atlas (Flitney et al., 2007).”
2.6. Voxel-based analyses of Tensor Orientation
The tensors were normalized into MNI standard space at the same resolution and with the same transformation parameters as used for the other VBA (see FA Map Analyses). The normalized tensors were re-oriented according to the preservation of principal directions scheme as implemented in Camino (Cook et al., 2006) and the principal eigenvector was calculated. Group differences in orientation were determined using a whole brain voxel-wise comparison of the principal eigenvector maps using the method of Schwartzman (Schwartzman et al., 2005).
2.7. Regions of Interest Analyses
2.7.1. ROI delineated by Tractography
The perisylvian language network was delineated in each subject using probabilistic DTI Tractography. Individual subjects' tensor maps were normalized and reoriented into MNI standard space at the reconstruction resolution interpolated by the scanner (.83mm × .83mm × 2.2mm), using the same transformation parameters as above. The ROI was defined in MNI standard space using the Wakana et al. (2007) two- ROI “SLFt” (i.e., superior longitudinal fasciculus including temporal lobe) procedure. Tractography was performed on the normalized and reoriented tensor images using the Probablilistic Index of Connectivity (PICo) method (Parker et al, 2003) implemented in Camino. For each iteration, PICo traced one tract (or streamline) from each seed voxel, following the PDD until termination criterion were met, i.e., an FA threshold of .2 and a curve threshold of 80 degrees. Based on the estimated uncertainty of the PDD, a slightly different route for each streamline was mapped with each iteration. After 1000 iterations, those voxels penetrated by a minimum of 300 streamlines were defined as being part of the perisylvian language network.
2.7.2. ROI Analyses of FA Maps
A slice-by-slice (.82 y-dim × 2.2mm z-dim) comparison along the course of the tractography-defined “SLFt” was computed, similar to the tract-specific profiles presented in Wakana et al, 2007 and Hua et al, 2008, to detect between-group differences in the average FA within the portion of the perisylvian language network contained in each slice using the Mann-Whitney U statistic.
2.8. Connectivity Analyses – Integration of FA and Tractography Analyses
An ROI analysis of the computed streamlines was used to integrate the perisylvian language network tractography with the voxel-based FA analysis. ROI masks were generated for each of the previously identified areas of FA difference and then resampled to match the fiber tracking resolution. Connectivity between each individual's map of the perisylvian language network ROI and the FA difference ROI was determined by how frequently the two regions overlapped; this was operationalized as the maximum number of perisylvian language network streamlines that passed through at least one voxel of the selected FA difference ROI. Potential between-group differences in connectivity were tested using the Mann-Whitney U-test.
3. Results
3.1. FA differences between groups
Decreased FA was found for the dyslexia group (as compared to controls) in white matter of LIFG (near posterior BA 9), left insula (temporo-parietal area near BA 41/13/40), and right frontal (BA 9) regions (see Table 1). The LIFG finding was the most significant cluster in both intensity (z = 4.24) and extent (k = 29) (see Table 1 & Figure 1A).
Table 1.
Regions with Lower Fractional Anisotropy in Dyslexia than Control
| Cluster size | Regions Inlcuded | BA | Side | MNI Coordinates |
p-value | ||
|---|---|---|---|---|---|---|---|
| x | y | z | |||||
| 29 | IFG | 9 | L | -54 | 4 | 30 | 0.0002 |
| 7 | Temporo-parietal | 41/13/40 | L | -46 | -32 | 18 | 0.0004 |
| 7 | IFG | 9 | R | 58 | 6 | 34 | 0.0004 |
IFG is Inferior Frontal Gyrus
Results reported at threshold of uncorrected p = .001 for clusters greater than 5 voxels.
Figure 1.
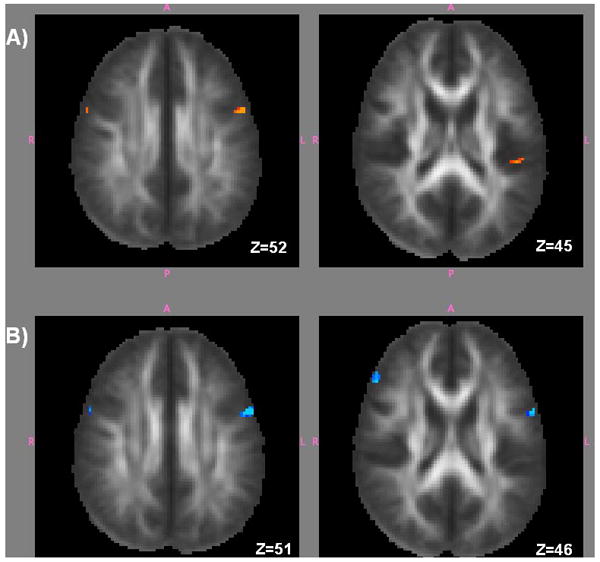
Statistical parametric maps (p<.001, cluster threshold = 5). Panel A (slices shown are z = 52 and z = 45) shows regions of decreased FA in the dyslexia group. Panel B (slices shown are z = 51 and z = 46) shows regions where FA is correlated to performance on the test of word reading (TOWRE).
There were also areas where the dyslexia group showed increased FA compared to controls with the most largest cluster (cluster size = 44) found in the white matter of the left insula extending into medial inferior LIFG; the other clusters were scattered throughout the right hemisphere, including occipital, parietal, temporal and frontal lobes (see Table 2).
Table 2.
Regions with Higher Fractional Anisotropy in Dyslexia than Control
| Cluster size | Regions Inlcuded | BA | Side | MNI Coordinates |
p-value | ||
|---|---|---|---|---|---|---|---|
| x | y | z | |||||
| 44 | Insula, IFG | 13 | L | -44 | 0 | -10 | 0.0004 |
| 26 | Fusiform Gyrus | 20 | R | 50 | -16 | -28 | 0.0004 |
| 20 | Postcentral Gyrus | 3 | R | 34 | -32 | 52 | 0.0002 |
| 15 | Middle Occipital Gyrus | 19 | R | 46 | -70 | -16 | 0.0004 |
| 18 | Putamen | n/a | R | 18 | 20 | -8 | 0.0004 |
| 8 | Hypothalamus | n/a | R | 2 | -4 | -22 | 0.0006 |
| 6 | Superior Temporal Gyrus | 22 | R | 58 | -48 | 10 | 0.0002 |
IFG is Inferior Frontal Gyrus;
Results reported at threshold of uncorrected p = .001 for clusters greater than 5 voxels.
3.2. FA correlations to Reading Fluency
Positive correlation of the FA map to the behavioral reading fluency measure, TOWRE Composite, revealed a statistically significant cluster (p < 0.05 FDR corrected) at the same LIFG location (MNI coordinates: x = -54, y = 4, z = 30; see Table 3) identified on the between-group contrasts as having lower FA in dyslexia (i.e., lower FA correlated with lower reading scores; see Figure 1B). The right hemisphere homologue as well as other left language regions (left lingual gyrus, left superior parietal lobule, left fusiform gyrus and left middle temporal gyrus) were also associated with better TOWRE scores (see Table 3). There were no FA areas found to be negatively associated with TOWRE scores.
Table 3.
Regions where Fractional Anisotropy is Positively Correlated to TOWRE
| Cluster size | Regions Inlcuded | BA | Side | MNI Coordinates |
||
|---|---|---|---|---|---|---|
| x | y | z | ||||
| 82 | IFG | 9/44 | L | -54 | 4 | 30 |
| 36 | IFG | 45/46 | R | 54 | 26 | 20 |
| 41 | Precentral Gyrus | 9/44 | R | 60 | 8 | 10 |
| 50 | Lingual Gyrus | 18 | L | -4 | -94 | -20 |
| 56 | Superior Parietal Lobule | 7 | L | -6 | -72 | 58 |
| 11 | Fusiform Gyrus | 20 | L | -32 | -42 | -20 |
| 7 | Middle Temporal Gyrus | 21 | L | -54 | 0 | -22 |
TOWRE is Test of Word Reading Efficiency;
Results reported at threshold of uncorrected p = .001 for clusters greater than 5 voxels.
All cluster maxima have p-values of p= 0.0002, the maximum possible with 5000 permutations
3.3. Orientation differences between groups
Orientation (PDD) differences between groups were most notable in the LIFG (in the white matter beneath the junction of the precentral gyrus and IFG near BA 44). Other findings included left posterior superior temporal gyrus (near BA 22), left thalamus, and anterior and posterior portions of the cingulate gyrus (see Table 4).
Table 4.
Regions with Different PDD in Dyslexia than Control
| Cluster size | Regions Inlcuded | BA | Side | MNI Coordinates |
Z-value | ||
|---|---|---|---|---|---|---|---|
| x | y | z | |||||
| 28 | IFG | 44 | L | -48 | 6 | 16 | 5.00 |
| 14 | Thalamus | n/a | L | -12 | -32 | 4 | 4.48 |
| 12 | STG | 22 | L | -54 | -46 | 8 | 4.30 |
| 12 | post. cingulate g. | 7 | R | -6 | -58 | 32 | 3.97 |
| 11 | ant. cingulate g. | 10 | R | -6 | 52 | 6 | 4.86 |
PDD is Principal Diffusion Direction; IFG is Inferior Frontal Gyrus; STG is Superior Temporal Gyrus.
Result reported at threshold of uncorrected p = .001 for clusters greater than 10 voxels.
3.4. FA differences in Perisylvian Language Network ROI
A slice-by-slice comparison along the course of the perisylvian language network (see Figure 2) revealed a trend toward significant between-group differences in FA in the LIFG (slice 148) region of the superior portion of the perisylvian language network.
Figure 2.

Slice-wise comparison of the perisylvian language network. This figure shows the slice by slice comparison of the dyslexia group (gray lines) versus the control group (black lines). Dashed lines indicate standard deviation within each group. The upper panel compares mean FA in each slice for the superior (fronto-parietal) portion of the perisylvian language network. The lower panel compares mean FA in each slice for the inferior (temporal lobe) portion of the perisylvian language network. Slices with a significant difference between groups are identified by an asterisk. The brain image shows approximate location of slices.
3.5. Integration of FA Analyses and Tractography
Finally, the probablistic tractography method allowed us to examine the overlap between each individual's perisylvian language network ROI and the LIFG ROI (site of lower FA in dyslexia compared to controls). The probabilistically defined perisylvian language network for 6 of the 17 controls (35%) and 1 of the 14 dyslexia (7%) were identified as intersecting with the LIFG ROI (see Figures 3 & 4). There was a significant difference between the groups (p=.003, Mann-Whitney U) in the maximum number of streamlines found within the LIFG ROI. This analysis for the area of lower FA in dyslexia located in the left temporo-parietal region (see Figure 4) showed no overlap with the perisylvian language network.
Figure 3.
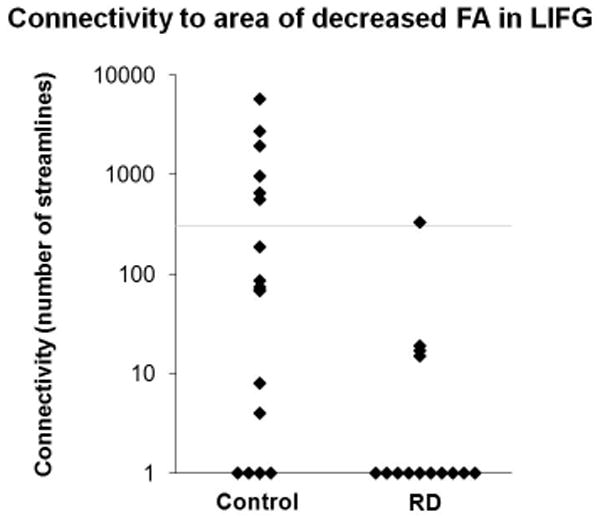
Differential connectivity of the perisylvian language network to a region of decreased FA in dyslexia in the left inferior frontal gyrus. There is significant difference between the groups (p=.003, Mann-Whitney U) in the maximum number of streamlines found within the ROI. The y-axis indicates the maximum number of streamlines for each individual within the perisylvian language network ROI that intersect at least one voxel of the region of decreased FA in dyslexia (Note: the scale is logarithmic). The grey line indicates 300 streamlines, i.e., our threshold for considering a streamline to be within the perisylvian language network.
Figure 4.
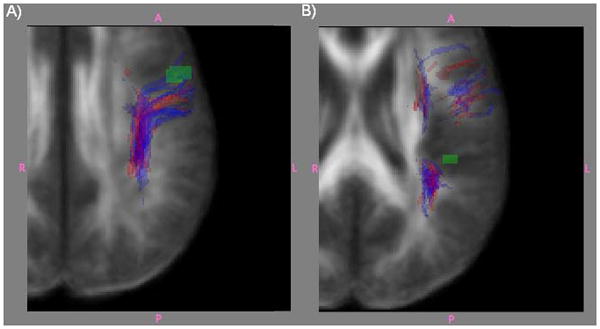
Areas of decreased FA in relation to the perisylvian language network. The tractographic representation of the perisylvian language networks are shown in blue for controls and in red for dyslexia. Panel A shows regions of decreased FA in dyslexia in LIFG. Panel B shows regions of decreased FA in dyslexia in left superior temporal gyrus.
4.1 Discussion
Overall, our findings both converged with and extended beyond previous DTI findings in dyslexia. Our results were consistent with previously reported findings of decreased FA in left temporo-parietal and LIFG regions, as well as within a perisylvian language network ROI (Gold et al., 2007; Klingberg et al., 2000; Qiu et al., 2008; Richards et al., 2008; Carter et al., 2009). In particular, we were able to replicate this finding using a more automated method (i.e., involving normalization of individual scans to allow for voxel-based group analyses) than we had previously used in Carter et al., 2009. Furthermore, this study extended previous findings by providing evidence linking this commonly reported LIFG area of focal difference in white matter microstructure (identified in this case as a trend on whole brain analysis) to a focal difference in the orientation of fibers of the tractography-defined perisylvian language network.
Our results include several converging streams of evidence that particularly implicate the LIFG as a site of atypical microstructure in dyslexia (i.e., group differences in FA and fiber orientation in the region, as well as, correlation of FA to psychometric measures of reading fluency). Our findings suggesting less organized white matter in this region and an apparent linkage to the perisylvian language network, provide evidence to support the hypothesis that this important fiber bundle shows atypical microstructure in children with dyslexia. This link appears to lend support to an expanded connectionist model of dyslexia (that includes potential dysfunction within cortical regions and the connecting fiber tracts) and atypical connectivity between cortical regions and might reflect white matter adaptations to atypical cortical function and/or structure, i.e., re-wiring to avoid a problem area. This interpretation is particularly appealing in light of brain pathology studies identifying small islands of mis-placed gray matter in dyslexia, i.e., ectopias (Galaburda et al, 1979; Galaburda et al, 1985) that were not found in tissue from people without dyslexia (Kaufmann & Galaburda, 1989).
With regard to the left temporo-parietal region, although we did see the expected trend toward decreased FA in dyslexia, this area did not intersect with the tractography-defined perisylvian language network of any of the participants (with or without dyslexia). This is a notable finding since we had anticipated that we would find a link between this temporo-parietal region and the perisylvian language network. One limitation of our study is that we reconstructed streamlines which were only continuous from the frontal lobe to the temporal lobe, thus missing fibers that branched off earlier into the temporal gray matter. This should be explored further in future investigations by using tractography to follow the paths of fibers beginning with temporo-parietal region of FA decrease as a seed region. It may also be the case that our technique may be more sensitive to finding differences in the frontal lobe, due to much greater partial volume effects related to multiple crossing fibers near the posterior limb of the tract. A further complication is that our underlying hypotheses were restricted to left hemisphere language-related perisylvian white matter, i.e., not including the right hemisphere homologues, in order to minimize false positive findings due to multiple comparisons. However, there is also published evidence from pathology (Galaburda et al., 1987) and neuroimaging (e.g., Pugh et al., 2001 & Carter et al., 2009) studies suggesting that the right hemisphere, particularly the posterior temporo-parietal region, may be a major location of difference between children with dyslexia and controls. Our own data demonstrates a correlation between word reading fluency measures and right hemisphere homologues of language-related brain regions (i.e., right IFG). Therefore, examination of selected right hemisphere regions of interest will be an important next step in this line of research.
It may be helpful to set our findings in the context of a model of reading and dyslexia relative to neuroanatomy. Pugh and colleagues (Pugh et al, 2001) describe such a model that distinguishes anterior and posterior circuits with the posterior circuit separated into two components, i.e., ventral (occipito-temporal) and dorsal (temporo-parietal). The dorsal path is thought to most closely be associated with effortful decoding (e.g., learning to read new words, see Pugh et al., 1996) while the ventral path is thought to be activated when rapid stimulus identification is important (Pugh et al., 2001; Price et al, 1996). The anterior circuit, which includes the LIFG, shows greater functional activation when participants read low frequency words and pseudowords especially when associated with audible articulation (Fiez & Petersen, 1998). This model is a useful framework for understanding our findings. We found a positive correlation to both accuracy and speed (i.e., TOWRE composite score) of FA in the putative anterior and dorsal posterior circuits; in other words, less structural cohesion in these two circuits was associated with poorer reading skill. This makes sense given that these tests include decoding (associated with anterior and dorsal posterior circuits) and articulation (associated with accentuated anterior circuit activity). Additionally, we found a positive correlation of FA to speed (i.e., TOWRE composite score) in the putative ventral posterior path; that is consistent with findings of functional neuroimaging indicating greater activation of the ventral posterior circuit when speedy decoding is required (Fiez & Petersen, 1998). Thus, our study findings that suggest microstructrual differences in the same circuits that show functional activation differences could support the possibility of a direct relationship between structure and function during reading tasks.
Our study further explored the neural correlates of reading accuracy finding differences in orientation of white matter fibers in anterior and dorsal posterior circuits (i.e., same as FA finding). Using more data-driven techniques (i.e., tractography and ROIs determined from FA maps), our results suggest that the anterior circuit differences between controls and children with dyslexia include differences in the specific path of the perisylvian language network.
In addition to the trend toward FA decrease in dyslexia, we also encountered areas of FA increase in dyslexia. Most of these findings were located in right hemisphere regions. Although we have previously reported DTI findings of differences in orientation in the right hemisphere (Carter et al., 2009), in that study we did not find FA differences, and this has not been reported by other DTI investigators. The more conventional, albeit labor intensive, approach used by Carter et al (2009) avoids the process of normalization of tensors that raises the concern of introducing bias in the process of separating the tensors from the original anatomical context (Jones et al., 2005). We acknowledge this potential bias as a limitation of the more automated approach used in the experiment presented in this paper.
The other area of increase in FA in dyslexia was in the left insula. Although certainly speculative at this time, it may be that an FA increase in dyslexia reflects an atypical increase in local white matter organization in this region. Furthermore, our data suggests potential group differences in fiber orientation in a location very near the left insula area of increased FA. However, our analyses did not show evidence of an intersection with the tractography-defined perisylvian language network of any of the participants (with or without dyslexia). One possible explanation of the FA findings in the insula could be the presence of a well organized fiber tract in an atypical location. Another possibility is that our findings reflect a lack of fibers that should typically be oriented in another direction, i.e., a paucity of fiber branching or crossing of fiber tracts relative to the control situation. That being said, it is important to acknowledge that there are several reasons to be cautious in interpreting this finding; e.g., our approach may have limited precision in localizing white matter of the insula as this is a region of extremely thin cortex that may overlap with the white matter of the basal ganglia on some imaging slices. An additional consideration is that the basal ganglia (including the putamen) and the thalamus and hypothalamus are within regions of mixed gray and white matter so that FA changes can be misleading due to partial volume averaging.
4.2 Limitations
One limitation of the voxel-based analyses that we report is our use of a liberal threshold (p < 0.001 uncorrected for multiple comparisons). Our review of the extant literature has indicated that the left IFG and left temporo-parietal areas of decreased FA in dyslexia have been very consistently reported by many investigators (e.g., Klingberg et al., 2000; Niogi et al., 2006); for this reason, we feel that it would be an inaccurate and misleading representation to report these subthreshold data as negative findings of significance. Rather, we propose that our data is consistent with, albeit weaker than, previous reports. Possible explanations for our less robust findings may be related to differences in our population; e.g., our participants with dyslexia had to meet criteria based on a combination of scores for WJ-III Word Attack and Word ID. This is in contrast to the study by Niogi et al, 2006 that used Word ID alone to determine group assignment (control vs. dyslexia), or Klingberg et al., 2000 that based dyslexia determination on past history. Additionally, our data may reflect a weakness of our more automated approach; namely, there is very likely a loss of power associated with the blurring of gray-to- white matter boundaries in the normalization process that results in a larger proportion of voxels with FA values confounded by partial volume effects. We acknowledge that the relative weakness of our findings is an important limitation of the VBA analysis but our primary finding of interest is how this region of interest overlaps with the perisylvian language network. In essence, the trends in our VBA analysis identified a priori regions of interest (i.e., ROIs consistent with previous studies).
The method we apply here, probabilistic tractography, incorporates the individual variability of the tensor matrix of each participant at each voxel; thus, allowing for variation in the pathway mapped from any one seed voxel on repeated iterations of tracking. The resulting probabilistic perisylvian fiber network path is comprised of the voxels that are more frequently included in the tract after multiple iterations. This individualized, probabilistic method for identifying the perisylvian fiber tract region of interest (ROI) is selected, rather than an atlas-defined method, to minimize the potential false negative results; specifically, we did not want to miss potential systematic differences in the white matter tracts of children with and without dyslexia that might not be detected with an atlas-defined mask. Additionally, this individual tract information may give some indication of whether between-group FA differences actually represent abnormalities specifically located within this perisylvian fiber network, rather than nearby white matter (see Beaulieu et al., 2005; Dougherty et al., 2007; Shaywitz, 1998). However, the choice to use this probabilistic tractography approach has its own limitations. There is an increased risk of false positive results due to errant streamlines (i.e., not truly within the tract of interest) that may be generated in this stochastic process. We have attempted to minimize false positives by restricting our streamlines to those that meet the criteria of the longest part of the tract, i.e., including frontal, parietal and temporal lobe portions. Additionally, we used 1000 iterations of the tracking algorithm and then restricted the streamlines included in the analysis to those that were frequently generated to decrease the probability of accepting an incorrect streamline. Nevertheless, these precautions will not correct for any systematic bias in the underlying assumptions due to errors in selection of seed voxels. To minimize these errors, we chose a voxel selection procedure demonstrated to have high inter-rater (0.913) and intra-rater (0.944) reliability (Wakana et al., 2007).
4.3 Summary
Despite some methodological limitations, the locations of our findings may prove interesting for future study; it is possible that they reflect “true” group differences in brain tissue size or volume that may introduce systematic FA differences in gray/white border regions. One could also speculate that since right hemisphere abnormalities in dyslexia have been reported using fMRI (e.g., Pugh, et al., 2000), our findings might reflect neural correlates of functional differences. Future studies may benefit from use of multiple imaging methods (e.g., DTI in combination with fMRI; see Steinbrink et al for an example) to provide further insights into dyslexia, particularly regarding potential right hemisphere abnormalities in dyslexia.
In summary, the present study not only to replicates but also extend previous findings by use of complementary methods, including probabilistic tractography, which adds to the body of literature and understanding of the role of the perisylvian language network in dyslexia. Nevertheless, this study also has several limitations. It does not address potential cortical differences in function or structure that may accompany the white matter changes. Future studies should include comparison of cortical and white matter differences simultaneously, similar to recent work done by some investigators (Epelbaum 2008; Steinbrink 2008). In particular, demonstrations of concurrent functional and local differences in white matter structure might begin to lay the foundation for answering questions about causal relationships between the two in dyslexia. Furthermore, our methods were all automated or semi-automated from data transformed into a standard space. More detailed, and thus labor intensive, work should also be done to verify our findings using hand drawn ROIs in native space (i.e., untransformed data) to more specifically examine the individual data with fewer confounds. Closer examination of orientation differences using a complementary color map analysis, in a manner similar to that we recently reported in Carter et al., 2009, would also broaden our understanding of white matter microstructure in dyslexia, particularly if results of different analyses continue to converge.
Acknowledgments
This work was supported by the Johns Hopkins School of Medicine General Clinical Research Center (NIH M01-RR00052); and the Kennedy Krieger Institute Learning Disability Research Center (P50 HD052121); the National Institute for Neurological Disorders (R01 NS049096); the Eunice Kennedy Shriver National Institute of Child Health and Human Development (RO1-HD044073); and the F. M. Kirby Research Center. Sincere thanks to BettyAnn Chodkowski for her contributions to this work.
Footnotes
Publisher's Disclaimer: This is a PDF file of an unedited manuscript that has been accepted for publication. As a service to our customers we are providing this early version of the manuscript. The manuscript will undergo copyediting, typesetting, and review of the resulting proof before it is published in its final citable form. Please note that during the production process errors may be discovered which could affect the content, and all legal disclaimers that apply to the journal pertain.
References
- Beaulieu C, Plewes C, Paulson LA, Roy D, Snook L, Concha L, Phillips L. Imaging brain connectivity in children with diverse reading ability. NeuroImage. 2005;25:1266–1271. doi: 10.1016/j.neuroimage.2004.12.053. [DOI] [PubMed] [Google Scholar]
- Brown WE, Eliez S, Menon, Rumsey M, White CD, Reiss AL. Preliminary evidence of widespread morphological variations of the brain in dyslexia. Neurology. 2001;56:781–783. doi: 10.1212/wnl.56.6.781. [DOI] [PubMed] [Google Scholar]
- Carter JC, Lanham DC, Cutting LE, Clements-Stephens AM, Chen X, Hadzipasic M, Kim J, Denckla MB, Kaufmann WE. A dual DTI approach to analyzing white matter in children with dyslexia. Psychiatry Research. 2009 Apr 5; doi: 10.1016/j.pscychresns.2008.09.005. [DOI] [PMC free article] [PubMed] [Google Scholar]
- Catani M, Jones DK, ffytche DH. Perisylvian language networks of the human brain. Annals of Neurology. 2005;57:8–16. doi: 10.1002/ana.20319. [DOI] [PubMed] [Google Scholar]
- Catani M, Mesulam M. The arcuate fasciculus and the disconnection theme in language and aphasia: History and current state. Cortex. 2008;44:953–961. doi: 10.1016/j.cortex.2008.04.002. [DOI] [PMC free article] [PubMed] [Google Scholar]
- Chang LC, Jones DK, Pierpaoli C. RESTORE: robust estimation of tensors by outlier rejection. Magnetic Resonance in Medicine. 2005;53:1088–1095. doi: 10.1002/mrm.20426. [DOI] [PubMed] [Google Scholar]
- Cook PA, Bai Y, Nedjati-Gilani S, Seunarine KK, Hall MG, Parker GJ, Alexander DC. Camino: Open-Source Diffusion-MRI Reconstruction and Processing; 14th Scientific Meeting of the International Society for Magnetic Resonance in Medicine; Seattle, WA, USA. 2006. p. 2759. [Google Scholar]
- Deutsch GK, Dougherty RF, Bammer R, Siok WT, Gabrieli JD, Wandell BA. Children's reading performance is correlated with white matter structure measured by diffusion tensor imaging. Cortex. 2005;41:354–363. doi: 10.1016/s0010-9452(08)70272-7. [DOI] [PubMed] [Google Scholar]
- Dougherty RF, Ben-Shachar M, Deutsch GK, Hernandez A, Fox GR, Wandell BA. Temporal-callosal pathway diffusivity predicts phonological skills in children. Proceedings of the National Academy of Sciences, U S A. 2007;104:8556–8561. doi: 10.1073/pnas.0608961104. [DOI] [PMC free article] [PubMed] [Google Scholar]
- Eden GF, Jones KM, Cappell K, Gareau L, Wood FB, Zeffiro TA, Dietz NA, Agnew JA, Flowers DL. Neural changes following remediation in adult developmental dyslexia. Neuron. 2004;44:411–422. doi: 10.1016/j.neuron.2004.10.019. [DOI] [PubMed] [Google Scholar]
- Fiez JA, Petersen SE. Neuroimaging studies of word reading. Proceedings of the National Academy of Science. 1998;95:914–921. doi: 10.1073/pnas.95.3.914. [DOI] [PMC free article] [PubMed] [Google Scholar]
- Flitney D, Webster M, Patenaude B, Seidman L, Goldstein J, Tordesillas Gutiérrez D, Eickhoff S, Amunts K, Zilles K, Lancaster J, Haselgrove C, Kennedy D, Jenkinson M, Smith S. Anatomical brain atlases and their application in the FSL View visualisation tool. Thirteenth Annual Meeting of the Organization for Human Brain Mapping; Chicago, IL, USA. 2007. [Google Scholar]
- Friston KJ, Holmes AP, Poline JB, Grasby PJ, Williams SC, Frackowiak RS, Turner R. Analysis of fMRI time-series revisited. NeuroImage. 1995;2:45–53. doi: 10.1006/nimg.1995.1007. [DOI] [PubMed] [Google Scholar]
- Humphreys P, Kaufmann WE, Galaburda AM. Developmental dyslexia in women” neuropathological findings in three patients. Annals of Neurology. 1990;28(6):727–738. doi: 10.1002/ana.410280602. [DOI] [PubMed] [Google Scholar]
- Galaburda AM, Kemper TL. Cytoarchitectonic abnormalities in developmental dyslexia: a case study. Annals of Neurology. 1979;6:94–100. doi: 10.1002/ana.410060203. [DOI] [PubMed] [Google Scholar]
- Galaburda AM, Sherman GF, Rosen GD, Aboitiz F, Geschwind N. Developmental dyslexia: four consecutive patients with cortical anomalies. Annals of Neurology. 1985;18:222–233. doi: 10.1002/ana.410180210. [DOI] [PubMed] [Google Scholar]
- Galaburda AM, Corsiglia J, Rosen GD, Sherman GF. Planum temporale asymmetry: reappraisal since Geschwind and Levitsky. Neuropsychologia. 1987;25:853–868. [Google Scholar]
- Gold BT, Powell DK, Xuan L, Jiang Y, Hardy PA. Speed of lexical decision correlates with diffusion anisotropy in left parietal and frontal white matter: evidence from diffusion tensor imaging. Neuropsychologia. 2007;45:2439–2446. doi: 10.1016/j.neuropsychologia.2007.04.011. [DOI] [PMC free article] [PubMed] [Google Scholar]
- Holmes AP, Blair RC, Watson JDG, Ford I. Non-Parametric Analysis of Statistic Images From Functional Mapping Experiments. Journal of Cerebral Blood Flow and Metabolism. 1996;16:7–22. doi: 10.1097/00004647-199601000-00002. [DOI] [PubMed] [Google Scholar]
- Hua K, Zhang J, Wakana S, Jiang H, Li X, Reich DS, Calabresi PA, Pekar JJ, van Zijl PCM, Mori S. Tract probability maps in stereotaxic spaces: Analyses of white matter anatomy and tract-specific quantification. NeuroImage. 2008;39:336–347. doi: 10.1016/j.neuroimage.2007.07.053. [DOI] [PMC free article] [PubMed] [Google Scholar]
- Nichols TE, Holmes AP. Nonparametric Permutation Tests for Functional Neuroimaging: A Primer with Examples. Human Brain Mapping. 2002;15:1–25. doi: 10.1002/hbm.1058. [DOI] [PMC free article] [PubMed] [Google Scholar]
- Jenkinson M, Smith S. A global optimisation method for robust affine registration of brain images. Medical Image Analysis. 2001;5:143–156. doi: 10.1016/s1361-8415(01)00036-6. [DOI] [PubMed] [Google Scholar]
- Kaufmann WE, Galaburda AM. Cerebrocortical microdysgenesis in neurologically normal subjects: a histopathologic study. Neurology. 1989;39:238–244. doi: 10.1212/wnl.39.2.238. [DOI] [PubMed] [Google Scholar]
- Klingberg T, Hedehus M, Temple E, Salz T, Gabrieli JD, Moseley ME, Poldrack RA. Microstructure of temporo-parietal white matter as a basis for reading ability: evidence from diffusion tensor magnetic resonance imaging. Neuron. 2000;25:493–500. doi: 10.1016/s0896-6273(00)80911-3. [DOI] [PubMed] [Google Scholar]
- Lancaster JL, Woldorff MG, Parsons LM, Liotti M, Freitas CS, Rainey L, Kochunov PV, Nickerson D, Mikiten SA, Fox PT. Automated Talairach Atlas labels for functional brain mapping. Human Brain Mapping. 2000;10:120–131. doi: 10.1002/1097-0193(200007)10:3<120::AID-HBM30>3.0.CO;2-8. [DOI] [PMC free article] [PubMed] [Google Scholar]
- Landman BA, Farrell JA, Mori S, van Zijl PC, Prince JL. International Society for Magnetic Resonance in Medicine Meeting. Seattle, Washington, USA: 2006. On the Coregistration of Diffusion Weighted Images. [Google Scholar]
- Landman B, Bazin PL, Prince JL. Diffusion Tensor Estimation by Maximizing Rician Likelihood. Eleventh Institute of Electrical and Electronics Engineers Computer Society International Conference, Computer Vision Workshop on Mathematical Methods in Biomedical Image Analysis; Rio de Janerio, Brazil. 2007a. [DOI] [PMC free article] [PubMed] [Google Scholar]
- Landman BA, Farrell JA, Jones CK, Smith SA, Prince JL, Mori S. Effects of diffusion weighting schemes on the reproducibility of DTI-derived fractional anisotropy, mean diffusivity, and principal eigenvector measurements at 1.5T. Neuroimage. 2007b;36:1123–1138. doi: 10.1016/j.neuroimage.2007.02.056. [DOI] [PMC free article] [PubMed] [Google Scholar]
- Landman BA, Farrell JA, Patel N, Mori S, Prince JL. Organization for Human Brain Mapping Meeting. Chicago, Illinois, USA: 2007c. DTI Fiber Tracking: The Importance of Adjusting DTI Gradient Tables for Motion Correction. CATNAP - A Tool to Simplify and Accelerate DTI Analysis. [Google Scholar]
- Lin CP, Tseng WY, Cheng HC, Chen JH. Validation of diffusion tensor magnetic resonance axonal fiber imaging with registered manganese-enhanced optic tracts. Neuroimage. 2001;14:1035–1047. doi: 10.1006/nimg.2001.0882. [DOI] [PubMed] [Google Scholar]
- Melhem ER, Mori S, Mukundan G, Kraut MA, Pomper MG, van Zijl PC. Diffusion tensor MR imaging of the brain and white matter tractography. Amercian Journal of Roentgenology. 2002;178:3–16. doi: 10.2214/ajr.178.1.1780003. [DOI] [PubMed] [Google Scholar]
- Molko N, Cohen L, Mangin JF, Chochon F, Lehericy S, Le Bihan D, Dehaene S. Visualizing the neural bases of a disconnection syndrome with diffusion tensor imaging. Journal of Cognitive Neuroscience. 2002;14:629–636. doi: 10.1162/08989290260045864. [DOI] [PubMed] [Google Scholar]
- Mori S, Kaufmann WE, Pearlson GD, Crain BJ, Stieltjes B, Solaiyappan M, van Zijl PC. In vivo visualization of human neural pathways by magnetic resonance imaging. Annals of Neurology. 2000;47:412–414. [PubMed] [Google Scholar]
- Nagy Z, Westerberg H, Klingberg T. Maturation of white matter is associated with the development of cognitive functions during childhood. Journal of Cognitive Neuroscience. 2004;16:1227–1233. doi: 10.1162/0898929041920441. [DOI] [PubMed] [Google Scholar]
- Niogi SN, McCandliss BD. Left lateralized white matter microstructure accounts for individual differences in reading ability and disability. Neuropsychologia. 2006;44:2178–2188. doi: 10.1016/j.neuropsychologia.2006.01.011. [DOI] [PubMed] [Google Scholar]
- Parker GJM, Haroon HA, Wheeler-Kingshott CAM. A Framework for a Streamline-Based Probabilistic Index of Connectivity (PICo) using a Structural Interpretation of MRI Diffusion Measurements. Journal of Magnetic Resonance Imaging. 2003;18:242–254. doi: 10.1002/jmri.10350. [DOI] [PubMed] [Google Scholar]
- Paulesu E, Demonet JF, Fazio F, McCrory E, Chanoine V, Brunswick N, Cappa SF, Cossu G, Habib M, Frith CD, Frith U. Dyslexia: cultural diversity and biological unity. Science. 2001;291:2165–2167. doi: 10.1126/science.1057179. [DOI] [PubMed] [Google Scholar]
- Price C, Moore C, Frackowiak RSJ. The effect of varying stimulus rate and duration on brain activity during reading. Neuroimage. 1996;3:40–52. doi: 10.1006/nimg.1996.0005. [DOI] [PubMed] [Google Scholar]
- Pugh KR, Shaywitz BA, Shaywitz SE, Constable TR, Skudlarski P, Fulbright RK, Bronen RA, Shankweiler DP, Katz L, Fletcher JM, Gore JC. Cerebral organization of component processes in reading. Brain. 1996;119:1221–1238. doi: 10.1093/brain/119.4.1221. [DOI] [PubMed] [Google Scholar]
- Pugh KR, Mencl WE, Jenner AR, Katz L, Frost SJ, Lee JR, Shaywitz SE, Shaywitz BA. Functional neuroimaging studies of reading and reading disability (developmental dyslexia) Mental Retardation and Developmental Disabilities Research Review. 2000;6:207–213. doi: 10.1002/1098-2779(2000)6:3<207::AID-MRDD8>3.0.CO;2-P. [DOI] [PubMed] [Google Scholar]
- Pugh KR, Mencl WE, Jenner AR, Katz L, Frost SJ, Lee JR, Shaywitz SE, Shaywitz BA. Neurobiological studies of reading and reading disability. Journal of Communication Disorders. 2001;34:479–492. doi: 10.1016/s0021-9924(01)00060-0. [DOI] [PubMed] [Google Scholar]
- Qiu D, Tan LH, Zhou K, Khong PL. Diffusion tensor imaging of normal white matter maturation from late childhood to young adulthood: voxel-wise evaluation of mean diffusivity, fractional anisotropy, radial and axial diffusivities, and correlation with reading development. Neuroimage. 2008;41:223–232. doi: 10.1016/j.neuroimage.2008.02.023. [DOI] [PubMed] [Google Scholar]
- Reich W, Welner Z, Herjanic B. Diagnostic Interview for Children- IV (DICA-IV) Toronto, Ontario, Canada: Multi-Health Systems Incorporated; 1997. [Google Scholar]
- Richards T, Stevenson J, Crouch J, Johnson LC, Maravilla K, Stock P, Abbott R, Berninger V. Tract-based spatial statistics of diffusion tensor imaging in adults with dyslexia. American Journal of Neuroradiology. 2008;29:1134–1139. doi: 10.3174/ajnr.A1007. [DOI] [PMC free article] [PubMed] [Google Scholar]
- Rumsey JM, Nace K, Donohue B, Wise D, Maisog JM, Andreason P. A positron emission tomographic study of impaired word recognition and phonological processing in dyslexic men. Archives of Neurology. 1997;54:562–573. doi: 10.1001/archneur.1997.00550170042013. [DOI] [PubMed] [Google Scholar]
- Schwartzman A, Dougherty RF, Taylor JE. Cross-subject comparison of principal diffusion direction maps. Magnetic Resonance in Medicine. 2005;53:1423–1431. doi: 10.1002/mrm.20503. [DOI] [PMC free article] [PubMed] [Google Scholar]
- Shaywitz BA, Shaywitz SE, Blachman BA, Pugh KR, Fulbright RK, Skudlarski P, Mencl WE, Constable RT, Holahan JM, Marchione KE, Fletcher JM, Lyon GR, Gore JC. Development of left occipitotemporal systems for skilled reading in children after a phonologically- based intervention. Biological Psychiatry. 2004;55:926–933. doi: 10.1016/j.biopsych.2003.12.019. [DOI] [PubMed] [Google Scholar]
- Shaywitz BA, Shaywitz SE, Pugh KR, Mencl WE, Fulbright RK, Skudlarski P, Constable RT, Marchione KE, Fletcher JM, Lyon GR, Gore JC. Disruption of posterior brain systems for reading in children with developmental dyslexia. Biological Psychiatry. 2002;52:101–110. doi: 10.1016/s0006-3223(02)01365-3. [DOI] [PubMed] [Google Scholar]
- Shaywitz SE. Dyslexia. New England Journal of Medicine. 1998;338:307–312. doi: 10.1056/NEJM199801293380507. [DOI] [PubMed] [Google Scholar]
- Simos PG, Breier JI, Fletcher JM, Bergman E, Papanicolaou AC. Cerebral mechanisms involved in word reading in dyslexic children: a magnetic source imaging approach. Cerebral Cortex. 2000a;10:809–816. doi: 10.1093/cercor/10.8.809. [DOI] [PubMed] [Google Scholar]
- Simos PG, Breier JI, Fletcher JM, Foorman BR, Bergman E, Fishbeck K, Papanicolaou AC. Brain activation profiles in dyslexic children during non-word reading: a magnetic source imaging study. Neuroscience Letters. 2000b;290:61–65. doi: 10.1016/s0304-3940(00)01322-7. [DOI] [PubMed] [Google Scholar]
- Simos PG, Fletcher JM, Denton C, Sarkari S, Billingsley-Marshall R, Papanicolaou AC. Magnetic source imaging studies of dyslexia interventions. Developmental Neuropsychology. 2006;30:591–611. doi: 10.1207/s15326942dn3001_4. [DOI] [PubMed] [Google Scholar]
- Steinbrink C, Vogt K, Kastrup A, Muller HP, Juengling FD, Kassubek J, Riecker A. The contribution of white and gray matter differences to developmental dyslexia: Insights from DTI and VBM at 3T. Neuropsychologia. 2008 doi: 10.1016/j.neuropsychologia.2008.07.015. [DOI] [PubMed] [Google Scholar]
- Stieltjes B, Kaufmann WE, van Zijl PCM, Fredericksen K, Pearlson GD, Mori S. Diffusion tensor imaging and axonal tracking in the human brainstem. NeuroImage. 2001;14:723–735. doi: 10.1006/nimg.2001.0861. [DOI] [PubMed] [Google Scholar]
- Torgesen JK, Wagner RK, Rashotte C. Test of Word Reading Efficiency (TOWRE) Austin, Texas, USA: Pro-Ed Incorporated; 1999. [Google Scholar]
- Tzourio-Mazoyer N, Landeau B, Papathanassiou D, Crivello F, Etard O, Delcroix N, Mazoyer B, Joliot M. Automated anatomical labeling of activations in SPM using a macroscopic anatomical parcellation of the MNI MRI single-subject brain. NeuroImage. 2002;15:273–89. doi: 10.1006/nimg.2001.0978. [DOI] [PubMed] [Google Scholar]
- Wakana S, Caprihan A, Panzenboeck MM, Fallon JH, Perry M, Gollub RL, Hua K, Zhang J, Jiang H, Dubey P, Blitz A, van Zijl PC, Mori S. Reproducibility of quantitative tractography methods applied to cerebral white matter. NeuroImage. 2007;36:630–644. doi: 10.1016/j.neuroimage.2007.02.049. [DOI] [PMC free article] [PubMed] [Google Scholar]
- Wakana S, Jiang H, Nagae-Poetscher LM, van Zijl PC, Mori S. Fiber tract-based atlas of human white matter anatomy. Radiology. 2004;230:77–87. doi: 10.1148/radiol.2301021640. [DOI] [PubMed] [Google Scholar]
- Wechsler D. Wechsler Individual Achievement Tests, Second edition (WIAT-II) San Antonio, Texas, USA: The Psyhcological Corporation; 2001. [Google Scholar]
- Woodcock RW, McGrew KS, Mather N. Woodcock-Johnson III - Tests of Achievement (WJ-III) Itasca, Illinois, USA: Riverside Publishing; 2001. [Google Scholar]