Abstract
We compared global patterns of gene expression between two bird species, the chicken and zebra finch, with regard to sex bias of autosomal versus Z chromosome genes, dosage compensation, and evolution of sex bias. Both species appear to lack a Z chromosome–wide mechanism of dosage compensation, because both have a similar pattern of significantly higher expression of Z genes in males relative to females. Unlike the chicken Z chromosome, which has female-specific expression of the noncoding RNA MHM (male hypermethylated) and acetylation of histone 4 lysine 16 (H4K16) near MHM, the zebra finch Z chromosome appears to lack the MHM sequence and acetylation of H4K16. The zebra finch also does not show the reduced male-to-female (M:F) ratio of gene expression near MHM similar to that found in the chicken. Although the M:F ratios of Z chromosome gene expression are similar across tissues and ages within each species, they differ between the two species. Z genes showing the greatest species difference in M:F ratio were concentrated near the MHM region of the chicken Z chromosome. This study shows that the zebra finch differs from the chicken because it lacks a specialized region of greater dosage compensation along the Z chromosome, and shows other differences in sex bias. These patterns suggest that different avian taxa may have evolved specific compensatory mechanisms.
The recent sequencing of the genome of a second bird species, the zebra finch (Taeniopygia guttata) (Warren et al. 2010), now allows important comparative studies to discern patterns of genome organization that are common to birds and distinct from those of other taxa. Here we compare patterns of sex bias and sex chromosome dosage compensation in the zebra finch and chicken (Gallus gallus). The avian chromosomes generally have conserved gene content (Shetty et al. 1999; Nanda et al. 2008), and the zebra finch and chicken have similar numbers of macro- and microchromosomes (Pigozzi and Solari 1998; Itoh and Arnold 2005). The female is heterogametic (ZW) and the male is homogametic (ZZ). The zebra finch and chicken Z chromosomes have similar sets of genes, but have experienced a significant rearrangement of gene order since the two lineages split (Itoh et al. 2006; Warren et al. 2010).
Sex chromosome dosage compensation involves diverse sex-specific mechanisms that adjust the expressed dose of genes encoded on heteromorphic sex chromosomes, to offset the sex difference in expression that would otherwise result from the sex difference in copy number of sex chromosome genes (Birchler et al. 2006; Chang et al. 2006; Arnold et al. 2008). Dosage compensation mechanisms operate not only to reduce sex bias in expression of sex chromosome genes, but also to reduce the disparity of expressed dose of sex chromosome and autosomal (A) genes (Nguyen and Disteche 2005). Three different X chromosome-wide mechanisms of dosage compensation are reported for Caenorhabditis elegans, Drosophila melanogaster, and mammals, but all of these mechanisms are effective in reducing the expected sexual disparity of X gene expression. Birds show no chromosome-wide dosage compensation mechanism, based on small-scale and genome-wide analyses (Baverstock et al. 1982; Kuroda et al. 2001; McQueen et al. 2001; Kuroiwa et al. 2002; Ellegren et al. 2007; Itoh et al. 2007). In chickens, expression of Z gene mRNAs are, on average, about 1.4–1.6 times higher in males than females, even before gonadal differentiation, a remarkable sex difference for an entire sex chromosome (Arnold et al. 2008; Zhang et al. 2010). The lack of effective dosage compensation is reported also for the silkworm moth, another ZW system (Zha et al. 2009), suggesting an unexpected difference in selection pressures on XX/XY versus ZZ/ZW systems (Mank 2009).
Although most chicken Z genes are expressed at higher levels in males than females, some genes show no sex bias, indicating that some mechanism compensates for the sexual disparity in gene copy number. Some compensated genes are concentrated in a region of the short arm of the chicken Z chromosome, near the MHM (male hypermethylated) locus (Melamed and Arnold 2007; Arnold et al. 2008; Mank and Ellegren 2009a,b; Melamed et al. 2009). The MHM locus encodes a non-coding RNA MHM that is expressed only in females, possibly because of the greater methylation of DNA near MHM in males (Teranishi et al. 2001). Moreover, the chromatin near MHM shows female-specific acetylation of histone 4 at lysine 16, a modification that is predicted to increase gene expression (Bisoni et al. 2005). These findings suggest that the ncRNA MHM may participate in a local dosage-compensation mechanism that increases expression of near-MHM genes in females. Here we present evidence that the putative MHM mechanism is not common to all birds, and present other evidence that regulation of sex bias in gene expression differs in zebra finch and chicken despite their common pattern of ineffective compensation of Z chromosome gene expression.
Results
Global analysis of gene expression in the zebra finch
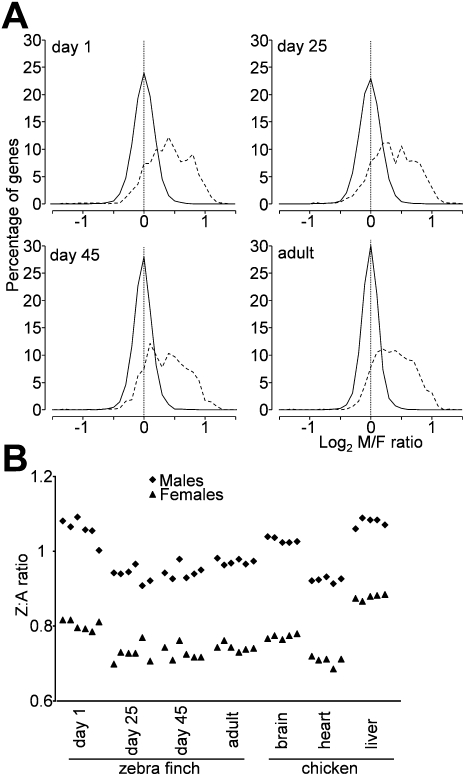
We previously reported that M:F ratios of gene expression for Z genes are significantly greater than those for A genes in both chicken and zebra finch, based on microarray analysis of more than 28,000 genes for chicken but only 84 A and 40 Z genes for zebra finch (Itoh et al. 2007). Here, we extend the previous analysis considerably by using 20,160 probes to measure transcript levels in zebra finch telencephalon. At each of four different developmental stages, the M:F ratios were greater in Z than A genes (Supplemental Table 1) (Kruskal-Wallace non-parametric test for Z vs. A: P < 2.2 × 10⁻¹⁶ for all developmental stages), and the distributions of M:F ratios for Z genes were shifted significantly to the right (Fig. 1A) (Kolmogorov Smirnov [KS] two-sample test: P < 2.2 × 10⁻¹⁶ for all developmental stages).
Figure 1.
(A) Distributions of log2 male-to-female (M:F) ratios of gene expression ratios for zebra finch telencephalon at four ages. Autosomal (A) genes (solid line) have a distribution around a mode of 1 (log2 ratio of 0), showing that average autosomal genes are not sex-biased. The width of the distribution is a measure of overall sex bias, which is smallest in adulthood. In contrast, the distribution for Z genes (dotted line) is shifted significantly to the right, indicating that there is an overall male bias of Z genes. Nevertheless, some Z genes show no sex bias, indicating that some process compensates for the sex difference in Z copy number for those genes. Bin size = 0.1. (B) Z:A ratios of expression for each individual zebra finch (left), compared to published values for chicken embryo (Itoh et al. 2007). In general, Z:A ratios were comparable in the two species, with values in male near 1 and values in females near 0.8.
Similarities and differences between species in patterns of sex bias in gene expression
In mammals, the level of expression of X chromosome genes is near that of autosomal (A) genes (Nguyen and Disteche 2005). In contrast, the mean Z:A ratios of expression (using the expression level metric) (see Supplemental Methods) for zebra finch samples were consistently higher in males than females for each developmental stage, which is a pattern similar to chicken Z:A ratios (Fig. 1B; Supplemental Table 1). The zebra finch Z:A ratios for telencephalon were closest to those for brain in chick embryos (Itoh et al. 2007), suggesting that tissue-specific variation in Z:A ratio might be conserved across bird species (Fig. 1B). The Z:A ratios in males were near 1 (0.9–1.1) in both chicken and zebra finch, as expected because males have the same double dose of both Z and A genes. In females, however, the ratios in females were 0.65–0.9, above the 0.5 Z:A ratio of number of chromosomes, suggesting that Z genes are up-regulated in females (Fig. 1B).
A similar conclusion comes from analysis of A versus Z gene expression levels (Supplemental Fig. 1). Male and female A genes were expressed at a similar level. In contrast, Z genes showed generally higher levels of expression in males at all four developmental stages. Z genes in males had levels of expression similar to those of A genes, whereas in females Z gene expression was significantly lower, probably as a result of Z monosomy in females. However, expression of Z genes in females was greater than half the value of A gene expression, suggesting that some compensatory mechanism works via up-regulation of female genes.
Analysis of levels of gene expression raises the possibility that the two species achieve partial dosage compensation via different mechanisms. Z and A genes were categorized into two groups: (1) unbiased (1/1.3 < M:F < 1.3, t-test: P > 0.05) and (2) male-biased (M:F > 1.3, t-test: P < 0.05) (Supplemental Fig. 2). In both species, male-biased Z genes were expressed at higher levels than A genes in males (Wilcoxon rank-sum test: P < 0.05), suggesting that male bias of these genes is not simply the result of the 2:1 difference in number of Z chromosomes. Interestingly, unbiased Z genes appear to be expressed significantly lower than A genes in both sexes in chickens (Supplemental Fig. 2; Ellegren et al. 2007), suggesting some down-regulation of Z genes in males to achieve dosage compensation. In contrast, in zebra finches, unbiased Z genes are expressed at the same level as A genes in males but at a significantly lower level than A genes in females (Wilcoxon rank-sum test, P < 0.05), suggesting mostly female-specific up-regulation of Z gene expression to achieve compensation. At each age in the zebra finch, in males the expression level of male-biased Z genes was significantly higher than that of unbiased Z genes (Wilcoxon rank-sum test: P < 0.05, except at day 45) (Supplemental Fig. 2A), whereas in females the expression level of male-biased Z genes was significantly lower than that of unbiased Z genes (Wilcoxon rank-sum test: P < 0.05) (Supplemental Fig. 2A). In chicken, the male and female expression of male-biased Z genes was significantly higher than those of unbiased Z genes in both sexes (Wilcoxon rank-sum test: P < 0.05) (Supplemental Fig. 2B). These patterns suggest that the compensation status of Z genes may result from different patterns of male- and female-specific regulation in the two species. Because these species differences in level of expression could have been influenced by differences in array platform or by species differences in the genes that comprise male-biased or unbiased categories, further work is needed to evaluate this possibility.
The number of sex-biased genes changed dramatically as a function of age and tissue (Supplemental Table 2A,B) and was highest at day 25. Using either of two statistical criteria (t-test, P < 0.05; false discovery rate [FDR], P < 0.1), A and Z genes were classified as male- or female-biased (Supplemental Table 2). The reduction in number of sex-biased genes caused by use of the more stringent criterion (FDR) was much greater among A genes than Z genes, indicating that Z genes are more reliably sex-biased than A genes. The age-related change in number of sex-biased genes appears to be the result of fluctuations in the number of sex-biased A genes rather than Z genes, since the number of sex-biased Z genes was relatively constant across ages (Supplemental Table 2A). We further compared gene groups based on the time of development at which they showed sex bias (Supplemental Table 3). Many Z genes were consistently male-biased at all ages (Supplemental Table 3, Group A). A large number of A genes were specifically biased at certain ages, especially at earlier developmental stages such as day 1 or day 25 (Supplemental Table 3, groups E, F, G, H). In addition, ∼40%–50% of the unbiased Z genes were unbiased (P > 0.05, 1/1.3 < M:F < 1.3) consistently at all ages.
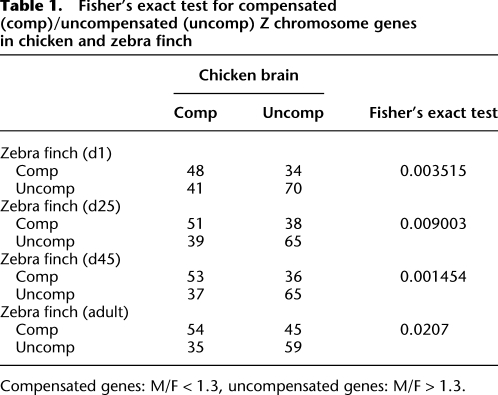
We asked if the dosage-compensated genes, those showing a similar level of expression in the two sexes (Ellegren et al. 2007; Itoh et al. 2007), were the same in the two species. We classified genes as compensated or not, and measured the overlap of the two populations in the two species (Table 1). Through all four developmental stages, compensated Z genes in zebra finch tended to be compensated in chicken more often than they were uncompensated. This result suggests that the dosage sensitivity of specific sets of Z genes is somewhat evolutionarily conserved.
Table 1.
Fisher's exact test for compensated (comp)/uncompensated (uncomp) Z chromosome genes in chicken and zebra finch
Compensated genes: M/F < 1.3, uncompensated genes: M/F > 1.3.
Absence of regional dosage compensation in zebra finch Z chromosome
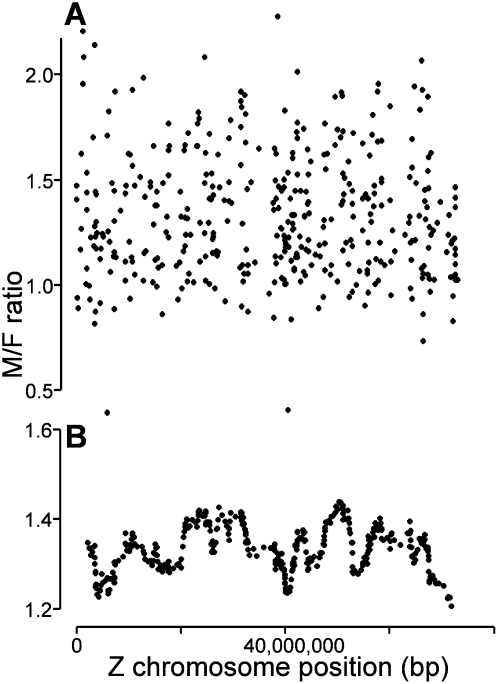
The distribution of M:F ratios for Z and A genes was quite similar in zebra finch and chicken; a minority of Z genes appeared to be dosage-compensated, but many were not (Fig. 1A; Itoh et al. 2007). However, in the chicken Z chromosome, dosage-compensated genes are particularly concentrated in a region (27–30 Mb) near the location of expression of the noncoding RNA MHM (male hypermethylated) (Melamed and Arnold 2007; Melamed et al. 2009) that has been suggested to be involved in dosage compensation (Teranishi et al. 2001; Bisoni et al. 2005). To determine whether zebra finch Z genes show regional differences in dosage compensation, we mapped M:F ratios of Z genes along the chromosome (Fig. 2A). In general, genes with high or low M:F ratios were found along the entire chromosome. The running average of M:F ratios had similar valleys and peaks along the chromosome, irrespective of the age of the sample and the width of the averaging window (Fig. 2B; Supplemental Fig. 3 for sliding window of 30 genes; data not shown for other windows in the range of 10–60 genes; Warren et al. 2010). Unlike chicken, which has a statistically significant valley near MHM and a significant peak on Zq, none of the dips or peaks in the running average curve for zebra finch is unlikely to occur by chance. Thus, we detect no region of unusual sex bias.
Figure 2.
Sex bias in gene expression along the zebra finch Z chromosome. (A) Plot of M:F ratios of expression ratios of individual Z genes as a function of Z chromosome gene position using data from day 45 zebra finch telencephalon. (B) Graph of the running average of 30 M:F ratios of expression (data from A) plotted at the median gene position along the zebra finch Z chromosome.
Absence of MHM sequence and associated histone modification in zebra finch
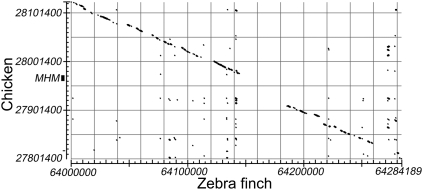
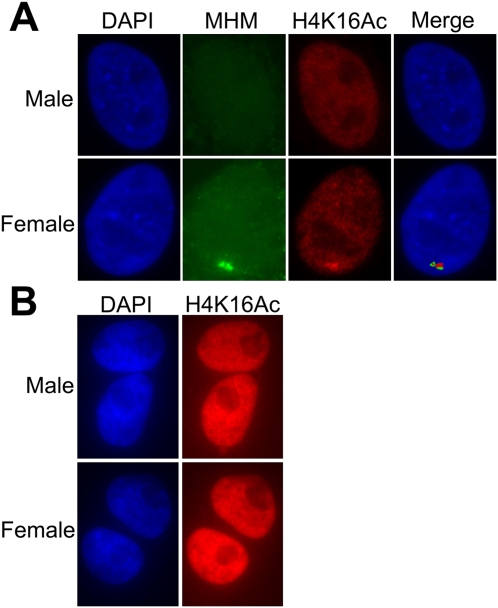
We aligned the 27.8–28.1-Mb region around the MHM locus in chicken with the corresponding region of the zebra finch Z chromosome (bl2seq: http://blast.ncbi.nlm.nih.gov/Blast.cgi). Although the chicken gene order was completely conserved in the zebra finch and the regions had a linear alignment over most of the 300-kb region, the 40-kb region surrounding the MHM locus in chickens was absent from the current draft of the zebra finch sequence (Fig. 3). Furthermore, several probes (genomic and cDNA) encoding the MHM locus did not recognize any sequence of the zebra finch genomic DNA on a Southern blot (data not shown), confirming the apparent absence of an MHM homologous sequence in the zebra finch. Previously, Teranishi et al. (2001) reported that MHM transcripts accumulate in female chicken nuclei near the MHM locus, and Bisoni et al. (2005) found accumulation of acetylated histone H4K16 at the same site in metaphase Z chromosomes. We confirmed that similar co-accumulation of both the MHM transcript and H4K16Ac occurs on the chicken Z chromosome in interphase nuclei of female chicken fibroblasts (Fig. 4A), but found no strong accumulation of acetylated H4K16 in zebra finch cells (Fig. 4B). As a group, these results support the conclusion that the MHM locus is absent in zebra finches and that zebra finches lack chromatin specializations found near the chicken MHM locus. The absence of MHM in zebra finch correlates with the absence of the “MHM valley” or cluster of genes with lower M:F ratios found near MHM in chickens.
Figure 3.
Alignment of the chicken genome sequence near the MHM locus (27.8–28.1 Mb) on Zp, with the corresponding zebra finch genome sequence at 64.0–64.3 Mb on Zq. The region encoding the MHM non-coding RNA is not present in the current draft of the zebra finch genome.
Figure 4.
(A) Colocalization in interphase chicken fibroblasts of the MHM RNA and histone 4 acetylated at lysine 16. (Left) DAPI-stained nuclei. (Second panel from left, green) RNA FISH showing the accumulation of MHM RNA near the MHM locus in females only. (Third panel from left, red) The accumulation of H4K16Ac at the same location. (B) The H4K16Ac staining of zebra finch cells does not have any specific pattern of signal accumulation. DNA was DAPI-counterstained. The signal strength of H4K16Ac staining in chicken (A) and zebra finch (B) is not comparable; the H4K16Ac signal in zebra finch was overexposed to illustrate the absence of even weak signal.
Cross-species perspective on sexually dimorphic expression near MHM
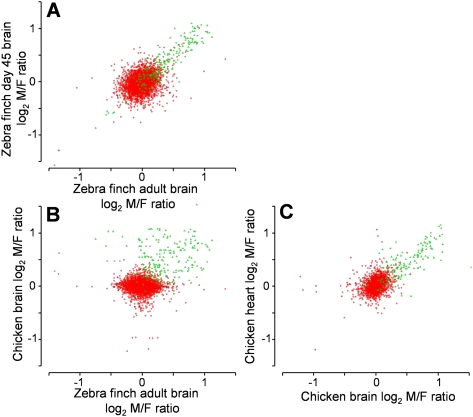
To gauge the variability of sex bias in gene expression across tissues, developmental ages, and species, we first correlated M:F ratios of expression among different tissues (brain, heart, and liver in chicken) or developmental stages (days 1, 25, 45, and adult in zebra finch) within species (Supplemental Table 4). In all comparisons within a species across tissues or ages, the M:F ratios of Z genes were well correlated. M:F ratios of A genes were poorly or not correlated across tissues in chick embryo, but were moderately correlated across age for zebra finch brain samples (Fig. 5; Supplemental Table 4). This pattern suggests that the degree of sex bias of A gene expression is altered by tissue- or age-specific factors within each species, but sex bias of Z genes is less affected by such factors. In contrast, in cross-species comparisons, the sex bias of Z gene expression was weakly correlated, and bias of A genes was uncorrelated (Fig. 5; Supplemental Table 4).
Figure 5.
Scatterplot showing M:F ratios of gene expression in zebra finch and chicken for autosomal (A) (red) and Z genes (green). M:F ratios were compared in zebra finch telencephalon in day 45 versus adult samples (A), in chicken embryonic brain versus zebra finch adult brain (B), and in chicken embryonic heart versus brain samples (C). Within species (A,C), M:F ratios were more correlated for Z genes than for A genes. Between species (B), Z gene M:F ratios were only weakly correlated, and A gene M:F ratios were uncorrelated. Correlation coefficients were: (A) Z genes, r = 0.91; A genes, r = 0.35; (B) Z genes, r = 0.16; A genes, r = 0.05; (C) Z genes, r = 0.79, A genes, r = 0.29.
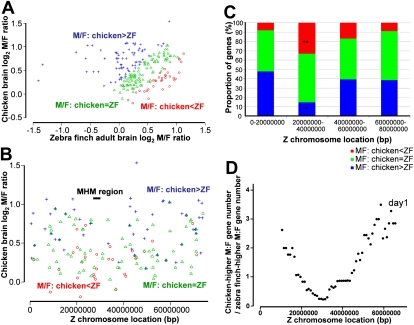
We investigated the characteristics of Z chromosome genes that differed in their sex bias across species. Z genes were separated into three groups: (1) M:F ratios chicken > zebra finch; (2) M:F ratios chicken = zebra finch; and (3) M:F ratios chicken < zebra finch. Group 2 comprises more than 85% of genes (Fig. 6A). Genes were denoted as higher or lower in chicken relative to zebra finch if their log2 M:F ratio was 0.25 more or less than that for zebra finch, respectively (Fig. 6A). Genes in these three groups were distributed nonrandomly along the chicken Z chromosome (Fig. 6B,C). Genes with C>Z M:F ratios in chicken (group 1, blue in Fig. 6) occurred more frequently than C<Z genes along most of the Z chromosome (Fig. 6B). This relationship was reversed in the region between 20 and 40 Mb (Fig. 6B,C). The plot of the ratio of the number of C>Z genes in group 1 to C<Z genes in group 3 showed a minimum near 31–32 Mb on the chicken Z chromosome (Fig. 6D), near the MHM locus at 27.9 Mb. Thus, the species difference of M:F ratios supports the idea that the MHM region of chicken is unusual in its M:F ratios.
Figure 6.
Categorizing chicken Z gene M:F ratios by their degree of difference from zebra finch. (A) Genes were categorized into group 1 with M:F ratios greater in chicken than zebra finch (C>Z, blue), group 2 with M:F ratios similar in the two species (green, >85% of genes), and group 3 with M:F ratios lower in chicken than in zebra finch (C<Z, red). Genes higher in one species were those for which the log2 M:F ratio was ≥0.25 more in that species than the other. (B) Graph of the three classes of genes by gene order along the Z chromosome of chicken. The region 20–40 Mb was abundant in red spots (C<Z) but lacking in blue spots (C>Z). (C) The proportion of the three classes of genes in four major divisions of the chicken Z chromosomes. Along most of the chromosome regions, red genes (C<Z) were less abundant than blue genes (C>Z), except for the region 20–40 Mb. When gene order was randomized 1000 times, the large difference in proportion of red and blue genes in this interval was found to occur rarely by chance (P < 0.05), whereas the difference in other chromosome regions was not unlikely. The patterns shown here are common to all 12 chicken versus zebra finch comparisons for the three chicken tissues of Itoh et al. (2007) and the four zebra finch telencephalic samples measured here. (D) The ratio of the number of blue (C>Z) to red (C<Z) genes is plotted as a moving average across a window 20 Mb wide (step size 1 Mb) graphed by window center along the Z chromosome. The curve minimum is at 31–32 Mb, near the MHM locus. Thus, the MHM region is unusual because its genes tend to have lower M:F ratios in chicken than zebra finch.
The relationship between sexual dimorphism of gene expression and dN/dS for A and Z chromosomes
We asked if sexually biased Z genes differed from others in their rate of evolution, based on dN/dS values estimated between chicken–zebra finch gene pairs (http://www.ensembl.org/biomart/index.html) (Supplemental Table 5). At all four ages in zebra finch, the median dN/dS values of Z chromosome genes were higher in male-biased gene groups (0.119–0.134 for P < 0.05, 0.120–0.142 for FDR < 0.1) than in the unbiased group (0.095–0.115 for P < 0.05, 0.097–0.115 for FDR < 0.1). Similarly in chicken samples (brain, heart, and liver), the dN/dS values are always higher in biased genes than unbiased genes (Supplemental Table 5). Thus the median dN/dS values of male-biased Z chromosome genes are consistently higher than unbiased genes in both chicken and zebra finch (binomial test: P = 0.0078) using either criteria for classifying biased versus unbiased. On the other hand, the median dN/dS values of A genes were consistently lower than that of Z genes in both species (Supplemental Table 5; Mank et al. 2007). The results suggest that male-biased Z genes have evolved more rapidly than unbiased Z genes or A genes.
Discussion
Our global analysis of zebra finch gene expression confirms, in a second avian species, a pattern of ineffective Z chromosome dosage compensation, comparable to that previously reported for chicken (Ellegren et al. 2007; Itoh et al. 2007). The distribution of M:F ratios of Z and A genes is comparable across species, tissues, and ages. Although most Z genes have higher expression in males than females, some Z genes are expressed at similar levels in the two sexes, indicating that some compensatory process operates on those genes. Thus, even if there are species differences in putative compensation mechanisms, the overall pattern of ineffective dosage compensation is similar in the two species.
The two species show some important differences. The sex bias (M:F ratio) of A genes was uncorrelated in the two species, indicating that different sets of A genes were sex-biased in zebra finch and chicken. Although the poor correlation probably stems in part from differences in tissue type or age, there also seems to be a general lack of correlation attributed to the species difference itself. For Z chromosome genes, however, the M:F ratios were weakly correlated across species. Thus, although the forces that regulate sex bias of Z genes were weakly conserved in the two species, they were not conserved for A genes. This result also suggests that the forces regulating sex bias of Z and A genes are somewhat different, even though Z and A genes interact with each other in the same gene networks. The correlation of M:F ratios among Z genes means that the degree of compensation among Z genes is somewhat conserved (Fig. 5; Supplemental Table 4). One conservative force may be that similar sets of Z genes in the two species are particularly dosage-sensitive because of their common functions in gene networks, and, thus, are under common selection pressure to reduce sex bias in expression. Therefore, the data are compatible with the idea that dosage compensation has evolved for genes with the greatest dosage sensitivity, in which an inherent sex bias would be deleterious in at least one sex.
Another important difference between species is that the zebra finch Z chromosome appears not to contain the MHM locus found in chicken and lacks specialized properties of the near-MHM region including chromatin modifications and a dearth of genes with high M:F ratios. Thus, if MHM ncRNA plays a role in dosage compensation in chickens, that mechanism appears not to be a general property of birds.
Why might there be regional dosage compensation only in chicken, but not zebra finch? Besides the difference in presence of MHM in the genome, the two species differ in the relative positions of Z genes along the chromosome, because the Z chromosome has experienced inversion and other rearrangements since the divergence of the two lineages (Itoh et al. 2006; Nanda et al. 2008). Another potential difference is in the composition of the W chromosomes. For example, zebra finches, but not chickens, have a remnant of the FEM1C (fem-1 homolog c [C. elegans] gene on the W chromosome) (Itoh et al. 2009). Considering these differences, the rearrangement of the Z chromosome may have changed the architecture of the chromosome sufficiently to undermine the selection pressures favoring an MHM-mediated compensatory mechanism. Alternatively, a different set of Z genes in zebra finches may possess paralogous W genes, which could alter selection pressures for compensation of Z genes. Resolution of these questions requires more information about both the Z and W chromosomes.
The sequencing of the zebra finch genome provides important perspective on the pattern of sex bias along the chicken Z chromosome. Using the species difference in M:F ratio as metric, we find that the region near MHM in chicken has a disproportionate number of genes for which the M:F ratio is lower in chicken than in zebra finch. This species difference supports the previous inference, based solely on expression patterns in chickens, that the MHM region is unusual.
The amount of sex bias, measured by the number of sexually dimorphic genes, reached its maximum at day 25 in zebra finch telencephalon. Thus, adults seem not to be more sexually dimorphic than juveniles at day 25. The number of Z genes showing sex bias was relatively constant across ages, suggesting that the factors controlling sex bias in Z gene expression differ from those controlling A gene sex bias. Perhaps the sex difference in copy number of Z genes, which operates at all ages, tends to make the sex bias in Z genes less variable across ages.
In zebra finches, male-biased Z genes were expressed at a higher level than A genes. That suggests that copy number is not the only factor contributing to sex bias and that male-biased Z genes are up-regulated in males rather than just being passively higher because of copy number. Sexually unbiased Z genes tended to have lower expression in males (relative to male-biased Z genes) and higher expression in females (relative to male-biased Z genes), suggesting that male bias of Z genes is the result of both up-regulation of Z genes in males and down-regulation in females. These patterns differ somewhat from the patterns found in chicken, in which unbiased Z genes were expressed at a lower level than both autosomal and biased Z genes in both sexes, and male-biased genes were expressed at higher levels relative to unbiased genes in both sexes (Supplemental Fig. 2). These differences might reflect differences in the mechanisms of dosage compensation and sex bias in the two species.
In general, zebra finch and chicken share a generally inefficient pattern of Z chromosome dosage compensation in which some genes are compensated by some mechanism. On the other hand, regional dosage compensation, possibly caused by MHM, occurs in chicken but not in zebra finch. Thus, an additional (nonregional) dosage compensation mechanism may be common to both species, possibly the result of network regulatory influences that are gene-specific (Birchler et al. 2006; Arnold et al. 2008).
Methods
Data analysis
The microarray data for zebra finch are from Tomaszycki et al. (2009) (GEO accession no. GSE20035) and for chicken are from Itoh et al. (2007) (GEO accession nos. GSE6843, GSE6844, GSE6856). Statistical analyses, including FDRs (Benjamini and Hochberg 1995), were performed in R. dN/dS values were obtained from Ensembl (http://www.ensembl.org).
To calculate whether the distribution of M:F ratios along the Z chromosome was random, we used the method of Melamed and Arnold (2007). We calculated Clow, the longest run of consecutive positions of the running average curves in Figure 2B and Supplemental Figure 3 that stayed below the 40th percentile of Z gene M:F ratios; and Chigh, the longest run of consecutive positions that stayed above the 60th percentile. We then shuffled the M:F ratios of Z genes randomly 1000 times, calculating Clow and Chigh each time (using Resampling Stats; http://www.resample.com), to determine if either run was unlikely by chance. For all ages, none of the observed runs was unlikely (P > 0.15).
See Supplemental Methods for sample collection, RNA isolation, Zebra finch microarray, immunostaining, and fluorescent in situ hybridization (FISH).
Acknowledgments
This study was supported by NIH grant DC00217 (A.P.A.), NIH grant MH55488 (J.W.), a Yamada Science Foundation grant (Y.I.), and the Songbird Neurogenomics Initiative (NIH RO1 NS045264). We thank Mika Teranishi for sharing the DNA clones, and Grace Xiao and Esther Melamed for helpful discussions. We also thank the Genome Center, Washington University School of Medicine (specifically the International Zebra Finch Genome Sequencing Consortium) for making the Taenlopygia guttata genome sequence available prior to publication.
Footnotes
[Supplemental material is available online at http://www.genome.org.]
Article published online before print. Article and publication date are at http://www.genome.org/cgi/doi/10.1101/gr.102343.109.
References
- Arnold AP, Itoh Y, Melamed E. A bird's-eye view of sex chromosome dosage compensation. Annu Rev Genomics Hum Genet. 2008;9:109–127. doi: 10.1146/annurev.genom.9.081307.164220. [DOI] [PubMed] [Google Scholar]
- Baverstock PR, Adams M, Polkinghorne RW, Gelder M. A sexlinked enzyme in birds-Z-chromosome conservation but no dosage compensation. Nature. 1982;296:763–766. doi: 10.1038/296763a0. [DOI] [PubMed] [Google Scholar]
- Benjamini Y, Hochberg Y. Controlling the false discovery rate: A practical and powerful approach to multiple testing. J R Stat Soc Ser B Methodol. 1995;57:289–300. [Google Scholar]
- Birchler JA, Fernandez HR, Kavi HH. Commonalities in compensation. BioEssays. 2006;28:565–568. doi: 10.1002/bies.20408. [DOI] [PubMed] [Google Scholar]
- Bisoni L, Batlle-Morera L, Bird AP, Suzuki M, McQueen HA. Female-specific hyperacetylation of histone H4 in the chicken Z chromosome. Chromosome Res. 2005;13:205–214. doi: 10.1007/s10577-005-1505-4. [DOI] [PubMed] [Google Scholar]
- Chang SC, Tucker T, Thorogood NP, Brown CJ. Mechanisms of X-chromosome inactivation. Front Biosci. 2006;11:852–866. doi: 10.2741/1842. [DOI] [PubMed] [Google Scholar]
- Ellegren H, Hultin-Rosenberg L, Brunström B, Dencker L, Kultima K, Scholz B. Faced with inequality: Chicken do not have a general dosage compensation of sex-linked genes. BMC Biol. 2007;5:40. doi: 10.1186/1741-7007-5-40. [DOI] [PMC free article] [PubMed] [Google Scholar]
- Itoh Y, Arnold AP. Chromosomal polymorphism and comparative painting analysis in the zebra finch. Chromosome Res. 2005;13:47–56. doi: 10.1007/s10577-005-6602-x. [DOI] [PubMed] [Google Scholar]
- Itoh Y, Kampf K, Arnold AP. Comparison of the chicken and zebra finch Z chromosomes shows evolutionary rearrangements. Chromosome Res. 2006;14:805–815. doi: 10.1007/s10577-006-1082-1. [DOI] [PubMed] [Google Scholar]
- Itoh Y, Melamed E, Yang X, Kampf K, Wang S, Yehya N, Van Nas A, Replogle K, Band MR, Clayton DF, et al. Dosage compensation is less effective in birds than in mammals. J Biol. 2007;6:2. doi: 10.1186/jbiol53. [DOI] [PMC free article] [PubMed] [Google Scholar]
- Itoh Y, Kampf K, Arnold AP. Disruption of FEM1C-W gene in zebra finch: Evolutionary insights on avian ZW genes. Chromosoma. 2009;118:323–334. doi: 10.1007/s00412-008-0199-8. [DOI] [PubMed] [Google Scholar]
- Kuroda Y, Arai N, Arita M, Teranishi M, Hori T, Harata M, Mizuno S. Absence of Z-chromosome inactivation for five genes in male chickens. Chromosome Res. 2001;9:457–468. doi: 10.1023/a:1011672227256. [DOI] [PubMed] [Google Scholar]
- Kuroiwa A, Yokomine T, Sasaki H, Tsudzuki M, Tanaka K, Namikawa T, Matsuda Y. Biallelic expression of Z-linked genes in male chickens. Cytogenet Genome Res. 2002;99:310–314. doi: 10.1159/000071609. [DOI] [PubMed] [Google Scholar]
- Mank JE. The W, X, Y and Z of sex-chromosome dosage compensation. Trends Genet. 2009;25:226–233. doi: 10.1016/j.tig.2009.03.005. [DOI] [PMC free article] [PubMed] [Google Scholar]
- Mank JE, Ellegren H. All dosage compensation is local: Gene-by-gene regulation of sex-biased expression on the chicken Z chromosome. Heredity. 2009a;102:312–320. doi: 10.1038/hdy.2008.116. [DOI] [PubMed] [Google Scholar]
- Mank JE, Ellegren H. Sex-linkage of sexually antagonistic genes is predicted by female, but not male, effects in birds. Evolution. 2009b;63:1464–1472. doi: 10.1111/j.1558-5646.2009.00618.x. [DOI] [PubMed] [Google Scholar]
- Mank JE, Axelsson E, Ellegren H. Fast-X on the Z: Rapid evolution of sex-linked genes in birds. Genome Res. 2007;17:618–624. doi: 10.1101/gr.6031907. [DOI] [PMC free article] [PubMed] [Google Scholar]
- McQueen HA, McBride D, Miele G, Bird AP, Clinton M. Dosage compensation in birds. Curr Biol. 2001;11:253–257. doi: 10.1016/s0960-9822(01)00070-7. [DOI] [PubMed] [Google Scholar]
- Melamed E, Arnold AP. Regional differences in dosage compensation on the chicken Z chromosome. Genome Biol. 2007;8:R202. doi: 10.1186/gb-2007-8-9-r202. [DOI] [PMC free article] [PubMed] [Google Scholar]
- Melamed E, Elashoff D, Arnold AP. Evaluating dosage compensation on the chicken Z chromosome: Should effective dosage compensation eliminate sexual bias? Heredity. 2009;103:357–359. doi: 10.1038/hdy.2009.91. [DOI] [PubMed] [Google Scholar]
- Nanda I, Schlegelmilch K, Haaf T, Schartl M, Schmid M. Synteny conservation of the Z chromosome in 14 avian species (11 families) supports a role for Z dosage in avian sex determination. Cytogenet Genome Res. 2008;122:150–156. doi: 10.1159/000163092. [DOI] [PubMed] [Google Scholar]
- Nguyen DK, Disteche CM. Dosage compensation of the active X chromosome in mammals. Nat Genet. 2005;38:47–53. doi: 10.1038/ng1705. [DOI] [PubMed] [Google Scholar]
- Pigozzi MI, Solari AJ. Germ cell restriction and regular transmission of an accessory chromosome that mimics a sex body in the zebra finch, Taeniopygia guttata. Chromosome Res. 1998;6:105–113. doi: 10.1023/a:1009234912307. [DOI] [PubMed] [Google Scholar]
- Shetty S, Griffin DK, Graves JA. Comparative painting reveals strong chromosome homology over 80 million years of bird evolution. Chromosome Res. 1999;7:289–295. doi: 10.1023/a:1009278914829. [DOI] [PubMed] [Google Scholar]
- Teranishi M, Shimada Y, Hori T, Nakabayashi O, Kikuchi T, Macleod T, Pym R, Sheldon B, Solovei I, Macgregor H, et al. Transcripts of the MHM region on the chicken Z chromosome accumulate as non-coding RNA in the nucleus of female cells adjacent to the DMRT1 locus. Chromosome Res. 2001;9:147–165. doi: 10.1023/a:1009235120741. [DOI] [PubMed] [Google Scholar]
- Tomaszycki ML, Peabody C, Replogle K, Clayton DF, Tempelman RJ, Wade J. Sexual differentiation of the zebra finch song system: Potential roles for sex chromosome genes. BMC Neurosci. 2009;10:24. doi: 10.1186/1471-2202-10-24. [DOI] [PMC free article] [PubMed] [Google Scholar]
- Warren WC, Clayton DF, Ellegren H, Arnold AP, Hillier LW, Kunstner A, Searle S, White S, Vilella AJ, Fairley S, et al. The genome of the zebra finch: Special insights into vocal learning and communication. Nature. 2010 doi: 10.1038/nature08819. (in press). [DOI] [Google Scholar]
- Zha X, Xia Q, Duan J, Wang C, He N, Xiang Z. Dosage analysis of Z chromosome genes using microarray in silkworm, Bombyx mori. Insect Biochem Mol Biol. 2009;39:315–321. doi: 10.1016/j.ibmb.2008.12.003. [DOI] [PubMed] [Google Scholar]
- Zhang SO, Mathur S, Hattem G, Tassy O, Pourguie O. Sex-dimorphic gene expression and ineffective dosage compensation of Z-linked genes in gastrulating chicken embryos. BMC Genomics. 2010;11:13. doi: 10.1186/1471-2164-11-13. [DOI] [PMC free article] [PubMed] [Google Scholar]


