

Abstract
Information about the binding preferences of many transcription factors is known and characterized by a sequence binding motif. However, determining regions of the genome in which a transcription factor binds based on its motif is a challenging problem, particularly in species with large genomes, since there are often many sequences containing matches to the motif but are not bound. Several rules based on sequence conservation or location, relative to a transcription start site, have been proposed to help differentiate true binding sites from random ones. Other evidence sources may also be informative for this task. We developed a method for integrating multiple evidence sources using logistic regression classifiers. Our method works in two steps. First, we infer a score quantifying the general binding preferences of transcription factor binding at all locations based on a large set of evidence features, without using any motif specific information. Then, we combined this general binding preference score with motif information for specific transcription factors to improve prediction of regions bound by the factor. Using cross-validation and new experimental data we show that, surprisingly, the general binding preference can be highly predictive of true locations of transcription factor binding even when no binding motif is used. When combined with motif information our method outperforms previous methods for predicting locations of true binding.
A central challenge in regulatory genomics is inferring genome-wide the location of transcription factor binding. Knowledge of the regions of the genome in which each transcription factor binds leads to improved inference of the genes each transcription factor regulates. These inferred regulatory targets of transcription factors can then be combined with other data types, such as gene expression data to gain further insights into gene regulation and its dynamics at a systems level (Bar-Joseph et al. 2003; Ernst et al. 2007).
One successful approach to determining the genome-wide binding location of transcription factors is through experimental techniques based on chromatin immunoprecipitation (ChIP) followed by sequencing, either by massively parallel sequencing (ChIP-seq) or paired-end diTag sequencing (ChIP-PET), or followed by microarray hybridization (ChIP-chip) (Carroll et al. 2006; Wei et al. 2006; Yang et al. 2006; Zeller et al. 2006; Johnson et al. 2007; Lim et al. 2007; Lin et al. 2007; Robertson et al. 2007; Lupien et al. 2008; Rada-Iglesias et al. 2008). However, these experiments only provide information about the specific tissue types and conditions that are being used. In addition, for essentially all species, including human, the vast majority of transcription factors have not been profiled experimentally genome-wide. The reason for this is both due to the expense of the experiments and the requirement of an available antibody for the transcription factor. A complementary and alternative computational approach to predicting transcription factor binding is based on finding sequences in the DNA that match a characterized binding site motif for the transcription factor. Between the versions of the JASPAR and TRANSFAC databases (Matys et al. 2003; Vlieghe et al. 2006) used in this paper there are around 500 known positional weight matrices for human transcription factors curated from the literature. Additionally new high-throughput experimental techniques developed to determine sequence preferences of transcription factors, such as the protein binding microarray array (Berger et al. 2008) and a bacterial one-hybrid system (Noyes et al. 2008), are leading to the availability of sequence binding specificities for hundreds of additional transcription factors.
Despite the availability of binding specificity for transcription factors, the large size of mammalian genomes including human makes detecting regulatory sites a particular challenge as there can be many sequences in the genome, which by chance, match well with the motif that the transcription factor recognizes, but are not actually bound. Researchers have attempted to address this issue by filtering sites that did not meet certain restrictive requirements. For instance in searching for motif hits for a transcription factor, the work of Xie et al. (2005) only considered those sites within 2000 base pairs (bp) of a transcription start site and for which the site was conserved in mouse, rat, and dog. In contrast, Sinha et al. (2008) did not require evidence of conservation, but used a more restrictive requirement on the location of motif matches by only considering regions within 500 bp upstream of the transcription start site or 200 bp downstream. Both of these methods would give equal weight to any position within the region of consideration, but no weight to a site a single base out of the region. The UCSC Genome Browser provides predictions of binding sites across the entire genome requiring evidence of conservation in mouse and rat (Karolchik et al. 2008). In addition to conservation data, other high-resolution genome-wide data sets, such as DNase I hypersensitivity (Boyle et al. 2008) and histone modifications (Barski et al. 2007), have become available and can also be informative of transcription factor binding (Whitington et al. 2009). A combination of a small number of these information sources was also studied (Lahdesmaki et al. 2008). Larger sets of features were considered in the specific context of predicting additional gene targets of a transcription factor of interest when a substantial number of its gene targets are already known (Beyer et al. 2006; Chen et al. 2007), which we do not assume here. Many other methods have attempted to predict gene targets using gene expression data, either with or without sequence information (Faith et al. 2007; Ramsey et al. 2008). Our data integration method can be used by expression-based methods to further improve their prediction power. Note that unlike our method, expression based methods rely on levels that differ between tissues and conditions, and may miss genes that are bound by the TF in other conditions. Methods that rely on expression data are prone to incorrectly attribute indirect regulation as direct regulation. In addition, these methods can only predict binding regions that are in close proximity to genes, whereas our method is applied genome-wide. In the complementary problem of motif discovery, positional priors on the location of binding sites based on single sources have also been demonstrated to be effective in improving discovery (Narlikar et al. 2006; Narlikar et al. 2007).
With the growing number of evidence sources for transcription factor binding, methods for integrating these diverse data sources can further improve the prediction of transcription factor binding. In this paper, we present a method that first constructs a score on transcription factor binding at each base in the human genome based on general properties of the location (e.g., distance to nearest transcription start site, conservation, levels of histone modifications, etc.) that are not specific to any one transcription factor, which we term the general binding preference (GBP). As we show, the GBP can be highly predictive of true regions of transcription factor binding, compared to randomly selected regions, even when no binding motif is used. Next, we combine the GBP score with motif information to improve predictions of regions bound by a specific transcription factor. We evaluated our predictions using both, cross-validation and predictions from an independent set of new E2F ChIP-chip experiments, which we carried out. Our results indicate that by combining data from a large set of features we can improve prediction of transcription factor binding over methods that consider a more limited set of evidence features.
Results
We developed a computational method for combining a large number of genome-wide data sets that may be informative of transcription factor binding. Our method works in two steps. First, we compute the GBP, which represents a probability for the binding of any transcription factor (TF) at each base. Next, for a specific TF, we combine the GBP with the position weight matrix (PWM) for the TF and use the combined score to identify genomic regions that are likely to be bound by that TF and genes near these regions. Our GBP score was derived based on the values of a set of 29 features (Table 1) and reported binding sites from 14 publicly available full human genome-wide ChIP-chip, ChIP-seq, or ChIP-PET data sets (Table 2). For each genome-wide binding set we train a logistic regression classifier, using all the listed features, to distinguish between the nucleotide base in the center of the reported bound region and a randomly selected base. We then combine the results from the multiple training data sets and use the average probability as the GBP for that base (see Methods). The GBP is not specific to any one transcription factor. To score a site for a particular TF we combine the PWM score and the GBP. To score a region we evaluated two strategies. In one strategy we use the maximum site score in the region (maxMOTIF×GBP), while the other uses the average site score across the region (avgMOTIF×GBP) (see Methods).
Table 1.
The 29 features that were used to compute a GBP probability of transcription factor binding at specific locations

Table 2.
Table of full genome location data sets

Full genome-wide binding data sets were used. We excluded sites that did not map successfully to hg18, as well as the three mitochondria sites in Lin et al. (2007), and 43 sites on chr*\_random (meaning the site is known to be on a certain chromosome, but the location within the chromosome is not known) in O'Geen et al. (2007).
The GBP for transcription factor binding
We first provide an illustrative example of the GBP computed by our method visualized in the UCSC Genome Browser (Kent et al. 2002) as a custom track. Figure 1 presents an example of the GBP across a 250,000 base region along chromosome 20 of the human genome. Below the plot of the GBP we plot the location of RefSeq genes. In Figure 1, five of the six tallest peaks are concentrated around RefSeq transcription start sites, for the genes: TGIF2, SLA2, NDRG3, DSN1, and C20orf24. There is a smaller peak around the transcription start site for the only other RefSeq gene in the region, MYL9. In Figure 1 (bottom) we show a zoomed-in view of a 6000-bp region around the gene C20orf24, circled with the label 1 in Figure 1 (top). For C20orf24 we note that the GBP drops at the two exons of the gene as compared to the immediate surrounding bases. While promoter regions are often identified as likely locations to contain binding, other locations can also score high. As can be seen in Figure 1 (top), there is a peak, circled with the label 2, that does not correspond to the transcription start site of a RefSeq gene; however, there is other evidence supporting this location as containing a potential transcription factor binding site, such as being a DNase I hypersensitive region in the experiments of Boyle et al. (2008).
Figure 1.

Illustrative examples of the GBP of transcription factor binding. The GBP viewed using a custom track of the UCSC Genome Browser (Kent et al. 2002). (Top) A 250,000-bp region of chromosome 20 shows the GBP for transcription factor binding. Gene locations are displayed below the plot of the GBP. Most of the peaks in this image correspond to a RefSeq transcription start site. The peak in the oval labeled with a 2 does not, but is a DNase I hypersensitive region (Boyle et al. 2008). (Bottom) A zoomed in view of the peak in the oval labeled with a 1 from the top panel that is near the transcription start site of C20orf24. The exons of C20orf24 have lower probability than its immediate surrounding bases.
In Table 3, we report a genome-wide analysis detailing where, relative to annotated RefSeq transcription start sites, bases that are given a high GBP score fall. As can be seen, the GBP score increases as we get closer to a transcription site (see also Supplemental Fig. 1, top). However, there are still a substantial proportion of relatively high scoring bases (e.g., 14.7% at a 0.20 threshold) that are not within 10 kb of any annotated transcription start sites. Many of these could potentially be enhancers or novel promoters. In the last column in Table 3 we report the percentage of bases above each threshold that fell in a DNase I hypersensitive site (also see Supplemental Fig. 1, bottom). Thus, by integrating evidence sources the method identifies locations that are away from known transcription start sites.
Table 3.
Genomic distribution of GBP sites above certain thresholds

aThe percentage of the genome that is occupied with bases reaching this GBP score.
bThe percentage of bases that are within 0.5, 1, 2, 5, and 10 kb from a RefSeq transcription start site (TSS) among those that are at or above the GBP threshold score of the row.
cThe percentage of bases in a reported DNase I hypersensitive region (Boyle et al. 2008) among those that are at or above the GBP threshold of the row. The GBP was set so that a location on average would be expected to have a value of 0.02.
Cross-validation analysis demonstrates advantage of integrating evidence sources
Before combining the GBP with the PWM score, we tested how well it could differentiate between a base in a center of a region reported to be bound by a transcription factor and, as a negative data set, randomly selected bases. We evaluated our method on the 14 data sets listed in Table 2. When evaluating a data set we would hold out that data set from training, along with any data set for the same transcription factor or data sets that were published in the same paper as the data set being evaluated. We note that this cross-validation procedure is measuring a method's ability to generalize to an unseen transcription factor, as opposed to simply unseen data for the same transcription factor.
In Figure 2, we plot the receiver operator characteristic (ROC) curves in dashed lines for each of the 14 test cases of the GBP. Sites with the same feature value were randomly ordered on the curve. An ROC curve shows the false-positive rate, number of false-positive predictions over total number of negatives along the x-axis and the true-positive rate, number of correctly predicted positives over total number of positives along the y-axis, as the threshold varies for declaring a prediction to be a real site. A perfect ROC curve would be a horizontal line at y = 1. The ROC curve expected from random guessing is the diagonal y = x line shown with a solid line. For comparison we also show the ROC curve for one of the histone modification features, and plot the false- and true-positive rate of the 3′ untranslated region (UTR) feature. We selected these two individual features to plot since globally they were among the most and least informative individual features, respectfully. In Supplemental Figure 2, we show ROC plots including all features.
Figure 2.

The ability of the GBP to differentiate between reported bound sites and random sites. ROC curves for a number of different methods for predicting bound locations. (X-axis) False-positive rate; (y-axis) true-positive rate. Results of predictions made by our method using cross-validation analysis for this factor (dashed line); expected performance of a random guess (solid line). Also plotted are the ROC curve for a feature based on histone modifications (dotted line) and a point for the 3′ UTR feature. These were selected since they achieved the highest and lowest average AUC values, respectively. An extended version of this plot with additional features can be found in Supplemental Figure 2.
A common metric to summarize an ROC curve is the area under the curve (AUC) value. A perfect AUC value is 1, while an AUC value of 0.5 is expected from random guessing. In general the AUC value on a random sample of a full data set is an unbiased estimate of its value on the full data set. In Supplemental Table 1, we show the AUC for predicting the targets in each data set using our method, and the AUC values that could be obtained by each feature individually. For 13 of the 14 data sets, the AUC value for our method was the highest (the exception being for TP53; see Discussion) demonstrating the benefit of integrating the various features we considered.
Figure 3 presents the average AUC value across all 14 data sets, for each feature and for our method (using the cross-validation score). Our method had the highest average AUC value of 0.78, with the next highest average AUC values for the two features containing information on histone modifications (0.71). The difference in AUC values between our method and the histone modification features was statistically significant (P-value < 0.001 based on a Wilcoxon signed-rank test).
Figure 3.

Comparison of average AUC values for our GBP and individual features. This graph compares the average AUC value obtained across all 14 data sets and to the cross-validation AUC value when combining the features together using our method. The graph shows the highest average AUC value obtained when combining all features using our method. The individual values that were used to compute these averages can be found in Supplemental Table 1.
The above analysis focused on how informative a single feature could be relative to integrating them all. We also conducted an analysis where we divided the features into five groups: Conservation, CG content related features, repeat element, RefSeq based annotations, and experimental features (Supplemental Table 2). We repeated the same cross-validation training and evaluation procedure as when considering all the features. For all five sets the average AUC value ranged between 0.75 and 0.77, with the low of 0.75 occurring for the experimental set of features, though this was still higher than that achieved based on any single feature. We also compared with replacing the experimental features that were based on CD4+T cells with features defined based on a separate set of three histone modifications in human embryonic stem (ES) cells (Ku et al. 2008). This led to a lower AUC value of 0.76 (Supplemental Table 2).
Combining the GBP with motif information improves the prediction of bound regions
Cross-validation analysis indicates combining motif scores with the GBP score improves predictions of bound regions
Next, we used our combined GBP and motif scores to predict binding events for a specific TF (see Methods). Our first analysis focused on evaluating whether the method could predict which RefSeq transcription start sites (TSSs) would have the center of a reported bound interval within 10 kb. We evaluated, using cross-validation with the data sets listed in Table 2, using the same procedure as above, where we would hold out the entire TF binding set and any data set for the same TF or data set published in the same paper. We excluded the TRIM28 data set from our evaluation since it is a corepressor and does not have a motif itself. Supplemental Table 3 lists the motifs from the TRANSFAC databases we used to compute the PWM score.
We compared the maxMOTIF×GBP and avgMOTIF×GBP methods to methods that just used the maximum motif score (maxMOTIF), the average motif score (avgMOTIF), and the maximum and average GBP score (maxGBP and avgGBP). Methods that score promoter regions for a motif based on the maximum or average motif score have been suggested previously (Frith et al. 2004; Hertzberg et al. 2005), and here we extend them to include the GBP score. We compare methods based on ROC curves (Supplemental Fig. 3) and AUC values (Fig. 4; Supplemental Table 4).
Figure 4.

Comparison of AUC values for predicting if a transcription factor binding site lies within 10,000 bases of a RefSeq transcription start site. Shown are the AUC values for the ROC curves in Supplemental Figure 3. The leftmost bars plot the average over all data sets. As can be seen, by combining the GBP with the motif scanning score, we improve the prediction of regions bound by specific transcription factors.
As can be seen, on average, the AUC with either the maxMOTIF×GBP or avgMOTIF×GBP method is greater than the maxMOTIF, avgMOTIF, avgGBP, and maxGBP methods. The difference between the avgMOTIF×GBP and avgMOTIF method is significant (P < 0.002, based on a Wilcoxon sign-ranked test). The maxMOTIF×GBP and avgMOTIF×GBP gave very similar results.
We repeated the analysis for windows of 2 kb and 5 kb and for first-, second-, and third-order global background models and a zero-order local background model estimated based on the interval scanned and in all cases found on average maxMOTIFxGBP and avgMOTIF×GBP had the best AUC values (Supplemental Table 5). This conclusion also held when computing the AUC under the ROC curve limiting it to a false-positive rate of, at most, 10% (Supplemental Table 6). We also conducted evaluations where we binned the non-gapped portion of the genome into 1-kb bins and evaluated the method's ability to predict which bins contain the center of a reported bound region and again had the highest average AUC values when combining the motif and GBP scores (Supplemental Table 7). We repeated the analysis excluding bins within 2 kb, 5 kb, and 10 kb of an annotated RefSeq TSS bin and saw similar results (Supplemental Table 8).
For the evaluation on predicting binding within 10-kb intervals around the TSS, we also, in Supplemental Figure 3, compare with ranking each region based on the highest scoring site on the UCSC TFBS conserved track for each of the transcription factors we looked at (Karolchik et al. 2008). The UCSC TFBS conserved track identifies motifs that are conserved across human, mouse, and rat and scores these sites based on the motif match. In all cases the ROC curves obtained by the maxMOTIF×GBP or avgMOTIF×GBP scores improved upon the UCSC track. In some cases including MYC, REST, and TP53 the predictions based on the UCSC TFBS conserved track were substantially below those of our method. This suggests that some bound sites for these factors in human can be predicted relatively accurately, despite not showing a conserved motif instance based on mouse and rat. We also tried an evaluation where instead of the GBP we used the probability a base is predicted to not be occupied by a nucleosome (Kaplan et al. 2009), but this did not improve over just using motif information (Supplemental Tables 4, 5).
Evaluation on independent E2F promoter ChIP-chip data
To test our method on a new data set we carried out new ChIP-chip experiments for E2F factors. These included 13 E2F experiments, seven for E2F4 and six for E2F2, using a primarily core promoter array. We have also evaluated our method on another set of 30 experiments previously published for E2F1, E2F4, and E2F6 (Xu et al. 2007). The task was to predict those spots on the array that would be declared bound (see Methods). For both these sets, we computed the AUC values for the methods we compared above. Figure 5 and Supplemental Table 9 present the results of this comparison for our new E2F data set. Supplemental Figure 4 and Supplemental Table 10 present the results for the experiments of Xu et al. (2007). Both sets of experiments clearly demonstrate that combining our GBP score with a motif score improves predictions when compared to other methods. A GO analysis of our top 1000 predicted targets revealed a significant enrichment for cell cycle genes (P-value < 4 × 10⁻¹²; 2.3-fold) and related GO categories. Cell cycle genes were also significantly enriched across all E2F factors profiled both in this study and in Xu et al. (2007) (see Supplemental Table 11).
Figure 5.

Results at predicting targets for E2F2 and E2F4 using new ChIP-chip experiments. The chart shows a comparison of five methods for the task of predicting gene targets of the E2F family of transcription factors based on 13 different ChIP-chip experiments. For each method, an AUC value was computed for each of the 13 experiments. The experiments were ordered in descending order of the average AUC value across the five methods considered. The x-axis shows the position in this ordering, and the y-axis shows the AUC value corresponding to the position. The plot shows that the methods that jointly use the GBP and motif have a higher AUC value at each rank position, when compared to methods that use only the GBP or only the motif information. The experiments these correspond to can be found in Supplemental Table 9.
Over the 13 new experiments we conducted, there was a set of 169 genes that were bound in at least nine of them. We have also observed that our method correlated well with the number of experiments in which a gene was identified as an E2F target. Specifically, as Supplemental Table 12 shows, the performance of our method improved for sets of genes bound in multiple experiments. In the set of 169 genes bound in nine or more experiments, 72 of them were predicted in the top 10% of predictions based on the maxMOTIF×GBP method. This set of genes, which is consistently bound in different cell cycle phases and by different E2F members, represents the core of the E2F target genes. As expected, this core set of E2F targets was highly enriched for cell cycle related categories (e.g., cell cycle P-value = 0.014) even when compared to the ∼1500 genes bound by E2F in any of the experiments we performed. The list of genes in the overlap of nine or more experiments and in the top 10% of our predictions includes many of the key genes involved in the cellular processes occurring during the transition from G1 to S. For example, the core E2F targets include 10 genes encoding histones, 12 genes involved in DNA replication and repair (CDC6, EXO1, CLSPN, POLA1, PCNA, MLH1, MCM3, ORC3L, TIMELESS, MSH2, BLM, and FANCD2), and two genes involved in the control of G1/S transition (CDC25A and RBL1). We also found three genes involved in the G2/M stage of the cell cycle (SMC3, NDC80, and CDC23), supporting a previous observation that the E2F proteins are involved in the regulation of this cell cycle stage as well (Ren et al. 2002).
Discussion
We developed a two-step approach for predicting targets of TFs on a genome-wide scale. Our method leverages recent genome-wide data sets to learn a general binding preference on transcription factor binding and then combines this GBP with PWMs to predict targets of specific TFs. We showed that by integrating a variety of data sources our method could more accurately identify locations in the genome bound by a transcription factor than any one data source we consider or by only using the PWM score. Predictions from our method, both the GBP of each base in the genome for transcription factor binding, and gene target predictions of TFs are available on our website, http://www.sb.cs.cmu.edu/humanTF.
Using a GBP for TF binding prediction
A surprising result was how effective the GBP alone, without any motif information, could be at predicting which promoter regions would be bound by the transcription factors we looked at. In other words, genes that were ranked higher using our GBP score were more likely to be bound by any of the TFs we looked at, including the targets of our new E2F experiments. One possible explanation for this is that values for some of the features may indicate that a nearby gene is likely to be transcriptionally active (e.g., hypersensitivity and histone modification features), and that transcriptionally active genes are more likely to have transcription factors binding in their promoter region. Another intriguing related possibility is that some genes can be activated by a very large number of factors. Looking at the genes that scored highly when using only our GBP among all RefSeq genes, the most enriched molecular functions were transcription regulator activity (P-value = 3 × 10⁻²⁸), and the most enriched biological processes were transcription from RNA polymerase II promoter (P-value = 2 × 10⁻¹⁸) and regulation of metabolic process (P-value = 2 × 10⁻¹⁶). Thus, these may represent a subset of genes required under a wide range of conditions and in many different tissue types (also known as “housekeeping genes”). A possible way to explain the fact that these genes are always “on” is that many different factors can activate them, and so, for any specific condition or tissue, there are factors that are expressed in that condition and activate this set of genes. Consistent with this we see that intervals around the TSS that were bound in more of the genome-wide experiments had a higher average GBP score (Supplemental Fig. 5).
The TP53 data set was an outlier in that no feature could achieve an AUC value above 0.61, and the GBP score achieved an AUC of only 0.56. The TP53 data set had the smallest number of detected bound regions from any of the 14 experiments, so it is possible that there still are many TP53 binding sites receiving high GBP scores that were either not detected as bound or not bound in the condition considered. A previous analysis of the bound TP53 binding sites detected in this experiment found an enrichment for TP53 sites in endogenous retrovirus (ERV) retroelements, and suggested using these elements as a mechanism by which TP53 was able to propagate its binding sites (Wang et al. 2007). As ERVs are specific to the primate lineage and selected against being near genes (Wang et al. 2007), this could also explain why some of the features we consider are less predictive of TP53 binding sites than for other transcription factors we consider.
Of the features we considered, the most informative single feature based on the AUC was the total histone modification levels (Barski et al. 2007). Specific histone modifications are known to be correlated with promoters and enhancers (Barski et al. 2007) and, thus, regions of likely transcription factor binding. Despite being determined in one specific cell type for which none of the transcription factor binding data were measured, CD4+T, the analysis in this paper shows that at least the feature based on an aggregation of histone modification levels is still highly informative across cell types. Another informative feature was DNase I hypersensitive locations. Supplemental Figure 1 shows that at the lowest false-positive rates, the DNase I hypersensitive locations in a number of cases had a true-positive rate that was better than the histone modification features. This supports the observation that experimentally derived data in one cell type can be used to predict transcription factor binding in another cell type. As DNase I hypersensitivity and histone modification data are collected in more cell types it will be interesting to see to what extent predictions can be improved even further with this additional data. It will also be interesting to see to what extent predictions can be improved even further by bringing in additional data sets, such as a recent experimental genome-wide data set on nucleosome positioning (Schones et al. 2008).
Combining the GBP with a PWM to predict targets of a specific TF
We evaluated the combined PWM and GBP score using cross-validation and also using new ChIP-chip experiments focusing on E2F factors. We showed that by combining the motif score with the GBP score we could outperform just using the PWM score or just using the GBP score. This method also outperformed the predictions available from the conserved TFBS track of the UCSC Genome Browser (Karolchik et al. 2008), which, similar to the approach of Xie et al. (2005), required conservation of the motif instance. We have also compared our method with predictions in the PREM database based on the method of (Blanchette et al. 2006). As can be seen in Supplemental Tables 13 and 14, for almost all factors our method outperformed these predictions, and in some case the improvement was over 50%. We also directly compared multiplying the PWM score with the histone feature value, which on average gave lower scores (Supplemental Table 15), but we note that for the TFs that have highly informative motifs, such as TP53 and REST, the PWM scores dominate leading to similar predictions for both methods.
While our method achieved high AUC values indicating the significance of the results, there are still many sites identified in high throughput experiments that are missed by our method (Supplemental Table 16). We believe that our results are most useful for identifying core targets of TFs and for methods, such as DREM, that integrate protein–DNA interaction data with other high throughput data sets (Ernst et al. 2007).
The lowest AUC values we reported in Figure 4 were for the two TP63 data sets. As the motif found using the de novo motif discovery method for targets identified in the TP63 genome-wide ChIP-chip data (Yang et al. 2006) only weakly resembles the TRANSFAC motif, these results are not too surprising. Other papers have also reported improvements over the canonical motif for various transcription factors using de-novo motif discovery on the bound locations (Wei et al. 2006; Johnson et al. 2007; Xu et al. 2007). It will be interesting to see if the performance improves when using new experimentally determined motifs (Berger et al. 2008; Noyes et al. 2008) as opposed to the curated TRANSFAC and JASPAR motifs. We note however there are motifs, such as for STAT1, that enrich directly under the peaks of binding sites (Robertson et al. 2007), but still may not be informative enough to significantly improve predictions of binding in wider regions as compared to the GBP alone.
The focus of our evaluation in this paper was on the rankings produced by the various methods considering each transcription factor separately. It will also be interesting to explore the extent to which we can predict how many sites a transcription factor binds. For instance one approach would be to look for sites that have significantly higher scores than would be expected to be observed when randomizing columns of the PWM. However, to effectively evaluate these types of approaches we will need data for more transcription factors collected under more consistent procedures.
This paper presents a method to improve the inference of transcription factor binding across the human genome and for associating transcription factors with genes based on genomic properties. Our complete ranked predictions for 512 human PWMs are available on the supporting website and can be used, as discussed in the introduction, for generating new hypotheses regarding regulatory networks. As more data becomes available, the predictions the method makes should be expected to improve further. Such predictions, when combined with other data sources such as time series gene expression data, have the potential to lead to important insights into transcription factors controlling specific regulatory responses in human cells.
Methods
Training data sets
We collected the genome coordinates of regions containing binding sites for transcription factors for 14 publicly available human genome-wide ChIP-chip, ChIP-seq, or ChIP-PET data sets (Table 2). One of the data sets is for TRIM28, which is a corepressor (O'Geen et al. 2007) that itself does not bind DNA, but instead binds to transcription factors that bind the DNA. However, the location of TRIM28 binding is still informative of the location of transcription factor binding. Table 2 reports the number of target sites identified in each data set based on what the authors of the paper reported. If sites were given in hg17 coordinates they were first mapped to hg18 using the default settings of the UCSC Genome Browser lift over tool (Kent et al. 2002).
As can be seen in Table 2 the number of declared target sites of a transcription factor can vary considerably. This can both be due to the different binding activity of the transcription factor, but also because of differences in the sensitivity of different technologies, or differences in the use of the same technology.
Genomic features for prediction
In Table 1 we list the 29 features we used to learn a GBP on transcription factor binding. Before using the feature values with the logistic regression classifier the feature values were standardized. Standardization of feature values was done by subtracting the mean of the feature and then dividing by its standard deviation.
The first 11 features are all related to conservation and computed based on data obtained from the UCSC Genome Browser site (Karolchik et al. 2008). Features 1 and 2 are the PhastCons conservation (Siepel et al. 2005) score based on alignment of 28 vertebrate species and an 18 species placental mammal subset, respectively (Miller et al. 2007). The PhastCons method is based on a two-state Phloygenetic-HMM (Siepel et al. 2005), and the score represents the posterior probability that the hidden state is the conserved state at that base. For about 2% of bases no PhastCons score was available, and in these cases we set the probability to 0. We note that about 40% of bases have a PhastCons score of 0 in the provided files, with the next largest value 0.001. Since there might be a significant difference between PhastCons values of 0 and those slightly greater than 0, we added three features related to PhastCons scores of 0. Features 3 and 4 are binary features indicating if the PhastCons score was available and 0, for the vertebrate and placental mammal alignments, respectively. Feature 5 was a binary feature indicating if the PhastCons score was not available and thus set to 0, which was always the same for both the vertebrate and the placental mammal subsets. The UCSC Genome Browser site also provides continuous stretches of bases that are highly conserved based on the PhastCons score (Karolchik et al. 2008). Features 6 and 7 are binary features indicating if the base fell within one of these PhastCons highly conserved elements for the vertebrate and the placental mammal subsets, respectively. Feature 8 indicates if a base is in a region identified as conserved based on a lack of indels, that is insertions or deletions of bases in sequence alignments with mouse and dog (Lunter et al. 2006). This measure does not take into account nucleotide substitutions, which drive the PhastCons scores. Features 9, 10, and 11 are the natural log of the number of bases to the nearest base that is within a PhastCons highly conserved vertebrate element, PhastCons conserved placental mammal, or indel conserved region after adding a pseudocount of 5.
Feature 12 is the estimate melting temperature to separate the two strands of DNA as computed in Liu et al. (2007). Higher melting temperatures means the DNA strands will be more stable, which is hypothesized to facilitate transcription factor binding. Feature 13 measures GC content as the percentage of bases that are a “G” or “C” among those bases that are within 50 bp of the base being considered. The melting temperature is strongly, though not perfectly, correlated with the local GC content of the region (Liu et al. 2007). Feature 14 is a binary feature indicating whether the base lies in a CpG island, as provided by the UCSC Genome Browser (Karolchik et al. 2008). CpG islands are regions of the genome that are GC rich and significantly over-represented with the dinucleotide of C followed immediately by G, and are believed to play a role in gene regulation (Gardiner-Garden and Frommer 1987).
Feature 15 indicates if the base is part of a repeat element, as provided by the UCSC Genome Browser using RepeatMasker (AFA Smith, R Hubley, and P Green, http://www.repeatmasker.org/) and Tandem Repeats Finder (Benson 1999).
Features 16–23 are based on the RefSeq (Pruitt et al. 2007) gene annotations as of June 8, 2008 downloaded from the UCSC Genome Browser site (Karolchik et al. 2008). Features 16–22 are all binary features. Features 16 and 17 indicate if a base is between a RefSeq gene start site and end site for transcription and coding, respectively. Feature 18 indicates if the base lies in a RefSeq exon. Feature 19 indicates that in addition to being in an exon the site is also in the coding region, thus excluding the portions of exons at the ends of the transcribed region that are not translated into proteins. Feature 20 indicates if the base is between the start and end of the coding sequence and not in an exon. Features 21 and 22 specify if the base lies in the transcribed regions of the DNA that are downstream and upstream of the coding sequence, respectively. Feature 23 is the natural log of the number of bases to the nearest RefSeq transcription start site after adding a pseudocount of five bases.
Feature 24 is a binary feature indicating if the base was in an experimentally determined DNase I hypersensitive region in CD4+T cells (Boyle et al. 2008). DNase I hypersensitive regions correlate with nucleosome depleted regions, which are believed to be more likely to contain transcription factor binding sites.
Features 25–29 are all based on ChIP-seq data in CD4+T cells from Barski et al. (2007). In this case, the ChIP-seq data were not determining the location of transcription factors, but were used to determine the locations of 20 different histone modifications, histone variant H2A.Z, the RNA polymerase II, and the insulator binding protein CTCF. The histone modifications in these data were all methylations and differ as to which histone of the nucleosome is targeted, which amino acid of the histone is modified, and in the quantity of methylations. We used the summary data files from the supporting website of Barski et al. (2007), which provided the number of tags within a 200-bp window for all features, except for the RNA polymerase and CTCF for which the number of bases was 400. For the RNA polymerase, CTCF, and H2A.Z we have a feature that is the natural log of the number of tags plus one. The histone modification features, 27 and 28, combine data from all 20 of the histone modifications types. Feature 27 is the natural log of the sum of the number of tags across all 20 histone modification types. Feature 28 is the sum of the natural log of the number of tags for each histone modification. We note for the same total number of histone tags, Feature 28 will be larger if the tags are distributed uniformly across all the different histone modification types, while for Feature 27 only the total number of tags matters and not how they are distributed. We chose to combine the 20 histone modification values into these two features, instead of keeping each as separate features, to prevent over fitting the condition-specific values of individual histone modifications.
Method to learn the GBP
Our method learns a function that maps a set of features measured for a location in the human genome to a GBP score that a transcription factor binds that location. In order to learn this function, the method uses as training data C data sets, each reporting regions of the genome (of size 1000 bp) within which a transcription factor is determined to bind, based on a genome-wide experiment (either ChIP-chip, ChIP-PET, or ChIP-seq).
Our method first learns independently for each of the C data sets a probabilistic classifier (see below for a discussion of training data sets). To obtain our GBP score for a specific base location, the method takes the mean of the probability obtained from each of the C classifiers. As described below, each classifier was calibrated to give the same total weight regardless of the number of binding events, thus, taking the average will preserve this weighting. We chose to use the mean, as opposed to the median, to better use information in data sets for which there might be a set of features that are strongly predictive of transcription factor binding, but for which this is the case for only a few data sets.
For each classifier we used as positive training examples a base location in the center of each genomic region reported to be bound by the transcription factor. By using the base in the center of the region we are selecting a base for which it is reasonable to expect the transcription factor will most likely bind. This expectation is reasonable as many of the regions have peaks in the experimental data in the center, which in some cases have been shown to have strong enrichment for having a motif for the transcription factor on or near the base (Johnson et al. 2007). Additionally, selecting the base in the center minimizes the maximum distance to the actually bound bases in the region. Since many of the features we use are heavily correlated among neighboring bases, for example, the distance to a transcription start site or a conserved element, the actual base selected for this function should have a limited impact on the GBP probabilities.
As a negative set we randomly sampled 49 base locations for every one positive location. The randomly selected locations were restricted to come from the nongapped regions of the human genome sequence. In each case we did a stratified random sampling so that for every one real location on a chromosome we would have 49 randomly selected locations from the same chromosome. We are thus setting a prior expectation that, on average, 2% of locations are bound by a transcription factor. As rough justification why a 2% estimate is reasonable at an approximation level we note that at least 3.5% of the human genome is believed to be under purifying selection and thus functional, but is not protein coding (Siepel et al. 2005). The 3.5% figure likely includes a substantial portion of regions of the genome that are functional for reasons other than being transcription factor binding sites. However, there are also demonstrated functional transcription factor binding sites that do not show evidence of conservation (McGaughey et al. 2008). By having all training data sets have the same proportion of positive and negative sites, the method will also be robust against a situation in which a transcription factor from one data set has a disproportionate number of called targets.
Formally, the GBP score the method gave to a single base location in the human genome, b, being bound by a transcription factor is
where fb is a vector of feature values specific to genome location b (see above for a discussion of the set of features used), and P(b|fb) is the probability a logistic regression classifier gives that a location with a set of features fb is bound by a transcription factor. Using a logistic regression classifier gives the advantage of having a well-defined probabilistic output. We used the logistic regression implementation LR-TRIRLS (Komarek and Moore 2005) that could effectively scale to some of our larger training sets containing over a million data points. We used the default settings of the software, which sets the ridge parameter to 10. If a base is in a gap portion of the genome sequence we automatically set its GBP to 0.
Method for combining the GBP with motif evidence
Given a transcription factor and its corresponding PWM we would like to identify the locations to which it would most likely bind. We define a region as a sequence containing L continuous base locations, ba,…,ba+L-1. Associated with each location is the GBP discussed in the previous section. For base bi, we also have a motif score for the site on the positive strand that begins at position bi, which we will denote m+(bi), and a motif score for the site on the negative strand that ends at base bi, which we will denote m−(bi).
For the results in this section, we represented the motif with a positional weight matrix (PWM), and the score was computed using a zero-order background model (Stormo 2000). The background nucleotide probabilities were set to their genome-wide proportion.
A pseudocount of twice its genome-wide proportion was added to each entry in the PWM. In our results the scores for m+(bi) and m_(bi) were defined as
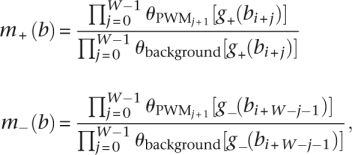 |
where g+(x) and g−(x) represent the nucleotides on the positive and negative strands at location x, respectively; θbackground(y) is the background probability of nucleotide y; and  is the probability the PWM model gives at position j of observing nucleotide y, where the PWM is indexed starting at position 1.
The motif score we associate with base bi is
For a motif of length W we defined a combined GBP and motif score at each location s(bi) as
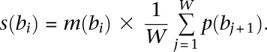 |
Here, we are averaging the GBP score over each base position of the potential binding site.
We considered two methods for scoring entire regions of length L (for example, upstream regions of specific genes). One method uses the maximum value of s(bi) in the region, while the other uses its average value. Formally, the two methods are
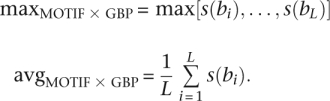 |
For comparison purposes, we also define the following strategies: maxMOTIF is the maximum motif score at any site in the region; avgMOTIF is the average motif score in the region, which has been suggested previously (Frith et al. 2004); and avgGBP and maxGBP are the average and maximum GBP scores in the region, respectively. Formally, these are written as
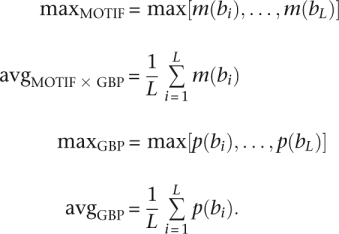 |
E2F ChIP-chip validation
In total, we conducted 13 ChIP-on-chip experiments on BJ-T cells (primary foreskin fibroblast immortalized with the TERT gene) using antibodies against E2F2 (six experiments—two in asynchronous culture, two on cells arrested at late G1, and two on cells in the S phase) and against E2F4 (seven experiments, all on asynchronous cells) meeting our quality control standards. The data are available in the ArrayExpress database under accession number E-MEXP-2169.
The immunoprecipitated DNA, along with similar amounts of input DNA, were amplified using ligation mediated PCR, labeled with Cy5 and Cy3 dyes and hybridized to an human promoter array (Hu19k) as described (Odom et al. 2004). To declare bound targets, we used a P-value threshold of 0.01, where P-values were computed based on a normalization procedure described in Ren et al. (2000). As a means of quality control, we required that a data set have at least 300 significant targets at this threshold. When scoring promoter regions for potential E2F binding, we defined the promoter region based on exactly the portion of the sequence present on array. We used the unique E2F motif in the JASPAR database that has the ID MA0024.
The previously published ChIP-chip experiments were conducted on promoter arrays with ∼1500 bases for a promoter (Xu et al. 2007). In total, the data set of Xu et al. (2007) contained 30 ChIP-chip experiments for the transcription factors E2F1, E2F4, and E2F6 in five cell types—MCF10A, HelaS3, GM06990, Ntera2, and MCF7—with two replicates for each of the 15 combinations of transcription factor and cell type. For each of the 30 ChIP-chip experiments we declared the bound targets of the transcription factor to be those with an enrichment score >1 as defined and suggested in Xu et al. (2007). For each method considered we applied it to only the portion of the genome that the probes on the microarray cover, after converting the annotated hg17 coordinates to hg18 coordinates.
UCSC Genome Browser comparison
When comparing our predictions with those of the UCSC Genome Browser TFBS conserved track, the score for the transcription factor was used as provided by the UCSC Genome Browser, so in some cases it used slightly different motifs for the transcription factor than we used. No predictions for FOXA1 and TP63 were available from the UCSC TFBS conserved track. Also some regions did not have any site reported, either because it did not meet their minimum score threshold or was not conserved, which is why its ROC curve does not reach a true-positive rate of 1. This is also why we did not include this method in the comparison in Supplemental Tables 4–8.
Acknowledgments
We thank the Broad Institute, the Human Genome Sequencing Center at the Baylor College of Medicine, the Genome Sequencing Center at Washington University, the Sanger Center, the Department of Energy's Joint Genome Institute, and the National Institute of Genetics in Japan for making the PhastCons data on the vertebrate and mammalian alignments available prepublication. We thank Peter Pong for assistance in implementing a prior version to the described method. This work was supported in part by NIH grant 1RO1 GM085022 and NSF CAREER award 0448453 (Z.B.J.) and a Siebel Scholar Fellowship (J.E.).
Footnotes
[Supplemental material is available online at http://www.genome.org.]
Article published online before print. Article and publication date are at http://www.genome.org/cgi/doi/10.1101/gr.096305.109.
References
- Bar-Joseph Z, Gerber G, Lee T, Rinaldi N, Yoo J, Robert F, Gordon B, Fraenkel E, Jaakkola T, Young R, et al. Computational discovery of gene modules and regulatory networks. Nat Biotechnol. 2003;21:1337–1342. doi: 10.1038/nbt890. [DOI] [PubMed] [Google Scholar]
- Barski A, Cuddapah S, Cui K, Roh TY, Schones DE, Wang Z, Wei G, Chepelev I, Zhao K. High-resolution profiling of histone methylations in the human genome. Cell. 2007;129:823–837. doi: 10.1016/j.cell.2007.05.009. [DOI] [PubMed] [Google Scholar]
- Benson G. Tandem repeats finder: A program to analyze DNA sequences. Nucleic Acids Res. 1999;27:573–580. doi: 10.1093/nar/27.2.573. [DOI] [PMC free article] [PubMed] [Google Scholar]
- Berger MF, Badis G, Gehrke AR, Talukder S, Philippakis AA, Pea-Castillo L, Alleyne TM, Mnaimneh S, Botvinnik OB, Chan ET, et al. Variation in homeodomain DNA binding revealed by high-resolution analysis of sequence preferences. Cell. 2008;133:1266–1276. doi: 10.1016/j.cell.2008.05.024. [DOI] [PMC free article] [PubMed] [Google Scholar]
- Beyer A, Workman C, Hollunder J, Radke D, Möller U, Wilhelm T, Ideker T. Integrated assessment and prediction of transcription factor binding. PLoS Comput Biol. 2006;2:e70. doi: 10.1371/journal.pcbi.0020070. [DOI] [PMC free article] [PubMed] [Google Scholar]
- Blanchette M, Bataille AR, Chen X, Poitras C, Laganière J, Lefèbvre C, Deblois G, Giguère V, Ferretti V, Bergeron D, et al. Genome-wide computational prediction of transcriptional regulatory modules reveals new insights into human gene expression. Genome Res. 2006;16:656–668. doi: 10.1101/gr.4866006. [DOI] [PMC free article] [PubMed] [Google Scholar]
- Boyle AP, Davis S, Shulha HP, Meltzer P, Marguiles E, Weng Z, Furey TS, Crawford GE. High-resolution mapping and characterization of open chromatin across the genome. Cell. 2008;132:311–322. doi: 10.1016/j.cell.2007.12.014. [DOI] [PMC free article] [PubMed] [Google Scholar]
- Carroll JS, Meyer CA, Song J, Li W, Geistlinger TR, Eeckhoute J, Brodsky AS, Keeton EK, Fertuck KC, Hall GF, et al. Genome-wide analysis of estrogen receptor binding sites. Nat Genet. 2006;38:1289–1297. doi: 10.1038/ng1901. [DOI] [PubMed] [Google Scholar]
- Chen Y, Blackwell TW, Chen J, Gao J, Lee AW, States DJ. Integration of genome and chromatin structure with gene expression profiles to predict c-MYC recognition site binding and function. PLoS Comput Biol. 2007;3:e63. doi: 10.1371/journal.pcbi.0030063. [DOI] [PMC free article] [PubMed] [Google Scholar]
- Ernst J, Vainas O, Harbison CT, Simon I, Bar-Joseph Z. Reconstructing dynamic regulatory maps. Mol Syst Biol. 2007;3:74. doi: 10.1038/msb4100115. [DOI] [PMC free article] [PubMed] [Google Scholar]
- Faith JJ, Hayete B, Thaden JT, Mogno I, Wierzbowski J, Cottarel G, Kasif S, Collins JJ, Gardner TS. Large-scale mapping and validation of Escherichia coli transcriptional regulation from a compendium of expression profiles. PLoS Biol. 2007;5:e8. doi: 10.1371/journal.pbio.0050008. [DOI] [PMC free article] [PubMed] [Google Scholar]
- Frith MC, Fu Y, Yu L, Chen JF, Hansen U, Weng Z. Detection of functional DNA motifs via statistical over-representation. Nucleic Acids Res. 2004;32:1372–1381. doi: 10.1093/nar/gkh299. [DOI] [PMC free article] [PubMed] [Google Scholar]
- Gardiner-Garden M, Frommer M. CpG islands in vertebrate genomes. J Mol Biol. 1987;196:261–282. doi: 10.1016/0022-2836(87)90689-9. [DOI] [PubMed] [Google Scholar]
- Hertzberg L, Zuk O, Getz G, Domany E. Finding motifs in promoter regions. J Comput Biol. 2005;12:314–330. doi: 10.1089/cmb.2005.12.314. [DOI] [PubMed] [Google Scholar]
- Johnson DS, Mortazavi A, Myers RM, Wold B. Genome-wide mapping of in vivo protein-DNA interactions. Science. 2007;316:1497–1502. doi: 10.1126/science.1141319. [DOI] [PubMed] [Google Scholar]
- Kaplan N, Moore IK, Fondufe-Mittendorf YF, Gossett AJ, Tillo D, Field Y, LeProust EM, Hughes TR, Lieb JD, Widom J, et al. The DNA-encoded nucleosome organization of a eukaryotic genome. Nature. 2009;458:362–366. doi: 10.1038/nature07667. [DOI] [PMC free article] [PubMed] [Google Scholar]
- Karolchik D, Kuhn RM, Baertsch R, Barber GP, Clawson H, Diekhans M, Giardine B, Harte RA, Hinrichs AS, Hsu F, et al. The UCSC Genome Browser Database: 2008 Update. Nucleic Acids Res. 2008;36:D773–D779. doi: 10.1093/nar/gkm966. [DOI] [PMC free article] [PubMed] [Google Scholar]
- Kent WJ, Sugnet CW, Furey TS, Roskin KM, Pringle TH, Zahler AM, Haussler D. The Human Genome Browser at UCSC. Genome Res. 2002;12:996–1006. doi: 10.1101/gr.229102. [DOI] [PMC free article] [PubMed] [Google Scholar]
- Komarek P, Moore AW. Proceedings of the Fifth IEEE International Conference on Data Mining (ICDM'05) 2005. Making logistic regression a core data mining tool with TR-IRLS; pp. 685–688. IEEE Computer Society. [Google Scholar]
- Ku M, Koche RP, Rheinbay E, Mendenhall EM, Endoh M, Mikkelsen TS, Presser A, Nusbaum C, Xie X, Chi AS, et al. Genomewide analysis of PRC1 and PRC2 occupancy identifies two classes of bivalent domains. PLoS Genet. 2008;4:e1000242. doi: 10.1371/journal.pgen.1000242. [DOI] [PMC free article] [PubMed] [Google Scholar]
- Lahdesmaki H, Rust AG, Shmulevich I. Probabilistic inference of transcription factor binding from multiple data sources. PLoS ONE. 2008;3:e1820. doi: 10.1371/journal.pone.0001820. [DOI] [PMC free article] [PubMed] [Google Scholar]
- Lim C-A, Yao F, Wong JJ-Y, George J, Xu H, Chiu KP, Sung W-K, Lipovich L, Vega VB, Chen J, et al. Genome-wide mapping of RELA(p65) binding identifies E2F1 as a transcriptional activator recruited by NF-κB upon TLR4. Mol Cell. 2007;27:622–635. doi: 10.1016/j.molcel.2007.06.038. [DOI] [PubMed] [Google Scholar]
- Lin CY, Vega VB, Thomsen JS, Zhang T, Kong SL, Xie M, Chiu KP, Lipovich L, Barnett DH, Stossi F, et al. Whole-genome cartography of estrogen receptor α binding sites. PLoS Genet. 2007;3:e87. doi: 10.1371/journal.pgen.0030087. [DOI] [PMC free article] [PubMed] [Google Scholar]
- Liu F, Tostesen E, Sundet JK, Jenssen T-K, Bock C, Jerstad GI, Thilly WG, Hovig E. The human genomic melting map. PLoS Comput Biol. 2007;3:e93. doi: 10.1371/journal.pcbi.0030093. [DOI] [PMC free article] [PubMed] [Google Scholar]
- Lunter G, Ponting CP, Hein J. Genome-wide identification of human functional DNA using a neutral indel model. PLoS Comput Biol. 2006;2:e5. doi: 10.1371/journal.pcbi.0020005. [DOI] [PMC free article] [PubMed] [Google Scholar]
- Lupien M, Eeckhoute J, Meyer CA, Wang Q, Zhang Y, Li W, Carroll JS, Liu XS, Brown M. FoxA1 translates epigenetic signatures into enhancer-driven lineage-specific transcription. Cell. 2008;132:958–970. doi: 10.1016/j.cell.2008.01.018. [DOI] [PMC free article] [PubMed] [Google Scholar]
- Matys V, Fricke E, Geffers R, Gling E, Haubrock M, Hehl R, Hornischer K, Karas D, Kel AE, Kel-Margoulis OV, et al. TRANSFAC: Transcriptional regulation, from patterns to profiles. Nucleic Acids Res. 2003;31:374–378. doi: 10.1093/nar/gkg108. [DOI] [PMC free article] [PubMed] [Google Scholar]
- McGaughey DM, Vinton RM, Huynh J. Metrics of sequence constraint overlook regulatory sequences in an exhaustive analysis at phox2b. Genome Res. 2008;18:201–205. doi: 10.1101/gr.6929408. [DOI] [PMC free article] [PubMed] [Google Scholar]
- Miller W, Rosenbloom K, Hardison RC, Hou M, Taylor J, Raney B, Burhans R, King DC, Baertsch R, Blankenberg D, et al. 28-Way vertebrate alignment and conservation track in the UCSC Genome Browser. Genome Res. 2007;17:1797–1808. doi: 10.1101/gr.6761107. [DOI] [PMC free article] [PubMed] [Google Scholar]
- Narlikar L, Gordân R, Ohler U, Hartemink A. Informative priors based on transcription factor structural class improve de novo motif discovery. Bioinformatics. 2006;22:e384–e392. doi: 10.1093/bioinformatics/btl251. [DOI] [PubMed] [Google Scholar]
- Narlikar L, Gordân R, Hartemink A. A nucleosome-guided map of transcription factor binding sites in yeast. PLoS Comput Biol. 2007;3:e215. doi: 10.1371/journal.pcbi.0030215. [DOI] [PMC free article] [PubMed] [Google Scholar]
- Noyes MB, Christensen RG, Wakabayashi A, Stormo GD, Brodsky MH, Wolfe SA. Analysis of homeodomain specificities allows the family-wide prediction of preferred recognition sites. Cell. 2008;133:1277–1289. doi: 10.1016/j.cell.2008.05.023. [DOI] [PMC free article] [PubMed] [Google Scholar]
- Odom DT, Zizlsperger N, Gordon DB, Bell GW, Rinaldi NJ, Murray HL, Volkert TL, Schreiber J, Rolfe PA, Gifford DK, et al. Control of pancreas and liver gene expression by HNF transcription factors. Science. 2004;303:1378–1381. doi: 10.1126/science.1089769. [DOI] [PMC free article] [PubMed] [Google Scholar]
- O'Geen H, Sharon L, Squazzo L, Iyengar S, Blahnik K, Rinn JL, Chang HY, Green R, Farnham PJ. Genome-wide analysis of KAP1 binding suggests autoregulation of KRAB-ZNFs. PLoS Genet. 2007;3:e89. doi: 10.1371/journal.pgen.0030089. [DOI] [PMC free article] [PubMed] [Google Scholar]
- Pruitt KD, Tatusova T, Maglott DR. NCBI Reference Sequence (RefSeq): A curated non-redundant sequence database of genomes, transcripts and proteins. Nucleic Acids Res. 2007;35:D61–D65. doi: 10.1093/nar/gkl842. [DOI] [PMC free article] [PubMed] [Google Scholar]
- Rada-Iglesias A, Ameur A, Kapranov P, Enroth S, Komorowski J, Gingeras TR, Wadelius C. Whole-genome maps of USF1 and USF2 binding and histone H3 acetylation reveal new aspects of promoter structure and candidate genes for common human disorders. Genome Res. 2008;18:380–392. doi: 10.1101/gr.6880908. [DOI] [PMC free article] [PubMed] [Google Scholar]
- Ramsey SA, Klem SL, Zak DE, Kennedy KA, Thorsson V, Li B, Gilchrist M, Gold ES, Johnson CD, Li B, et al. Uncovering a macrophage transcriptional program by integrating evidence from motif scanning and expression dynamics. PLoS Comput Biol. 2008;4:e1000021. doi: 10.1371/journal.pcbi.1000021. [DOI] [PMC free article] [PubMed] [Google Scholar]
- Ren B, Robert F, Wyrick JJ, Aparicio O, Jennings EG, Simon I, Zeitlinger J, Schreiber J, Hannett N, Kanin E, et al. Genome-wide location and function of DNA binding proteins. Science. 2000;290:2306–2309. doi: 10.1126/science.290.5500.2306. [DOI] [PubMed] [Google Scholar]
- Ren B, Cam H, Takahashi Y, Volkert T, Terragni J, Young RA, Dynlacht BD. E2F integrates cell cycle progression with DNA repair, replication, and G2/M checkpoints. Genes & Dev. 2002;16:245–256. doi: 10.1101/gad.949802. [DOI] [PMC free article] [PubMed] [Google Scholar]
- Robertson G, Hirst M, Bainbridge M, Bilenky M, Zhao Y, Zeng T, Euskirchen G, Bernier B, Varhol R, Delaney A, et al. Genome-wide profiles of STAT1 DNA association using chromatin immunoprecipitation and massively parallel sequencing. Nat Methods. 2007;4:651–657. doi: 10.1038/nmeth1068. [DOI] [PubMed] [Google Scholar]
- Schones DE, Cui K, Cuddapah S, Roh TY, Barski A, Wang Z, Wei G, Zhao K. Dynamic regulation of nucleosome positioning in the human genome. Cell. 2008;132:887–898. doi: 10.1016/j.cell.2008.02.022. [DOI] [PMC free article] [PubMed] [Google Scholar]
- Siepel A, Bejerano G, Pedersen JS, Hinrichs AS, Hou M, Rosenbloom K, Clawson H, Spieth J, Hillier LW, Richards S, et al. Evolutionarily conserved elements in vertebrate, insect, worm, and yeast genomes. Genome Res. 2005;15:1034–1050. doi: 10.1101/gr.3715005. [DOI] [PMC free article] [PubMed] [Google Scholar]
- Sinha S, Alder AS, Field Y, Chang HY, Segal E. Systematic functional characterization of cis-regulatory motifs in human core promoters. Genome Res. 2008;18:477–488. doi: 10.1101/gr.6828808. [DOI] [PMC free article] [PubMed] [Google Scholar]
- Stormo GD. DNA binding sites: Representation and discovery. Bioinformatics. 2000;16:16–23. doi: 10.1093/bioinformatics/16.1.16. [DOI] [PubMed] [Google Scholar]
- Vlieghe D, Sandelin A, De Bleser PJ, Vleminckx K, Wasserman WW, van Roy F, Lenhard B. A new generation of JASPAR, the open-access repository for transcription factor binding site profiles. Nucleic Acids Res. 2006;34:D95–D97. doi: 10.1093/nar/gkj115. [DOI] [PMC free article] [PubMed] [Google Scholar]
- Wang T, Zeng J, Lowe CB, Sellers RG, Salama SR, Yang M, Burgess SM, Brachmann RK, Haussler D. Species-specific endogenous retroviruses shape the transcriptional network of the human tumor suppressor protein p53. Proc Natl Acad Sci. 2007;104:18613–18618. doi: 10.1073/pnas.0703637104. [DOI] [PMC free article] [PubMed] [Google Scholar]
- Wei CL, Wu Q, Vega VB, Chiu KP, Ng P, Zhang T, Shahab A, Yong H-C, Fu Y, Weng Z, et al. A global map of p53 transcription-factor binding sites in the human genome. Cell. 2006;124:207–219. doi: 10.1016/j.cell.2005.10.043. [DOI] [PubMed] [Google Scholar]
- Whitington T, Perkins AC, Bailey TL. High-throughput chromatin information enables accurate tissue-specific prediction of transcription factor binding sites. Nucleic Acids Res. 2009;37:14–25. doi: 10.1093/nar/gkn866. [DOI] [PMC free article] [PubMed] [Google Scholar]
- Xie X, Lu J, Kulbokas EJ, Golub TR, Mootha V, Lindblad-Toh K, Lander ES, Kellis M. Systematic discovery of regulatory motifs in human promoters and 3′ UTRs by comparison of several mammals. Nature. 2005;434:338–345. doi: 10.1038/nature03441. [DOI] [PMC free article] [PubMed] [Google Scholar]
- Xu X, Bieda M, Jin VX, Rabinovich A, Oberley M, Green R, Farnham PJ. A comprehensive ChIP-chip analysis of E2F1, E2F4, and E2F6 in normal and tumor cells reveals interchangeable roles of E2F family members. Genome Res. 2007;17:1550–1561. doi: 10.1101/gr.6783507. [DOI] [PMC free article] [PubMed] [Google Scholar]
- Yang A, Zhu Z, Kapranov P, McKeon F, Church GM, Gingeras TR, Struhl K. Relationships between p63 binding, DNA sequence, transcription activity, and biological function in human cells. Mol Cell. 2006;24:593–602. doi: 10.1016/j.molcel.2006.10.018. [DOI] [PubMed] [Google Scholar]
- Zeller KI, Zhao X, Lee CWH, Chiu KP, Yao F, Yustein JT, Yao F, Yustein JT, Ooi HS, Orlov YL, et al. Global mapping of c-Myc binding sites and target gene networks in human B cells. Proc Natl Acad Sci. 2006;103:17834–17839. doi: 10.1073/pnas.0604129103. [DOI] [PMC free article] [PubMed] [Google Scholar]