Abstract
Polymer microring resonators have been exploited for high-sensitivity and wideband photoacoustic imaging. To demonstrate high-sensitivity ultrasound detection, high-frequency photoacoustic imaging of a 49-μm-diameter black bead at an imaging depth of 5 mm was imaged photoacoustically using a synthetic 2-D array with 249 elements and a low laser fluence of 0.35 mJ/cm2. A bandpass filter with a center frequency of 28 MHz and a bandwidth of 16 MHz was applied to all element data but without signal averaging, and a signal-to-noise ratio of 16.4 dB was obtained. A wideband detector response is essential for imaging reconstruction of multiscale objects, e.g., various sizes of tissues, by using a range of characteristic acoustic wavelengths. A simulation of photoacoustic tomography of beads shows that objects with their boundaries characteristic of high spatial frequencies and the inner structure primarily of low spatial frequency components can be faithfully reconstructed using such a detector. Photoacoustic tomography experiments of 49- and 301-μm-diameter beads were presented. A high resolution of 12.5 μm was obtained. The boundary of a 301-μm bead was imaged clearly. The results demonstrated that the high sensitivity and broadband response of polymer microring resonators have potential for high resolution and high-fidelity photoacoustic imaging.
I. Introduction
Photoacoustic imaging, including photoacoustic tomography (PAT), a noninvasive technique for imaging optical properties in biological tissues, combines the advantages of both high optical contrast between different soft biological tissues and high spatial resolution of pure ultrasound imaging. It is well known that for some particular optical wavelengths, the absorption coefficient of some tissues, such as blood vessels and malignant tumors, can be significantly higher than that of its surrounding tissues [1], [2]. When laser energy is absorbed by an absorptive structure in tissues, a small temperature rise causes thermal expansion by the thermoelastic mechanism and generates acoustic waves. Induced acoustic waves range widely in the temporal spectrum. They propagate through the medium, and the acoustic signal reaching the sample surface can be detected by ultrasound detectors.
High-frequency (>20 MHz) photoacoustic imaging, which has been used in a variety of studies such as thermal burns imaging [3], microvasculature imaging [4], and intravascular imaging [5], allows high-resolution images of biological and biomedical objects. For PAT, wideband response is important in the imaging reconstruction of absorbers with varied size scales. Biomedical applications such as brain lesion detection [6], hemodynamics monitoring [6], [7], and breast cancer diagnosis [8] demonstrate that PAT is a promising modality for the study of the functional and structural organization of biological tissues. Currently, the detection typically relies on piezoelectric transducers.
To achieve high-resolution, high frame-rate, and 3-D photoacoustic imaging, a dense 2-D array with small element size is needed. However, realizing such arrays by piezoelectric transducers poses considerable difficulties. First, fabricating arrays of small-size element and small kerf is highly challenging using current piezoceramics processing techniques. Second, small electrical capacitance of each element leads to reduced signal due to transmission line loading and increased noise. Third is the problem of complex electrical interconnects for addressing the array elements. In addition, a single element detector has limited bandwidth and thus can only respond to part of the spectrum of the acoustic waves. Hence, transducers with different central frequencies are employed to expand the detection bandwidth [8], [9]. In general, a piezoelectric transducer with a higher central frequency can better detect the edge parts of a structure, which has the characteristic of rapidly changing spatial absorption profile but is difficult to recognize the smooth parts of the structure with low spatial frequencies. On the other hand, a piezoelectric transducer with a lower central frequency behaves in the opposite way. Therefore, wide bandwidth receivers spanning the range of less than 1 MHz to above 50 MHz are essential for a complete, high-resolution, photoacoustic image reconstruction.
Recently, a polymer resonator for optical ultrasound detection (PROUD) has been developed [10]–[12] with increasing attraction. The new detection platform offers the advantages of preserving high sensitivity with reduced element sizes, easy addressing for linear arrays by wavelength division multiplexing [10], [11], and fabrication simplicity [13]. A microring device with a low noise-equivalent pressure (NEP), defined as the minimum detectable pressure, of 0.20 kPa over 1 to 50 MHz has been reported [12]. This NEP is much lower than a state-of-the-art hydrophone of similar size [12], [14]. Because photoacoustic signals are typically 20 to 40 dB weaker than ultrasound signals, the low NEP provided by the microring device will directly benefit high-frequency photoacoustic imaging. In addition, the −3 dB bandwidth was measured to be more than 90 MHz, starting from DC, which is particularly advantageous for photoacoustic tomography for faithful reconstruction of light absorbing structures of different scales.
In this paper, we use photoacoustic imaging to explore the potential of low NEP and wideband response of polymer microring resonators quantitatively. High-sensitivity photoacoustic imaging and wideband photoacoustic tomography using polymer microring resonators were experimentally demonstrated for the first time. In section II, basic principles of a microring ultrasound sensor and device preparation will be described. The theoretical background of reconstruction for photoacoustic tomography will also be introduced. Section III demonstrates the experimental results of high-sensitivity photoacoustic imaging that uses the low NEP characteristic of microring resonators. To prove the benefits of wideband response, we present the simulation results of photoacoustic tomography using both microring sensors and piezoelectric transducers to provide comparisons. Experimental results of photoacoustic tomography using polymer microring resonators are also demonstrated. Imaging resolution and issues regarding agreement between theories and experiments are discussed in Section IV. Section V concludes this paper.
II. Methods
A. Principles of Microring Ultrasound Sensors
A microring resonator device, shown in Fig. 1(a), is composed of a straight waveguide coupled with a ring waveguide, where the microring serves as an optical resonator. Resonance occurs when the round-trip phase change of optical wave propagating in the ring waveguide is equal to 2mπ, where m is an integer. It can be shown that when the resonance condition is satisfied, the total field of optical wave returning to the coupler is π out of phase with the optical wave propagating through the coupler region in the straight waveguide, resulting in destructive interference. Thus, the transmission spectrum will have resonance dips, as shown in Fig. 1(b). As an ultrasound sensor, polymer microring resonators experience a strain field, caused by incident acoustic waves, which slightly deform the waveguide shape. The change in waveguide cross section directly modifies the effective refraction index of the guided mode. The strain will also alter the refractive indices of the waveguide material and water that surrounds the waveguide via the elasto-optic effect. Hence, the resonance condition is modulated. Detailed theoretical calculation was given previously [10]. Ultrasound detection is illustrated in Fig. 1(c). When the device is probed at a fixed wavelength with a high slope in the transmission spectrum, the output intensity can be modulated by the ultrasound wave, which is then recorded by a high-speed photodetector. Accordingly, high-sensitivity detection requires high Q resonators.
Fig. 1.

Schematic of (a) a microring resonator, (b) its resonance spectrum, and (c) ultrasound detection using the optical resonance of a microring sensor: ultrasound pressure pulse causes dynamic shift of resonance wavelength, producing a modulated intensity in the form of a pulse in the light output.
B. Devices Preparation
A nanoimprint technique [15] was used to fabricate the PROUD device due to its simple process, high fidelity and precise dimension control. Detailed fabrication processes of polystyrene (PS) microring resonators have been described previously [13]. In this study, the cross section of waveguides was designed as 2 μm × 2 μm for single mode operation at an optical wavelength of 1550 nm. The microrings have a diameter of 100 μm. The gap in the coupling region between the microring and straight waveguides is several hundred nanometers. For easy ultrasound measurement, fibers were butt-coupled to the bus waveguide and glued at the cleaved edges of the silicon substrate using UV curable epoxy. To achieve high-sensitivity photoacoustic imaging, the light intensity coupled into the polymer waveguides should be maximized. Thus, a 10.5-μm mode-field-diameter single-mode fiber was first spliced to a 4.8-μm mode-field diameter fiber to provide better mode matching. The output light was collected by a multimode fiber with a core diameter of 62.5 μm. In photoacoustic tomography, the sensor chip was rotated around the object, and therefore polarization maintaining fibers were used to avoid change of the power coupled into the waveguide at a specific polarization, which might alter the slope in the transmission spectrum and cause change of sensitivity to ultrasound with sensor position.
C. Experimental Setup
The experimental setup used to test the microring device for 3-D photoacoustic imaging is shown in Fig. 2. The device's input fiber was connected to a continuous-wave tunable laser source (HP 8168F, Agilent Technologies, Santa Clara, CA), and the output fiber was connected to a photodetector (1811-FC, New Focus, San Jose, CA) out-putting to a digital oscilloscope (WaveSurfer 432, LeCroy Chestnut Ridge, NY) for data collection. The photodetector has a DC output gain of 1 V/mA and AC output gain of 40 V/mA with an electrical bandwidth of 25 kHz to 125 MHz. A black PS bead was first fixed in a gel made by mixing water and 1% agarose (GPG/LE, American Bioanalytical, Natick, MA). Then the phantom was placed in deionized water. A 532-nm-pulse laser (Surelite I-20 with ∼6 ns pulse width, Continuum, Santa Clara, CA) was used to illuminate the bead. The laser light was delivered to the phantom through free space. The beam width was ∼4.5 mm without any beam shaping. A synthetic disk-shaped 2-D array was formed by scanning the device using a 2-D translation stage. For the experimental setup of 2-D photoacoustic tomography, a circular rotation stage was used instead, as shown in Fig. 3. The light source illuminating the bead was fixed in place while the detector rotated around the objects.
Fig. 2.
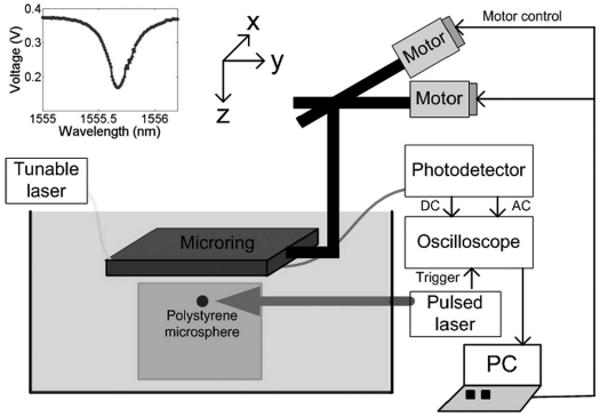
Experimental setup for 3-D photoacoustic imaging. A 2-D translation stage scanned a microring device to form a synthetic 2-D array. A bead placed in a gel bulk was imaged. The gel and the microring device were submerged in deionized water. Inset: transmission spectrum of the microring at an input power of 4.2 mW.
Fig. 3.
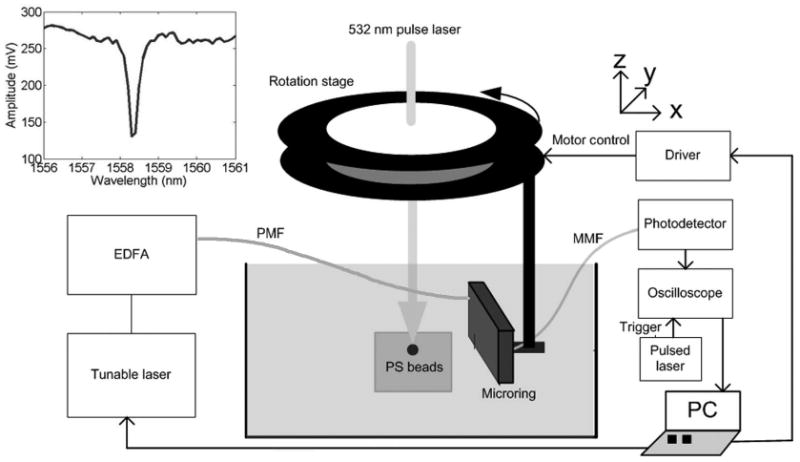
Experimental apparatus for photoacoustic tomography to image 49-μm and 301-μm-diameter beads. The polystyrene (PS) beads produce an acoustic wave, and the microring resonator is scanned in a circular measurement configuration. The gel containing the PS bead and the microring resonator were immersed in deionized water. The inset shows the transmission spectrum of the microring resonator.
D. Principles of Time-Domain Reconstruction for Photoacoustic Tomography
In photoacoustic tomography, the laser pulse duration, τp, is typically shorter than the thermal transport time of absorbed heat energy, τth, which can be approximated by lp2/α, where lp is the size of absorbing structure and α is the thermal diffusivity of the irradiated material. In our experiment, the absorbers are PS beads, α ∼10−7 m2/s. Even for very small objects that are ∼micrometer sized, the thermal transport time τth is ∼10−5 s. As a comparison, the laser pulse used is typically several nanoseconds (τp), which is much shorter than τth. Consequently the effect of heat conduction in the photoacoustic wave equation can be ignored. As has been described in the literature [16], the photoacoustic pressure p(r,t) at position r and time t in response to a heat source H(r,t) can be expressed as
| (1) |
where H(r,t) is the heat-producing radiation power absorbed by the material per unit volume and can be written as the product of an optical energy absorption A within the material at position r and the temporal profile of the irradiation pulse I(t), i.e.,
| (2) |
The objective of image reconstruction is to estimate the absorption distribution A(r) from a set of data p(r,t) measured at position r. For a cylindrical scanning configuration with coordinate system r = (ρ,ϕ,z), the exact inverse solution can be derived but is computationally time consuming [17]. When the detection radius is much larger than the wavelengths of photoacoustic signals generated from the absorbers, as the case in our experiments, the inverse solution can be approximated with the form of
| (3) |
where S0 is the measurement surface with a cylindrical surface r0 = (ρ0, ϕ0, z0); Θ is the angle between the detector surface normal direction and the vector from the detector to the reconstruction point. From (3), the reconstruction of the absorption distribution is the back projection of − (1/t)((∂p(r0, t))/∂t)|t=|r−r0|/c instead of the measured photoacoustic pressure p(r0,t). The modified back projection formula with a weighting factor cosΘ is a good approximation under the requirement that both the rotation radius, ρ0, and the distance between detector and reconstruction point, |r-r0|, are much larger than the wavelengths of the acoustic signals.
If D(t) is the impulse response of the detector, P(t) is the profile of laser pulse, and L(t) is other loss effects, in the time domain, we have
| (4) |
where p(r0,t) is the photoacoustic signal detected by the ultrasound detectors; * represents convolution. pδ(r0, t) is the signal for an impulse heating without any other effects. With different frequency response of polymer microring resonators or piezoelectric transducers, p(r0, t) in (3) can be calculated, and then the reconstructed image can be compared. In our case, because the temporal spectrum of pressure wave generated from a small object concentrates in the relatively high-frequency region, L(t) is mainly due to water absorption. Water has an attenuation coefficient of 2.2 × 10⁻⁴ dB/mm MHz2 [18].
III. Results
A. High-Sensitivity Photoacoustic Imaging
First, we measured the transmission spectrum of the microring device. By sweeping the wavelength of the tunable laser and using the DC output of the photodetector, the measured transmission spectrum at a laser input power of 4.2 mW was shown in the inset of Fig. 2. The quality (Q) factor of the resonance was about 6,000. From the spectrum, the probing wavelength was chosen at 1555.6 nm to maximize the slope and thus the sensitivity. A 49-μm-diameter black PS bead (BK050, Microgenics Corp., Fremont, CA) was illuminated at a laser fluence of 0.35 mJ/cm2. The array had 249 elements with a step size of 0.1 mm in the x- and y-directions and a diameter of . Photoacoustic signals were detected at ∼5 mm from the absorber by recording the AC output of the photodetector at different element positions. The probing light power was 5.5 mW, but due to the coupling loss, the power coupled to the waveguide was about 435 μW. No signal averaging was applied in data collection and image reconstruction.
A bandpass filter with a center frequency of 28 MHz and a bandwidth of 16 MHz was applied to all element data, and a delay-and-sum beamforming algorithm with envelope detection was then used to reconstruct a 3-D image. The average noise level (root-mean-square value over a region where noise dominates) was −19.4 dB and −16.4 dB, respectively, relative to the image peak before and after the envelope detection. Fig. 4 shows 3, 2-D cuts of the reconstructed images with a 15-dB dynamic range. The full widths at half maximum (FWHM) along the x (lateral), y (lateral), and z (axial) directions were 205, 260, and 100 μm, respectively. According to the array geometry and the filter, the ideal lateral and axial resolutions are 209 and 81 μm, respectively. Therefore, the widths of the object image are reasonable for a 49-μm-size bead. The lateral resolution can be improved using a larger array. Note that the bandpass filter used in the delay-and-sum beamforming algorithm is usually not applied in photoacoustic tomography, which needs wideband signals to reconstruct images with a variety of spatial variation.
Fig. 4.
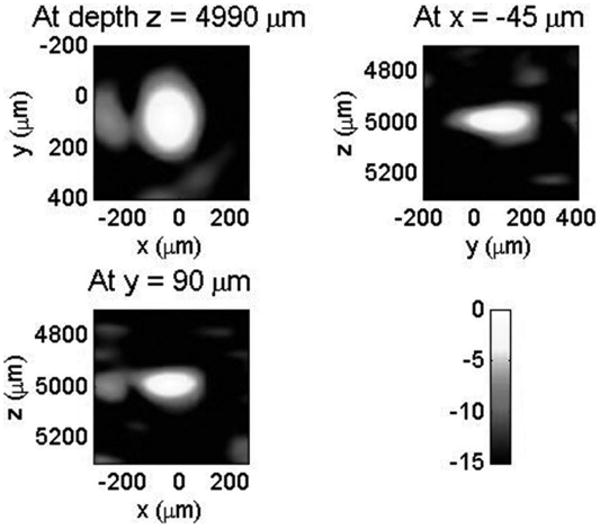
2-D cuts of 3-D photoacoustic images for a 49-μm-diameter bead displayed with a 15-dB dynamic range. The average noise level was −16.4 dB relative to the image peak and no signal averaging was applied.
B. Wideband Photoacoustic Tomography: Simulations
To compare our microring device with the piezoelectric transducers, images from both numerically simulated and experimental data were reconstructed in a 2-D case, which was chosen to reduce the computational and experimental complexity. For the 2-D case, the reconstruction equation can be derived from (3) by setting z = 0 and using a circular measurement configuration.
Photoacoustic tomography of 2 PS beads with diameters of 50 and 300 μm was numerically simulated. To compare the frequency response only the beads were positioned at the center of the detection circle to discount the effect of finite detector aperture size [9], [19]. Assuming a uniform absorption distribution within the spherical beads, the analytical expression for their photoacoustic signal is given in [20]–[22]. The pδ(r0, t) function with respect to t has an N shape. Figs. 5(a) and (b) show a smoothed N shape. Because the acoustic speed of PS beads, ∼2380 m/s [23], is different from that of its surrounding water media, 1480 m/s, we used scaled bead size in the simulation. That is, a reduction ratio of 0.622 [= 1480/2380] in bead's size was used. Therefore, the effective sizes of 50 and 300 μm beads are 31.1 and 186.6 μm, respectively. The main beam of the spectrum of the N-shaped pδ(r0, t) is of a bell shape with maximum amplitude at 32 and 5.5 MHz for the 50- and 300-μm beads, respectively. Therefore, 2 theoretical piezoelectric transducers with central frequency of 5.5 and 32 MHz and a −3-dB bandwidth of 60% were used. For microring resonators, the frequency response range was from DC to 90 MHz at −3 dB according to previous experimental results [12].
Fig. 5.
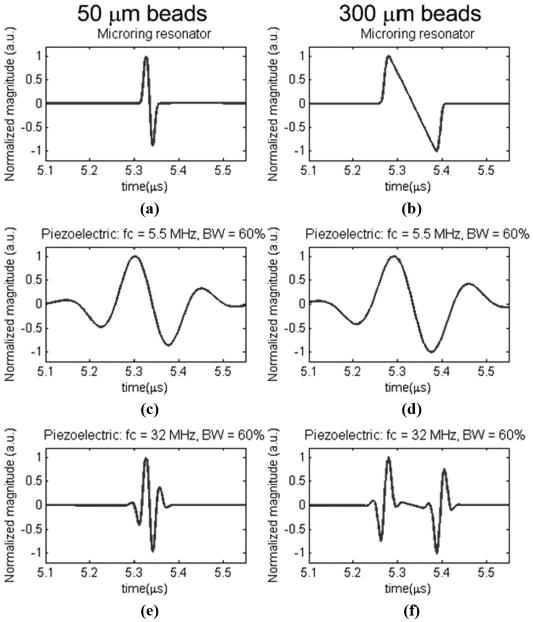
The simulated photoacoustic signals of a 50-μm polystyrene (PS) bead (left column) and a 300-μm PS bead (right column) detected by microring resonators, piezoelectric transducers with a central frequency of 5.5 MHz and 60% bandwidth, and piezoelectric transducers with a central frequency of 32 MHz and 60% bandwidth, respectively.
The radius of the circle of detection is set at 8 mm, which was chosen to be close to our experimental conditions. The angular scanning range was 2π with 72 steps and the photoacoustic signals were sampled at a sampling rate of 1 GHz. Fig. 5 shows the simulated temporal signals detected from the 50-μm and 300-μm-diameter beads using 3 kinds of detectors: microring resonators and piezoelectric transducers with 2 types of frequency response described above. Compared with the relatively sharp N-shape in Fig. 5(b), the relatively smoothed N-shape signal in Fig. 5(a) is mainly due to the finite duration of the pulse laser, ∼6 ns, which is comparable to the acoustic transit time in the 50-μm PS beads, ∼21 ns [= (50 μm)/(2380 m/s)]. A secondary factor is that the spectrum of 50-μm-PS beads has a larger high-frequency component and thus more acoustic absorption loss was encountered. In Figs. (c)–(f), the N-shape disappeared due to the impulse response of a limited bandwidth of the piezoelectric transducers. Fig. 5(c) shows the 50-μm PS beads detected by relatively low-frequency transducers and thus the signal was largely expanded in time domain. Fig. 5(f) is the opposite: a high-frequency transducer catches only the sharp boundary part of the N-shape. Figs. 5(d) and (e) are similar because one is the scaling of the other.
Figs. 6(a)–(f) show the reconstructed images from the simulated signals, corresponding to Figs. 5(a)–(f), respectively. For better comparisons, the line profile of the reconstructed image and the original absorption distribution at y = 0 μm was plotted in Fig. 7. Again, Figs. 7(a)–(f) were extracted from the 2-D images in Figs. 6(a)–(f), respectively. The reconstructed image shown in Fig. 7(b) is in good agreement with the bead profile, which preserves both the boundary of the large bead and the uniform absorption distribution in the inner part. The boundaries of large objects generate relatively high frequency signals. The slowly varying absorption profile within the objects has characteristic low frequency components. In other words, only a detector with wideband response to photoacoustic signals can restore both types of features. In Fig. (a), the smoothing of the boundary and the reduced imaging size, ∼22 μm FWHM, is mainly due to the finite duration of the pulse laser and the water absorption, as described above. Fig. 7(c) shows a very blurred image because the transducer catches only the very low frequency part of the spectrum from the 50-μm PS bead. The sharp boundaries were not captured in Figs. 7(a), (d), and (e), while in Fig. 7(f), only the boundary was detected but not the uniform absorption inside the bead.
Fig. 6.
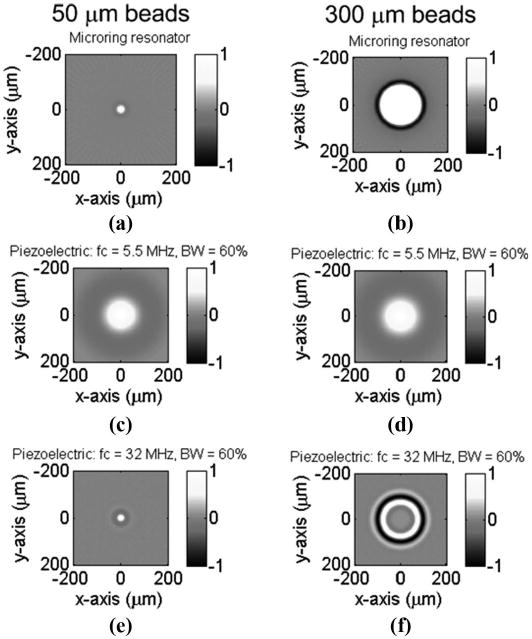
The reconstructed image of a 50-μm polystyrene (PS) bead (left column) and a 300-μm PS bead (right column) using microring resonator detectors, piezoelectric transducers with a central frequency of 5.5 MHz and 60% bandwidth, and piezoelectric transducers with a central frequency of 32 MHz and 60% bandwidth, respectively. Note that the effective sizes of the beads in water are 31.1 and 186.6 μm, respectively.
Fig. 7.
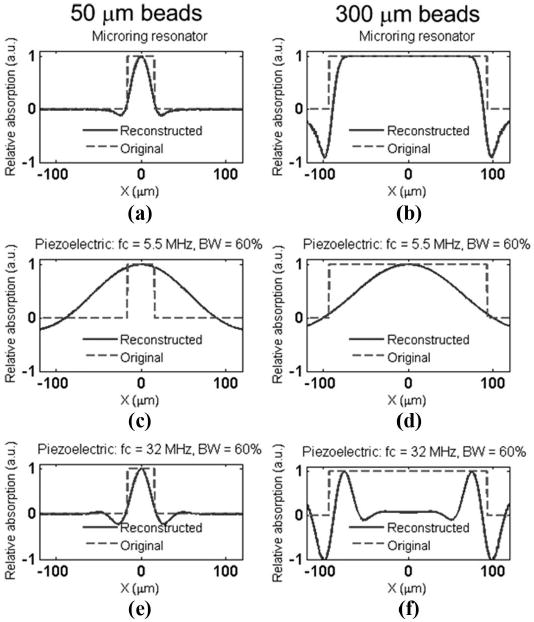
The line profile of the reconstructed image at y = 0 μm. The line profile (a)–(f) corresponds to the 2-D images (a)–(f) in Fig. 6, respectively. Note that the effective sizes of the beads in water are 31.1 and 186.6 μm, respectively.
C. Wideband Photoacoustic Tomography: Experiments
In photoacoustic tomography experiments, we measured the transmission spectrum of the microring device, as shown in the inset of Fig. 3. From the spectrum, the probing wavelength was thus chosen at 1558.42 nm. A 49-μm-diameter black PS bead was first fixed in a gel. Then the phantom was placed in deionized water at a distance of ∼6.5 mm from the device. A 532-nm pulse laser was delivered to the bead from top at a fluence of 9.5 mJ/cm2. During the experiment, the microring detector scanned around the sample at a radius of 6.5 mm from 0° to 360° with a step size of 5°. The photoacoustic signals were sampled for 5 μs at a sampling rate of 1 GHz.
Fig. 8(a) shows the reconstructed image from the experimental data and Fig. 8(b) shows the detected photoacoustic signal at a particular angle and a simulated signal. The 2 signals agree well with each other. In principle, the signals detected from different angles should be similar because the object was positioned close to the center of the detection circle. A smaller size detector will alleviate the aperture effect and thus is helpful to expand the imaging area. Figs. 8(c) and (d) show the line profile of the reconstructed image across the center, at y = −76 μm and x = 9 μm, respectively. As mentioned above, the scaled bead size was used to verify the reconstructed image. In real application, the speed of sound in most soft tissues is relatively constant (∼1540 m/s), and thus the tomography can reconstruct the original sizes of absorbers. Although the smoothing of the boundary in Figs. 8(c) and (d) was relatively obvious due to the loss in the high-frequency and the finite pulse duration, an N-shape signal was maintained because of the wideband response of the polymer microring resonator. The reduced imaging size, ∼25.5 μm FWHM, underestimates the scaled bead's size, 30.5 μm [= 49 × 0.622], as predicted by simulations.
Fig. 8.
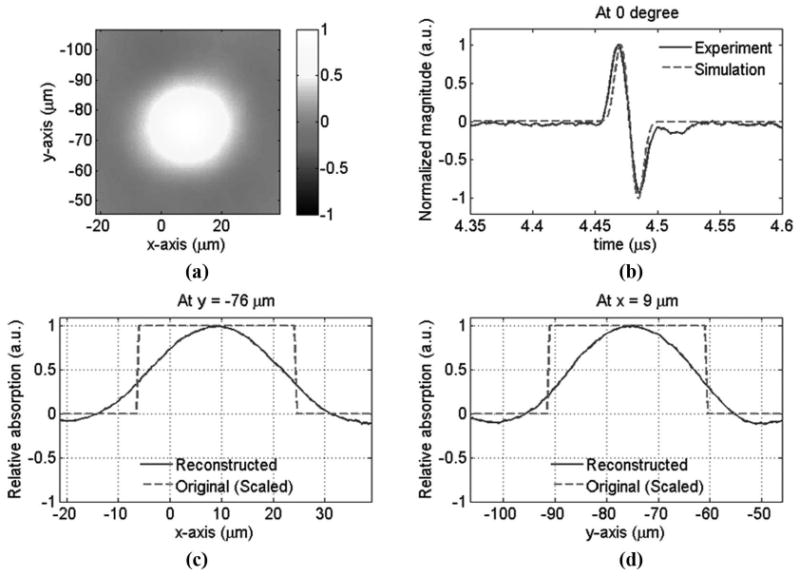
Photoacoustic tomography of a 49-μm bead. (a) Reconstructed image, (b) measured and simulated acoustic signals at one particular angle, (c) the line profile of the reconstructed image at y = −76 μm, and (d) the line profile of the reconstructed image at x = −9 μm. The center of the bead's image is at about x = 9 μm and y = −76 μm.
For the case of 301-μm-diameter beads (BK300T, Microgenics Corp., Fremont, CA), the experimental setup and methods are similar except a lower fluence of 1.9 mJ/cm2 was used because the black-dye bleaches more easily due to enhanced absorption in the larger beads. Fig. 9 shows the reconstructed image and photoacoustic signals. The size of the reconstructed image fits the scaled size well, ∼187 μm [= 301 × 0.622]. Unlike the 49-μm bead case, we were able to obtain an image size very close to the actual bead size because the laser pulse is sufficiently short for the large size bead and the main temporal spectrum of 301-μm beads falls primarily in the low frequency range. The boundaries between the beads and the surrounding medium are imaged clearly.
Fig. 9.
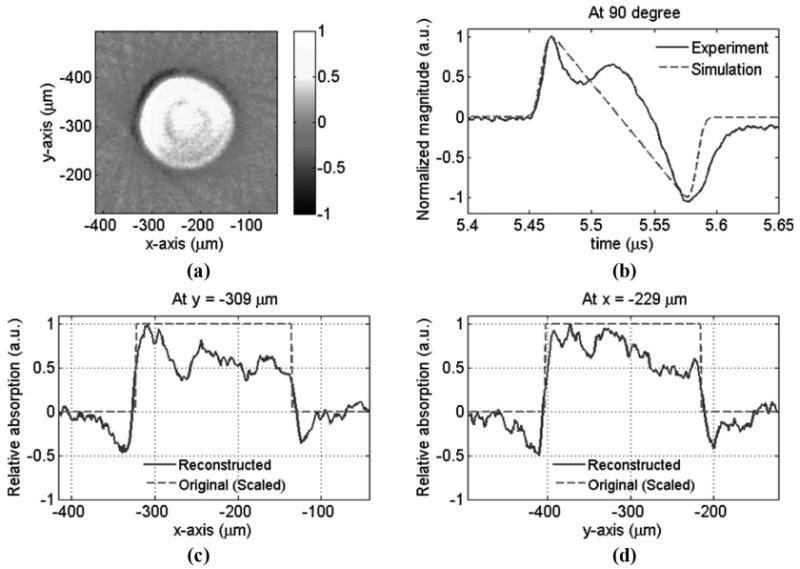
Photoacoustic tomography of a 301-μm bead: (a) reconstructed image, (b) measured and simulated acoustic signal at one particular angle, (c) the line profile of the reconstructed image at y = −309 μm, and (d) the line profile of the reconstructed image at x = −229 μm. The center of the bead's image is at about x = −229 μm and y = −309 μm.
IV. Discussion
The acoustic pressure Pac generated by a spherical fluid object in an optically transparent fluid background that has the same sound speed and density as the object and measured at a distance r to the object center can be expressed as [20], [21]
| (5) |
where R, β, and Cp are the radius, thermal expansion coefficient, and specific heat capacity of the object, W the absorbed energy density, c the sound speed, t the time, and U(ξ) = 1 for ξ ≥ 0 and U(ξ) = 0 otherwise. We used this equation to estimate the expected peak pressure level to be 77.6 Pa in the imaging experiment presented in Section III-A with c = 2380 m/s [23], β = 210 × 10−6 K−1 [24], and Cp = 1.3 kJ/kg/K [25] for PS, R = 24.5 μm, r = 5 mm, and W = (0.35 mJ/cm2) × πR2/(4πR3/3) = 107 mJ/cm3 assuming complete and uniform absorption in the bead. The NEP of microring devices was estimated by the applied peak pressure divided by the optical signal-to-noise ratio (SNR). The microring device has an NEP of 111.4 Pa over the passband of the aforementioned bandpass filter neglecting the effects of angular sensitivity, resulting in an effective NEP of 7.1 for the array used in this experiment. Thus, the estimated SNR is 20.8 dB [= (77.6 Pa)/(7.1 Pa) on linear scale], slightly higher than that in the actual imaging (19.4 dB). This small discrepancy might result from the overestimated signal levels because the sound speed of the background (1480 m/s in water) in the experiment is lower than that (2380 m/s) used in the estimation, and the finite duration of pulse laser and the water absorption (0.86 dB at 28 MHz for a 5-mm propagation) are not considered.
In the photoacoustic tomography of 301-μm PS beads presented in Section III-C, it can be seen that the absorption distribution inside the beads is not as uniform as one would expect. This can be attributed to several factors. First, because light travels 6 times longer distance in a 301-μm bead than that in a 49-μm bead, it can cause more nonuniform absorption between the top and bottom parts of the beads. Besides the nonuniform absorption in the vertical direction (i.e., along the light path), the peripheral part of the bead with less thickness is easier to have uniform absorption of light energy than the central part. That is, the nonuniform light absorption exists in the imaging plane and along the direction normal to the imaging plane. Assuming a spatially uniform laser light incident from −z to +z direction and an absorption coefficient of 50 cm−1 of the dye-doped beads, simulation results presented in Figs. 10(a) and (b) show a more nonuniform absorption distribution in a 300-μm-diameter bead compared with a 50-μm-diameter bead. Second, because the refractive index of the PS beads is larger than that of water, light is focused to the central region of the bead, but not to a well-defined focal point due to the spherical aberration. This focusing effect might explain the brighter image in the center part of the 301-μm-diameter bead, as shown in Fig. 9(a). Such effect will be much less serious in real applications because the refractive index of tissues is close to that of water [26], [27] and the shape of tissue is more irregular. Third, the requirement of the spatial uniformity of pulse laser energy is more critical when the object size is larger. These factors may explain a distorted N-shape acoustic signal in Fig. 9(b). The exact reason is under investigation.
Fig. 10.
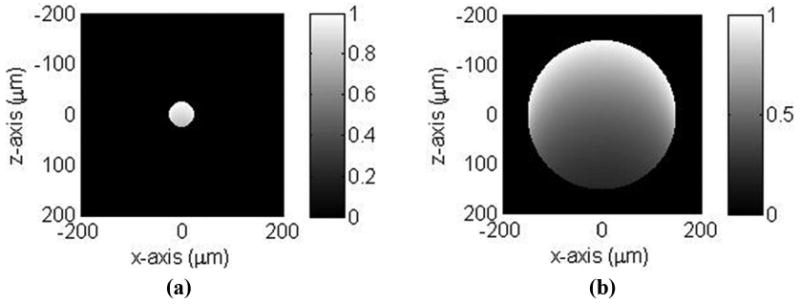
The simulated absorption distribution of (a) 50- and (b) 300-μm-diameter beads. A spatially uniform light source and an absorption coefficient of 50 cm−1 of the dye-doped beads are assumed.
Finally, to evaluate the imaging resolution of polymer microring resonators, we compare a similar experiment of imaging hair fibers with a diameter of ∼60 μm, as performed in [9] that used piezoelectric transducers. The zero-crossing widths of the positive main lobes of the reconstructed images are 270 μm, 120 μm, and 90 μm for the 3 transducers: 3.5 MHz, 10 MHz, and 20 MHz. These commercial transducers have nominal bandwidths of 50% to 80% of their central frequencies. The resolution of an image was defined in [9] as the width of the main lobe at zero-crossing point minus the width of the imaged hair. Therefore, the corresponding image resolutions were approximately 210 μm, 60 μm, and 30 μm for the above 3 transducers, respectively. In this work of using the microring detector to image the 49-μm PS bead, the zero-crossing width of the reconstructed imaging is approximately 43 μm. Due to the mismatch of sound speed in PS and in water, the effective bead size in water is 30.5 μm. Using the same definition as in [9], the image resolution is 12.5 μm, which is much higher than those obtained by the above 3 piezoelectric transducers.
V. Conclusions
In this paper, we have demonstrated the benefits of low noise and wideband response of polymer microring resonator in photoacoustic imaging. In the first experiment, a 49-μm bead was imaged using a synthetic array with 249 elements with SNR of 16.4 dB at low laser fluence of 0.35 mJ/cm2 and without signal averaging. as a comparison, if using a 75-μm piezoelectric polyvinylidene fluoride (PVDF) transducer [12], 20 times higher laser fluence would be required to achieve the same SNR. Based on these results, microring devices are suitable for high-resolution photoacoustic imaging due to the advantage of small element size without compromising high sensitivity. The benefit of the exceptionally wide bandwidth of microring detector is demonstrated in photoacoustic tomography of black beads of 2 different sizes. The boundaries and inner part of objects can be imaged clearly and accurately without the assistance of signal processing. In contrast, our simulations show that either the sharp boundary or the uniform absorption region disappeared if imaged by piezoelectric transducers with different central frequencies and limited bandwidths. The experimental results are in good agreement with the simulation. The sensitivity can be improved further by enhancing the Q factor of the microring device and/or improving the light coupling efficiency from the fiber to the detector's bus waveguide. Also, 2-D microring detector arrays are feasible using wavelength division multiplexing [10]. To have better angular response, smaller microrings with high Q factor will be designed in our future work.
Acknowledgments
Support from NIH grant EB007619 is gratefully acknowledged.
Biographies

Sung-Liang Chen was born in Taichung, Taiwan, ROC, in 1981. He received the B.S. degree in electrical engineering and the M.S. degree in electro-optical engineering from National Taiwan University, Taipei, Taiwan, ROC, in 2003 and 2005, respectively. He is currently a graduate student in the Department of Electrical Engineering and Computer Science, University of Michigan, Ann Arbor. His current research interests include calibration of integrated optical devices and photoacoustic imaging.

Sheng-Wen Huang was born in Changhua, Taiwan, ROC, in 1971. He received the B.S. and Ph.D. degrees from National Taiwan University, Taipei, Taiwan, ROC, in 1993 and 2004, respectively, both in electrical engineering. From 2004 to 2005, he was a postdoctoral researcher at the National Taiwan University. He is currently a postdoctoral researcher in the Department of Biomedical Engineering, University of Michigan, Ann Arbor. His current research interests include optoacoustic transduction and imaging, ultrasound elasticity imaging, and thermal strain imaging.
Tao Ling received the B.S. degree in physics from Nankai University, Tianjin, China, and the M.S. degree in optics from the Fudan University, Shanghai, China. He is currently working toward the Ph.D. degree in electrical engineering from the University of Michigan, Ann Arbor. He is engaged in research on optical microcavity-related biochemical sensor, imaging, and laser.

Shai Ashkenazi (M'00) Received the B.Sc. degree in physics form the Technion Israel Institute of Technology, Haifa, Israel, in 1988, and his Ph.D. degree in physics from the Weizmann Institute of Science, Rehovot, Israel, in 1997. He then worked for 6 years in research and development companies in the fields of ultrasonic and optical devices for medical applications.
In 2003, he moved to the University of Michigan, Ann Arbor, MI, as a research scientist in the field of optoacoustic imaging. In 2008, he joined the Biomedical Engineering Department at the University of Minnesota where he is currently an assistant professor. His research interests include optoacoustics and ultrasound imaging for biomedical applications.

L. Jay Guo (S'96–M'97) received the Ph.D. degree from the University of Minnesota, Minneapolis, in 1997. From 1998 to 1999, he was a research associate at Princeton University, Princeton, NJ. He is currently an associate professor in the Department of Electrical Engineering and Computer Science, University of Michigan, Ann Arbor. His current research interests include nanofabrication technologies with applications in polymer photonic devices, nanoimprint technology, organic electronics, and nanophotonics.
Contributor Information
Sung-Liang Chen, Department of Electrical Engineering and Computer Science, University of Michigan, Ann Arbor, MI.
Sheng-Wen Huang, Department of Biomedical Engineering, University of Michigan, Ann Arbor, MI; Bioengineering Department, University of Washington, Seattle, WA.
Tao Ling, Department of Electrical Engineering and Computer Science, University of Michigan, Ann Arbor, MI.
Shai Ashkenazi, Department of Biomedical Engineering, University of Michigan, Ann Arbor, MI; Department of Biomedical Engineering, University of Minnesota, Minneapolis, MN.
L. Jay Guo, Email: guo@umich.edu, Department of Electrical Engineering and Computer Science, University of Michigan, Ann Arbor, MI.
References
- 1.Kolkman RGM, Hondebrink E, Steenbergen W, de Mul FFM. In vivo photoacoustic imaging of blood vessels using an extreme-narrow aperture sensor. IEEE J Sel Topics Quantum Electron. 2003 Mar/Apr;9:343–346. [Google Scholar]
- 2.Cerussi A, Shah N, Hsiang D, Durkin A, Butler J, Tromberg BJ. In vivo absorption, scattering, and physiologic properties of 58 malignant breast tumors determined by broadband diffuse optical spectroscopy. J Biomed Opt. 2006 Jul/Aug;11(no 4) doi: 10.1117/1.2337546. art. no. 044005. [DOI] [PubMed] [Google Scholar]
- 3.Zhang HF, Maslov K, Stoica G, Wang LV. Imaging acute thermal burns by photoacoustic microscopy. J Biomed Opt. 2006 Sep/Oct;11(no 5) doi: 10.1117/1.2355667. art. no. 054033. [DOI] [PubMed] [Google Scholar]
- 4.Zhang HF, Maslov K, Li ML, Stoica G, Wang LV. In vivo volumetric imaging of subcutaneous microvasculature by photoacoustic microscopy. Opt Express. 2006 Oct;14(no 20):9317–9323. doi: 10.1364/oe.14.009317. [DOI] [PubMed] [Google Scholar]
- 5.Sethuraman S, Aglyamov SR, Amirian JH, Smalling RW, Emelianov SY. Intravascular photoacoustic imaging using an IVUS imaging catheter. IEEE Trans Ultrason Ferroelectr Freq Control. 2007 May;54(no 5):978–986. doi: 10.1109/tuffc.2007.343. [DOI] [PubMed] [Google Scholar]
- 6.Wang X, Pang Y, Ku G, Xie X, Stoica G, Wang LV. Non-invasive laser-induced photoacoustic tomography for structural and functional in vivo imaging for the brain. Nat Biotechnol. 2003 Jul;21(no 7):803–806. doi: 10.1038/nbt839. [DOI] [PubMed] [Google Scholar]
- 7.Wang X, Xie X, Ku G, Wang LV, Stoica G. Noninvasive imaging of hemoglobin concentration and oxygenation in the rat brain using high-resolution photoacoustic tomography. J Biomed Opt. 2006 Mar/Apr;11(no 2) doi: 10.1117/1.2192804. art. no. 024015. [DOI] [PubMed] [Google Scholar]
- 8.Ku G, Fornage BD, Jin X, Xu M, Hunt KK, Wang LV. Thermoacoustic and photoacoustic tomography of thick biological tissues toward breast imaging. Technol Cancer Res Treat. 2005 Oct;4(no 5):559–565. doi: 10.1177/153303460500400509. [DOI] [PubMed] [Google Scholar]
- 9.Ku G, Wang X, Stoica G, Wang LV. Multiple-bandwidth photoacoustic tomography. Phys Med Biol. 2004 Mar;49:1329–1338. doi: 10.1088/0031-9155/49/7/018. [DOI] [PubMed] [Google Scholar]
- 10.Chao CY, Ashkenazi S, Huang SW, O'Donnell M, Guo LJ. High-frequency ultrasound sensors using polymer microring resonators. IEEE Trans Ultrason Ferroelectr Freq Control. 2007 May;54(no 5):957–965. doi: 10.1109/tuffc.2007.341. [DOI] [PubMed] [Google Scholar]
- 11.Maxwell A, Huang SW, Ling T, Kim JS, Ashkenazi S, Guo LJ. Polymer microring resonators for high-frequency ultrasound detection and imaging. IEEE J Sel Top Quantum Electron. 2008 Jan/Feb;14(no 1):191–197. doi: 10.1109/JSTQE.2007.914047. [DOI] [PMC free article] [PubMed] [Google Scholar]
- 12.Huang SW, Chen SL, Ling T, Maxwell A, O'Donnell M, Guo LJ, Ashkenazi S. Low-noise wideband ultrasound detection using polymer microring resonators. Appl Phys Lett. 2008 May;92(no 19) doi: 10.1063/1.2929379. art. no. 193509. [DOI] [PMC free article] [PubMed] [Google Scholar]
- 13.Chao CY, Guo LJ. Polymer micro-ring resonators fabricated by nanoimprint technique. J Vac Sci Technol B. 2002 Nov/Dec;20(no 6):2862–2866. [Google Scholar]
- 14.Beard PC, Hurrell A, Mills TN. Characterisation of a polymer film optical fiber hydrophone for the measurement of ultrasound fields for use in the range 1–20 MHz: A comparison with PVDF needle and membrane hydrophones. IEEE Trans Ultrason Ferroelectr Freq Control. 2000 Jan;47(no 1):256–264. doi: 10.1109/58.818769. [DOI] [PubMed] [Google Scholar]
- 15.Chou SY, Krauss PR, Zhang W, Guo L, Zhuang L. Sub-10 nm imprint lithography and applications. J Vac Sci Technol B. 1997 Nov/Dec;15(no 6):2897–2904. [Google Scholar]
- 16.Xu M, Xu Y, Wang LV. Time-domain reconstruction algorithms and numerical simulations for thermoacoustic tomography in various geometries. IEEE Trans Biomed Eng. 2003 Sep;50(no 9):1086–1099. doi: 10.1109/TBME.2003.816081. [DOI] [PubMed] [Google Scholar]
- 17.Wang X, Xu Y, Xu M, Yokoo S, Fry ES, Wang LV. Photoacoustic tomography of biological tissues with high cross-section resolution: Reconstruction and experiment. Med Phys. 2002 Dec;29(no 12):2799–2805. doi: 10.1118/1.1521720. [DOI] [PubMed] [Google Scholar]
- 18.Cannata JM, Williams JA, Zhou Q, Ritter TA, Shung KK. Development of a 35-MHz piezo-composite ultrasound array for medical imaging. IEEE Trans Ultrason Ferroelectr Freq Control. 2006 Jan;53(no 1):224–236. doi: 10.1109/tuffc.2006.1588408. [DOI] [PubMed] [Google Scholar]
- 19.Xu M, Wang LV. Analytic explanation of spatial resolution related to bandwidth and detector aperture size in thermoacoustic or photoacoustic reconstruction. Phys Rev E Stat Nonlin Soft Matter Phys. 2003 May;67 doi: 10.1103/PhysRevE.67.056605. art. no. 056605. [DOI] [PubMed] [Google Scholar]
- 20.Ashkenazi S, Hou Y, Buma T, O'Donnell M. Optoacoustic imaging using thin polymer étalon. Appl Phys Lett. 2005 Mar;86(no 13) art. no. 134102. [Google Scholar]
- 21.Diebold GJ, Sun T, Khan MI. Photoacoustic monopole radiation in one, two, and three dimensions. Phys Rev Lett. 1991 Dec;67(no 24):3384–3387. doi: 10.1103/PhysRevLett.67.3384. [DOI] [PubMed] [Google Scholar]
- 22.Hoelen CGA, de Mul FFM. A new theoretical approach to photoacoustic signal generation. J Acoust Soc Am. 1999;106(no 2):695–706. [Google Scholar]
- 23.Moehring MA, Ritcey JA. Sizing emboli in blood using pulse doppler ultrasound—I: Verification of the EBR model. IEEE Trans Biomed Eng. 1996 Jun;43(no 6):572–580. doi: 10.1109/10.495276. [DOI] [PubMed] [Google Scholar]
- 24.Brandrup J, Immergut EH, Grulke EA. Polymer Handbook. 2nd. New York: Wiley; 1989. p. V-59. [Google Scholar]
- 25.Warfield RW, Petree MC. Thermodynamic properties of polystyrene and styrene. J of Polym Sci. 1961;55(no 162):497–505. [Google Scholar]
- 26.Dirckx JJJ, Kuypers LC, Decraemer WF. Refractive index of tissue measured with confocal microscopy. J Biomed Opt. 2005 Jul/Aug;10(no 4) doi: 10.1117/1.1993487. art. no. 044014. [DOI] [PubMed] [Google Scholar]
- 27.Li H, Xie S, Lin L. Refractive index of bio-tissue and its thermal response. Proc Conf Lasers and Electro-Optics/Pacific Rim '99. 1999;3:1018–1019. [Google Scholar]


