

Abstract
Pathways within the visual system can be distinguished on the basis of selectivity for low or high spatial frequencies. Spatial frequency discrimination was evaluated in 17 medicated male patients with schizophrenia and 19 male control subjects. Subjects were required to discriminate whether pairs of high contrast, sinusoidally modulated gratings were the same or different in spatial frequency. Accuracy performance was compared at high, medium, and low spatial frequencies on tasks matched for control performance. Patients showed a greater performance decrement of 12% on low as compared with 4% on high spatial frequencies. These findings suggest a disturbance of right hemisphere mechanisms involved in spatial perception and attention in schizophrenia.
Although clinical descriptions of schizophrenia usually focus on auditory hallucinations, studies evaluating the subjective experience of schizophrenia patients suggest that visual distortions are also common experiences. Cutting and Dunne (1986) used a structured interview during remission or recovery to assess perceptual abnormalities at the onset of schizophrenia or major depression. In the visual modality, 60% of schizophrenic subjects versus 33% of depressive subjects reported alterations in visual perception. Phillipson and Harris (1985) used a survey questionnaire to compare subjects with probable schizophrenia to control subjects hospitalized after accidents. In these patients with schizophrenia, the prevalence of visual distortions (62%) was higher than the prevalence of auditory distortions (44%). Using a structured interview with chronic patients, visual anomalies were reported by 33% of subjects affected by chronic schizophrenia, as compared to 42% who reported auditory anomalies (Bunney et al., 1999). Subjective disturbances of visual perception described by the studies above included distorted perception of brightness, motion, color, depth, shape, size, orientation, and facial appearance. These subjective visual disturbances may indicate deficits in the perception or integration of visual features.
Computational models, cellular responses, and psychophysical evidence suggest that many early visual processes can be expressed in terms of spatial frequency theory (Pollen, Lee, & Taylor, 1971; Wandell, 1995). This theory asserts that complex visual representations or scenes can be decomposed, using Fourier analysis, into a sum of sinusoidal grating patterns and that the visual cortex makes extensive use of such representations. The simplest grating pattern is derived from the sinusoidal modulation of luminance over a two-dimensional region (Figure 1). This pattern can be described in terms of spatial frequency, usually expressed as the number of cycles (c) per degree (d) of visual angle. Several models of visual processing suggest that spatial frequency analysis within the brain can be broadly divided into channels or pathways, which differ in their selectivity for low or high spatial frequency information. At low levels of contrast, low spatial frequency information may be selectively processed by the magnocellular, transient, or broad-band channel, and high spatial frequency by the parvocellular, sustained, or color opponent channel (Breitmeyer, 1984; Livingstone & Hubel, 1987; Schiller, Logothetis & Charles, 1990). Other investigators have proposed that suprathreshold spatial frequency processing differs between the cerebral hemispheres, with a left hemisphere bias for high spatial frequencies and a right hemisphere bias for low spatial frequencies (Hellige, 1995; Ivry & Robertson, 1998; Sergent, 1983). Low spatial frequencies carry the broad spatial characteristics of an object or scene and are dominant under conditions of low contrast or rapid temporal modulation. High spatial frequency information is critical for the resolution of detail, texture, and edges.
Figure 1.

Examples of low, medium, and high spatial frequency grating pairs. Subjects were required to discriminate whether the right and left gratings in each pair were the same or different in spatial frequency.
Spatial frequency processing has been studied with psychophysical techniques in humans and neurophysiological methods in animals. In psychophysical studies of human performance in adults, spatial frequency processing has been evaluated with two approaches, depending on whether stimuli are presented at very low levels of contrast or are presented well above contrast threshold. Studies of spatial frequency perception at threshold performance levels test contrast sensitivity. Contrast is the difference in luminance between the brightest and darkest points within a spatial frequency grating. Contrast sensitivity is the inverse of the contrast threshold, which is the lowest contrast at which an observer can detect a grating. Studies of suprathreshold performance have usually tested spatial frequency discrimination, which requires a subject to discriminate between two suprathreshold gratings presented simultaneously or on two successive trials. These approaches yield different patterns of performance, providing evidence that the visual system may utilize different perceptual mechanisms at different levels of contrast.
Contrast sensitivity is highly dependent on spatial and temporal frequency. At low temporal frequencies of modulation (1 Hz or less), contrast sensitivity exhibits a bandpass function with peak sensitivity at 2 to 4 c/d of visual angle. At high temporal frequencies of modulation, the function is low pass, with much better contrast sensitivity to low spatial frequencies compared to high spatial frequencies (Legge, 1978; Wandell, 1995). This observation led to the theory that low spatial frequencies and high temporal frequencies were optimally processed by a transient visual channel, whereas high spatial frequencies and low temporal frequencies were processed by a sustained visual channel (Legge, 1978). The sustained channel response properties are similar to those of parvocellular neurons in the lateral geniculate nucleus, whereas the transient channel shows response properties similar to the magnocellular neural population (Livingston & Hubel, 1987). In terms of neural response, magnocellular neurons are critical for transmission of low spatial frequency information at low, but not high, levels of contrast (Merigan & Maunsell, 1993), suggesting that extrapolating findings obtained at contrast threshold to suprathreshold conditions common in illuminated environments may be problematic. Suprathreshold spatial frequency discrimination, unlike contrast sensitivity performance, does not yield a marked difference in performance measures between low and high spatial frequency gratings. This finding suggests that at high contrast the sustained and transient channels do not show differential sensitivity, or that other mechanisms are more important.
There is also experimental evidence that the left and right hemispheres may differ in spatial frequency selectivity. Some investigators (Christman, Kitterle, & Hellige, 1991; Hellige, 1995; Ivry & Robertson, 1998; Kitterle, Christman, & Consesa, 1993; Kitterle, Christman, & Hellige, 1990; Kitterle, Hellige, & Christman, 1992; Kitterle & Selig, 1991; Watten, Magnussen, & Greenlee, 1998) have reported a left visual field performance advantage for low spatial frequencies in discrimination tasks and a right visual field advantage for high spatial frequencies in healthy adults; however, other investigators have reported no performance differences between visual fields (Fiorentini & Berardi, 1984; Greenlee & Thomas, 1993; Magnussen, Greenlee, Asplund, & Dyrnes, 1990). A variety of stimulus and task factors have been identified that determine whether or not hemispheric asymmetries in processing occur. Positive findings are most consistent for spatial frequency discrimination tasks using sinusoidal high contrast gratings (for reviews, see Christman, 1997; Hellige, 1993, 1995; Peterzell, 1991; Robertson & Ivry, 2000). Negative findings have been most likely when visual field of stimulus presentation was not randomized across trials (Magnussen et al., 1990; Greenlee & Thomas 1993) and when absolute, rather than relative, judgments of spatial frequency were used (Hellige, 1993, 1995; Robertson & Ivry, 2000). On a relative judgment of spatial frequency, a subject judges which of two gratings has thicker or thinner bars rather than judging the absolute size of the bars of the grating. In addition, the hemispheric bias appears to be less likely to be found for simple detection tasks (e.g., Fiorentini & Berardi, 1984; Kitterle et al., 1990; Peterzell, Harvey, & Hardyck, 1989), tasks measuring contrast sensitivity (Peterzell et al., 1989), or tasks in which complex stimuli are frequency filtered to remove low or high spatial frequencies (Hellige, 1995; Kitterle & Selig, 1991; Watten et al., 1998). The sensitivity of the hemispheric bias to task demands suggests that this bias for specific spatial frequencies may depend on attentional rather than sensory mechanisms.
Because spatial frequency patterns may activate the most fundamental type of representation in the visual system, they may provide a method to test these mechanisms in schizophrenia. Studies using a spatial frequency approach to evaluate visual processing in schizophrenia have usually tested contrast sensitivity. Contrast sensitivity deficits have been reported by several investigators, but the specific nature of this deficit has not been consistent across studies. Several investigators (Chen, Nakayama, Levy, Matthysse & Holzman, 1999; Chen et al., 1999; Schwartz, McGinn, & Winstead, 1987) have reported that contrast sensitivity deficits are most consistently observed for temporally modulated or moving gratings, rather than static gratings, suggestive of a transient channel deficit. Slaghuis (1998), on the other hand, found that negative symptom schizophrenic patients showed a deficit for both stationary and moving patterns across low and high spatial frequencies, whereas positive symptom patients only showed deficits at medium to high spatial frequencies. Slaghuis’s findings were suggestive of both sustained and transient channel deficits in negative patients and a sustained channel deficit in positive symptom patients.
Although contrast sensitivity for gratings has been evaluated in schizophrenia, the ability of patients to discriminate spatial frequencies at high levels of contrast has received little attention. This is an important experimental issue because stimuli used in tests of visual cognition such as letters or patterns are usually presented at high levels of contrast. In addition, spatial frequency discrimination at high levels of contrast may differentially activate hemispheric processing. We studied discrimination performance for sinusoidally modulated gratings that varied in spatial frequency in patients with schizophrenia and control subjects. Tasks were matched on difficulty and number of items in the control group to better identify differential deficits on performance (Chapman & Chapman, 1973). To our knowledge, studies of spatial frequency processing in schizophrenia have not used tasks explicitly matched for discriminating power.
Method
Subjects
Seventeen male, medicated patients with chronic schizophrenia and 19 control subjects were tested. The patients were all veterans and had onset after induction into military service. The earliest age of first hospitalization was 18 years. All subjects were between the ages of 20 and 50 years. Patients were diagnosed using the Structured Clinical Interview for DSM–IV Axis I Disorders (SCID; First, Spitzer, Gibbon, & Williams, 1995), supplemented by chart information. The SCID was administered by Brian F. O’Donnell and Paul G. Nestor. The Positive and Negative Syndrome Scale (PANSS; Kay, Opler, & Fiszbein, 1986) was used to rate symptom severity, using the Positive, Negative, and Total scores. Chorpromazine equivalent dosages (Bezchlibnyk-Butler & Jeffries, 1996) were calculated for the medications each patient received because the function of dopaminergic amacrine cells in the retina may be affected by dopamine antagonists (Harris, Calvert, Leenertz, & Phillipson, 1990). Twelve patients were receiving conventional neuroleptic medications, 4 were receiving novel antipsychotic medications, and 1 patient was medication free at the time of testing. Control subjects received a structured interview to obtain information regarding neurologic and medical disorders, learning disabilities, treatment for psychological disorders, and alcohol and substance abuse. Group characteristics are shown in Table 1. The groups did not differ in mean age or parental socioeconomic status (Hollingshead, 1965). Patients had lower educational attainment, mental status scores (Folstein, Folstein, & McHugh, 1975), and Information subscale scores on the Wechsler Adult Intelligence Scale—Revised (WAIS–R; Wechsler, 1981). None of the subjects had a history of electroconvulsive therapy, alcohol or drug dependence within in the previous 5 years (DSM–IV criteria), or neurologic disease. Snellen acuity for all subjects was 20/30 or better.
Table 1.
Group Characteristics
| Controls (n = 19) |
Patients (n = 17) |
|||||
|---|---|---|---|---|---|---|
| Measure | M | SD | M | SD | t (df) | p |
| Age | 38.5 | 10.8 | 41.6 | 5.5 | 1.2 (34) | .25 |
| Education (years) | 14.9 | 2.1 | 12.3 | 1.8 | 4.1 (34) | <.01 |
| Parental SES | 2.5 | 1.0 | 3.0 | 0.8 | 1.6 (34) | .13 |
| Mental status | 28.9 | 27.6 | 27.6 | 1.7 | 2.2 (34) | .04 |
| WAIS–R Information | 11.6 | 2.2 | 9.6 | 2.5 | 2.5 (32) | .02 |
| Age of onset (years) | 21.4 | 2.5 | ||||
| Duration (years) | 20.2 | 5.8 | ||||
| PANSS | ||||||
| Positive Symptom | 18.0 | 7.9 | ||||
| Negative Symptom | 17.3 | 5.2 | ||||
| Total score | 69.4 | 19.5 | ||||
| Chlorpromazine equivalent dosage (mg/day) | 708.3 | 671.2 | ||||
Note. WAIS Information scores were not obtained from 2 patients; PANSS ratings were not obtained from 1 patient. SES = socioeconomic status; WAIS–R = Wechsler Adult Intelligence Scale—Revised; PANSS = Positive and Negative Syndrome Scale.
Experimental Design
Discrimination performance was tested for spatial frequency, using pairs of sinusoidally modulated, monochromatic gratings that were either the same or different in spatial frequency (see Figure 1). By presenting the two stimuli simultaneously, working memory demands were minimized. Gratings were suprathreshold, minimizing demands for contrast sensitivity.
Stimuli
Stimuli consisted of two vertical gratings displayed side by side on the computer screen, separated by a black border (Figure 1). Michelson contrast of the gratings was .81, with an average luminance of 29 cd/m2. Each square stimulus patch subtended 3.92° of visual angle. Discrimination performance was evaluated at low (standard stimulus = 0.51 or 0.54 c/d), medium (standard = 4.59 or 4.85 c/d), and high (standard = 8.16 or 8.42 c/d) spatial frequencies. Pilot studies with nonpsychiatric control subjects were used to select sets of stimuli in each of the spatial frequency conditions, which were matched in terms of control subject performance at an accuracy level of 80%. Ten control subjects were used in the pilot study. All of the subjects in the pilot study were healthy individuals with no history of treatment for mental illness. These pilot data were not used in the study reported in the present article. In the pilot studies, 24 nonmatching spatial frequency pairs and 24 matching spatial frequency pairs were evaluated for control accuracy and variance.
On each trial, one of the standard gratings was compared with a second grating, which was either a matching grating or a nonmatching grating. There were four nonmatching gratings in each condition. The degree of mismatch between two gratings was computed using a measure of angular disparity similar to the equation for Michelson contrast: Disparity = (grating1 − grating2)/(grating1 + grating2). Using this measure of angular disparity, the low spatial frequency condition had an average disparity between nonmatching gratings of .22, the medium spatial frequency condition of 0.22, and the high spatial frequency condition of .12. This may have induced a difference in processing between conditions, as discussed by Knight and Silverstein (2001), in that subjects showed higher sensitivity to angular disparity at higher spatial frequencies.
Procedure
Each discrimination trial began with a fixation point that was displayed for 497 ms, followed by the stimulus pair, which was displayed for 1,517 ms. A long stimulus exposure time was used to reduce demands for processing speed in task performance. There was an 81-ms interval between the offset of the fixation point and the onset of the grating pair. The next trial did not begin until the subject made a response (match or nonmatch) to the stimulus pair. Subjects sat 80 cm from the computer display and responded using a key press.
Each subject received five blocks of stimuli. The first two blocks were used for training subjects to perform the task of discriminating the spatial frequency of a pattern, regardless of phase. The first block consisted of 24 stimulus pairs of the same spatial frequency, either in phase or 180° out of phase, which was used to familiarize subjects with matching stimuli. The second block consisted of 48 stimulus pairs, half of which matched in spatial frequency and half of which did not. The nonmatching stimuli were easy to discriminate. These practice blocks were followed by three blocks of stimuli, which tested low, medium, and high spatial frequency discrimination performance. Each block contained 80 stimulus pairs that were the same, and 80 that were different. Phase of each stimulus type was randomly varied by 180° so that subjects would be required to match on spatial frequency alone (width of the light and dark patches on the grating). Experimental blocks and trials within each block were randomized across subjects.
Data Analysis
Accuracy was calculated as percentage correct for the low, medium, and high spatial frequency blocks. Multivariate analysis of variance (MANOVA) was used to evaluate 2 (Group) × 3 (Spatial Frequency) factors (O’Brien & Kaiser, 1985; Stevens, 1996). MANOVA, unlike analysis of variance (ANOVA), does not require sphericity within the data set. Sphericity requires that the variances of the repeated measures are equal and that the correlations among pairs of repeated measures are equal. Pearson correlation coefficients were used in exploratory analyses to evaluate the relationship of spatial frequency performance to age in both groups and to clinical variables in the patient group, which have been linked to visual performance in previous studies.
Results
Group Differences
For high spatial frequency stimuli, the accuracy of control subjects was 79.9% (SD = 6.6%) and that of patients was 76.0% (SD = 5.1%). For medium spatial frequency stimuli, the control mean was 79.7% (SD = 7.1%) and the patient mean was 70.7% (SD = 14.0%). For low spatial frequency stimuli, the control mean was 79.6% (SD = 8.4%) and the patient mean was 67.8% (SD = 10.0). Both difficulty and observed variance were comparable across tasks in the control group. The patients were impaired for this discrimination test, and the degree of impairment had an inverse relationship with spatial frequency, as shown by Figure 2. The MANOVA revealed an overall effect of group, F(1, 34) = 13.91, p = .001. The Group × Spatial Frequency interaction was significant, Hotellings T2 = .24, exact F(2, 33) = 3.93, p =.03. Univariate ANOVAs between groups for each spatial frequency level revealed that the groups differed on low spatial frequency performance, F(1, 34) = 14.7, p = .001, and on medium spatial frequency performance, F(1, 34) = 6.16, p = .02, but not on high spatial frequency performance, F(1, 34) = 3.51, p = .07.
Figure 2.
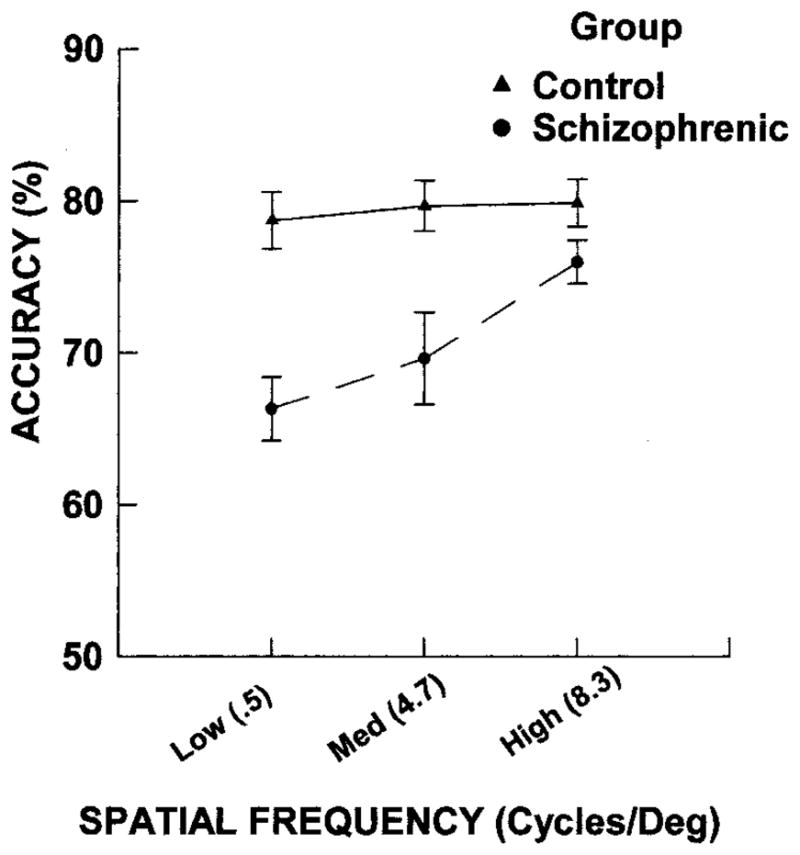
Mean accuracy and standard deviation for discrimination performance as a function of spatial frequency in the control and patient groups. Med = medium.
Correlational Analysis
Among the control subjects, there were no significant correlations between age or education and accuracy scores in any of the three spatial frequency conditions, nor among patients. The correlations of accuracy scores with age at onset, PANSS Negative, Positive, and Total Symptom scores, mental status, WAIS–R Information, and chlorpromazine equivalent dosage were also evaluated in the patient group. Later age of illness onset was associated with better performance on the high spatial frequency condition (r = .65, p < .01). More severe negative symptoms (r = −.51, p = .05) and the total PANSS score (r = −.62, p = .01) were associated with worse high spatial frequency discrimination. There was a trend for high spatial frequency performance to decline with higher chlorpromazine levels (r = −.46, p = .06). There were no significant correlations among any patient variable and discrimination accuracy scores for low and medium spatial frequencies.
Discussion
The aim of this study was to test whether patients with schizophrenia showed deficits for discrimination of different spatial frequencies at high levels of contrast. The results indicated that patients with schizophrenia show spatial frequency discrimination performance deficits and that this deficit increases as spatial frequency decreases. This differential deficit was unlikely to be due to differences in task demands because the conditions were matched in difficulty and number of items in control subjects. Although age of onset, symptom severity, and chlorpromazine equivalent dosage appeared to be related to high spatial frequency discrimination in patients, these factors were not associated with low spatial frequency performance. None of the patients had marked symptoms in early adolescence because these veterans entered military service prior to onset of the first episode of psychosis. This low spatial frequency deficit could reflect a transient channel deficit in sensory processing or a right hemisphere deficit that occurs after sensory processing.
Because the stimuli were presented for long durations and at high levels of contrast, this appears to be a specific disturbance of spatial frequency processing rather than a deficit secondary to slowed processing speed or poor contrast sensitivity. Hemisphere-specific mechanisms may contribute to these performance differences. Robertson and Ivry (Ivry & Robertson, 1998; Robertson & Ivry, 2000) have proposed a two-stage model for cortical spatial frequency processing. In the first stage, the range of spatial frequencies relevant to the task are selected. This process is equivalent between the two hemispheres, consistent with evidence that the right and left sensory cortex can represent equivalent ranges of spatial frequencies. The output of this stage is then used differentially by the two hemispheres. The right hemisphere acts as a low-pass filter, allowing more of the lower spatial frequency information to receive further processing, whereas the left hemisphere acts as a high-pass filter, allowing more high-frequency information to pass. The finding that sensitivity to angular disparity was greater at high compared to low spatial frequencies in the present study provides further evidence for utilization of different mechanisms. Consequently, the present results may reflect a disturbance of right hemisphere mechanisms involved in attending to low spatial frequencies in schizophrenia. This deficit may account for a behavioral bias toward visual details over contextual aspects of a complex stimulus and a failure of interpretation of overall spatial organization in a visual scene in schizophrenia. Both subjective and experimental evidence support such a deficit in spatial perception and attention in schizophrenia (Place & Gilmore, 1980; Wells & Leventhal, 1984). On the basis of subjective perceptual reports by patients with schizophrenia, Cutting and Dunne (1986) proposed that the change in perceptual experience in schizophrenic but not depressive, patients was best characterized as a breakdown in gestalt organizational processes, possibly secondary to right hemisphere dysfunction. On visual tasks of object counting for which strategies dependent on spatial organization are disadvantageous, patients with schizophrenia may actually outperform control subjects (Place & Gilmore, 1980; Wells & Leventhal, 1984).
These findings do not preclude abnormalities of left hemisphere processing on tasks designed to probe these systems. As reviewed previously, perceptual deficits are highly sensitive to task manipulations and can appear for analysis of details (Silverstein et al., 1996). Moreover, perceptual organization deficits can sometimes be eliminated by altering task conditions (Knight, Manoach, Elliott, & Hershenson, 2000). Consequently, perceptual deficits in schizophrenia may be influenced by the action of top-down attentional mechanisms.
Because the stimuli in this study were presented at high contrast and at long durations, they were not likely to tax transient channel mechanisms. Therefore, the present results are more consistent with a deficit in the second stage of the right hemisphere filter mechanism proposed by Robertson and Ivry (2000). A more definitive answer could be obtained by comparing suprathreshold spatial frequency discrimination with contrast sensitivity tests for the same set of spatial frequencies. If the tasks were matched on discriminating power, then a direct comparison of spatial frequency deficits across tasks could be carried out. Studies of contrast sensitivity in patients with schizophrenia have not yielded consistent results. Some investigators (Chen et al., 1999; Schwartz et al., 1987) have reported findings suggestive of a transient channel deficit, whereas others have found evidence for sustained channel abnormalities (Slaghuis, 1998). Matching these two approaches would be a challenging experimental goal because the tasks used to test spatial frequency discrimination and contrast sensitivity have different designs and use different dependent variables. (For a discussion of issues in matching tasks and processes, see Knight, 1992; Knight & Silverstein, 2001; and Chapman & Chapman, 2001.)
The neural basis for these visual disturbances remains to be delineated. Several lines of evidence suggest that visual processing is disturbed in schizophrenia at the cortical level. This includes photoelectric tomography (PET) and functional magnetic resonance imaging (fMRI) studies reporting hyperactivation of visual cortex to photic stimulation in schizophrenia (Renshaw, Yurgelun-Todd, & Cohen, 1994; Taylor, Tandon, & Koeppe, 1997), electrophysiological evidence of disturbed visual processing (Bruder et al., 1998), and neuropathological evidence of increased neuronal density in occipital area 17 (Selemon, Rajkowska, & Goldman-Rakic, 1995). Event-related potential and functional brain imaging techniques may be helpful in identifying a sensory deficit apparent in the occipital cortex, an attentional abnormality modulated by hemispheric mechanisms, or dysfunction in both systems.
Acknowledgments
This research was supported by National Alliance for Research on Schizophrenia and Depression Young Investigator Awards to Brian F. O’Donnell and Paul G. Nestor; Medical Research Service and Schizophrenia Center grants through the Department of Veterans Affairs to Robert W. McCarley; National Institute of Mental Health (NIMH) Independent Scientist Award K02 MH-01110-04 and NIMH FIRST Award R29 MH-50747-04 to Martha E. Shenton; NIMH Grant RO1 MH-62150-01 to Brian F. O’Donnell; and NIMH Grant R01 MH-40799 to Robert W. McCarley. We thank Arthur Bradley of the Indiana University School of Optometry for assisting in the review of literature relevant to human spatial frequency performance.
Contributor Information
Brian F. O’Donnell, Department of Psychology, Indiana University
Geoffrey F. Potts, Department of Psychology, Rice University
Paul G. Nestor, Department of Psychology, University of Massachusetts, and Psychiatry Service, Brockton Veterans Affairs (VA) Medical Center
Kiriaki C. Stylianopoulos, Department of Psychiatry, Harvard Medical School, and the Brockton VA Medical Center
Martha E. Shenton, Department of Psychiatry, Harvard Medical School, and the Brockton VA Medical Center
Robert W. McCarley, Department of Psychiatry, Harvard Medical School, and the Brockton VA Medical Center
References
- Bezchlibnyk-Butler KZ, Jeffries JJ. Clinical handbook of psychotropic drugs. 5. Seattle, WA: Hogrefe & Huber; 1996. [Google Scholar]
- Breitmeyer BG. Visual masking: An integrative approach. New York: Oxford University Press; 1984. [Google Scholar]
- Bruder G, Kayser J, Tenke C, Rabinowics E, Friedman M, Amador X, et al. Time course of visuospatial processing deficits in schizophrenia: An event-related potential study. Journal of Abnormal Psychology. 1998;3:399–411. doi: 10.1037//0021-843x.107.3.399. [DOI] [PubMed] [Google Scholar]
- Bunney WE, Hetrick WP, Bunney BG, Patterson JV, Jin Y, Potkin SG, Sandman CA. Structured Interview for Assessing Perceptual Anomalies (SIAPA) Schizophrenia Bulletin. 1999;25:577–592. doi: 10.1093/oxfordjournals.schbul.a033402. [DOI] [PubMed] [Google Scholar]
- Chapman LJ, Chapman JP. The measurement of differential deficit. Journal of Psychiatric Research. 1973;14:303–311. doi: 10.1016/0022-3956(78)90034-1. [DOI] [PubMed] [Google Scholar]
- Chapman LJ, Chapman JP. Commentary on two articles concerning generalized and specific cognitive deficits. Journal of Abnormal Psychology. 2001;110:31–39. doi: 10.1037//0021-843x.110.1.31. [DOI] [PubMed] [Google Scholar]
- Chen Y, Nakayama K, Levy DL, Matthysse S, Holzman PS. Psychophysical isolation of a motion-processing deficit in schizophrenics and their relatives and its association with impaired smooth pursuit. Proceedings of the National Academy of Sciences USA. 1999;96:4724–4729. doi: 10.1073/pnas.96.8.4724. [DOI] [PMC free article] [PubMed] [Google Scholar]
- Chen Y, Palafox GP, Nakayama K, Levy DL, Matthysse S, Holzman PS. Motion perception in schizophrenia. Archives of General Psychiatry. 1999;56:149–154. doi: 10.1001/archpsyc.56.2.149. [DOI] [PubMed] [Google Scholar]
- Christman S. Hemispheric asymmetry in the processing for spatial frequency: Experiments using gratings and bandpass filtering. In: Christman S, editor. Cerebral asymmetries in sensory and perceptual processing. Amsterdam, the Netherlands: Elsevier; 1997. pp. 3–30. [Google Scholar]
- Christman S, Kitterle FL, Hellige J. Hemispheric asymmetries in processing of absolute versus relative spatial frequency. Brain and Cognition. 1991;21:123–129. doi: 10.1016/0278-2626(91)90085-m. [DOI] [PubMed] [Google Scholar]
- Cutting J, Dunne F. The nature of abnormal perceptual experiences at the onset of schizophrenia. Psychopathology. 1986;19:347–352. doi: 10.1159/000284459. [DOI] [PubMed] [Google Scholar]
- Fiorentini A, Berardi N. Right-hemisphere superiority in the discrimination of spatial phase. Perception. 1984;13:695–708. doi: 10.1068/p130695. [DOI] [PubMed] [Google Scholar]
- First MB, Spitzer RL, Gibbon M, Williams JBW. Structured Clinical Interview for DSM–IV Axis I Disorders—Patient Edition. New York: New York State Psychiatric Institute; 1995. [Google Scholar]
- Folstein MF, Folstein SE, McHugh PR. Mini-Mental State. Journal of Psychiatric Research. 1975;12:189–198. doi: 10.1016/0022-3956(75)90026-6. [DOI] [PubMed] [Google Scholar]
- Greenlee MW, Thomas JP. Simultaneous discrimination of the spatial frequency and contrast of periodic stimuli. Journal of the Optical Society of America A. 1993;10:395–404. doi: 10.1364/josaa.10.000395. [DOI] [PubMed] [Google Scholar]
- Harris JP, Calvert JE, Leenertz JA, Phillipson OT. The influence of dopamine on spatial vision. Eye. 1990;4:806–812. doi: 10.1038/eye.1990.127. [DOI] [PubMed] [Google Scholar]
- Hellige JB. Hemispheric assymetry: What’s right and what’s left. Cambridge, MA: Harvard University Press; 1993. [Google Scholar]
- Hellige JB. Hemispheric asymmetry from components of visual information processing. In: Davidson RJ, Hugdahl K, editors. Brain asymmetry. Cambridge, MA: MIT Press; 1995. pp. 99–122. [Google Scholar]
- Hollingshead AB. Two-Factor Index of Social Position. New Haven, CT: Yale University Press; 1965. [Google Scholar]
- Ivry R, Robertson LC. The two sides of perception. Cambridge, MA: MIT Press; 1998. [Google Scholar]
- Kay SR, Opler LA, Fiszbein A. Positive and Negative Syndrome Scale (PANSS) North Tonawanda, NY: Multi-Health Systems; 1986. [Google Scholar]
- Kitterle FL, Christman S, Consesa J. Hemispheric differences in the interference among compound gratings. Perception and Psychophysics. 1993;54:785–793. doi: 10.3758/bf03211803. [DOI] [PubMed] [Google Scholar]
- Kitterle FL, Christman S, Hellige JB. Hemispheric differences are found in the identification, but not the detection, of low vs. high spatial frequencies. Perception and Psychophysics. 1990;48:297–306. doi: 10.3758/bf03206680. [DOI] [PubMed] [Google Scholar]
- Kitterle FL, Hellige JB, Christman S. Visual hemispheric asymmetries depend on which spatial frequencies are task relevant. Brain and Cognition. 1992;20:308–314. doi: 10.1016/0278-2626(92)90023-f. [DOI] [PubMed] [Google Scholar]
- Kitterle F, Selig L. Visual field effects in the discrimination of sine wave gratings. Perception and Psychophysics. 1991;50:15–18. doi: 10.3758/bf03212201. [DOI] [PubMed] [Google Scholar]
- Knight RA. Specifying cognitive deficiencies in premorbid schizophrenics. Progress in Experimental Personality and Psychopathology Research. 1992;15:252–289. [PubMed] [Google Scholar]
- Knight RA, Manoach DS, Elliott DS, Hershenson M. Perceptual organization in schizophrenia: The processing of symmetrical configurations. Journal of Abnormal Psychology. 2000;109:575–587. doi: 10.1037//0021-843x.109.4.575. [DOI] [PubMed] [Google Scholar]
- Knight RA, Silverstein SM. A process-oriented approach for averting confounds resulting from general performance deficiencies in schizophrenia. Journal of Abnormal Psychology. 2001;110:15–30. doi: 10.1037//0021-843x.110.1.15. [DOI] [PubMed] [Google Scholar]
- Legge GE. Sustained and transient mechanisms in human vision: Temporal and spatial properties. Vision Research. 1978;18:69–81. doi: 10.1016/0042-6989(78)90079-2. [DOI] [PubMed] [Google Scholar]
- Livingstone MS, Hubel DH. Psychophysical evidence for separate channels for the perception of form, color, movement, and depth. Journal of Neuroscience. 1987;7:3416–3468. doi: 10.1523/JNEUROSCI.07-11-03416.1987. [DOI] [PMC free article] [PubMed] [Google Scholar]
- Magnussen S, Greenlee MW, Asplund R, Dyrnes S. Perfect visual short-term memory for periodic patterns. European Journal of Cognitive Psychology. 1990;2:345–362. [Google Scholar]
- Merigan WH, Maunsell JHR. How parallel are the primate visual pathways? Annual Review of Neuroscience. 1993;16:369–402. doi: 10.1146/annurev.ne.16.030193.002101. [DOI] [PubMed] [Google Scholar]
- O’Brien RG, Kaiser MK. MANOVA method for analyzing repeated measures designs: An extensive primer. Psychological Bulletin. 1985;97:316–333. [PubMed] [Google Scholar]
- Peterzell D. On the nonrelation between spatial frequency and cerebral hemispheric competence. Brain and Cognition. 1991;15:62–68. doi: 10.1016/0278-2626(91)90015-z. [DOI] [PubMed] [Google Scholar]
- Peterzell DH, Harvey LO, Hardyck CD. Spatial frequencies and the cerebral hemipheres: Contrast sensitivity, visible persistence, and letter classification. 1989. [DOI] [PubMed] [Google Scholar]
- Phillipson OT, Harris JP. Perceptual changes in schizophrenia: A questionnaire survey. Psychological Medicine. 1985;15:859–866. doi: 10.1017/s0033291700005092. [DOI] [PubMed] [Google Scholar]
- Place EJS, Gilmore GE. Perceptual organization in schizophrenia. Journal of Abnormal Psychology. 1980;89:409–418. doi: 10.1037//0021-843x.89.3.409. [DOI] [PubMed] [Google Scholar]
- Pollen DA, Lee JA, Taylor JH. How does the striate cortex begin the reconstruction of the visual world? Science. 1971;173:74–77. doi: 10.1126/science.173.3991.74. [DOI] [PubMed] [Google Scholar]
- Renshaw PF, Yurgelun-Todd DA, Cohen BM. Greater hemodynamic response to photic stimulation in schizophrenic patients: An echo planar MRI study. American Journal of Psychiatry. 1994;151:1493–1495. doi: 10.1176/ajp.151.10.1493. [DOI] [PubMed] [Google Scholar]
- Robertson LC, Ivry R. Hemispheric asymmetries: Attention to visual and auditory primitives. Current Directions in Psychological Science. 2000;9:59–63. [Google Scholar]
- Schiller PH, Logothetis NK, Charles ER. Functions of the color opponent and broad-band channels of the visual system. Nature. 1990;343:68–70. doi: 10.1038/343068a0. [DOI] [PubMed] [Google Scholar]
- Schwartz BD, McGinn T, Winstead DK. Disordered spatiotemporal processing in schizophrenics. Biological Psychiatry. 1987;22:688–698. doi: 10.1016/0006-3223(87)90200-9. [DOI] [PubMed] [Google Scholar]
- Selemon LD, Rajkowska G, Goldman-Rakic PS. Abnormally high neuronal density in the schizophrenic cortex. Archives General Psychiatry. 1995;52:805–818. doi: 10.1001/archpsyc.1995.03950220015005. [DOI] [PubMed] [Google Scholar]
- Sergent J. The role of the input in visual hemispheric asymmetries. Psychological Bulletin. 1983;93:481–514. [PubMed] [Google Scholar]
- Silverstein SM, Knight RA, Schwarzkopf SB, West LL, Osborn LM, Kamin D. Stimulus configuration and context effects in perceptual organization in schizophrenia. Journal of Abnormal Psycholology. 1996;105:410–420. doi: 10.1037//0021-843x.105.3.410. [DOI] [PubMed] [Google Scholar]
- Slaghuis WL. Contrast sensitivity for stationary and drifting spatial frequency gratings in positive- and negative-symptom schizophrenia. Journal of Abnormal Psycholology. 1998;107:49–62. doi: 10.1037//0021-843x.107.1.49. [DOI] [PubMed] [Google Scholar]
- Stevens J. Applied multivariate statistics for the social Sciences. 3. Mahwah, NJ: Erlbaum; 1996. [Google Scholar]
- Taylor SF, Tandon R, Koeppe RA. PET study of greater visual activation in schizophrenia. American Journal of Psychiatry. 1997;154:1296–1298. doi: 10.1176/ajp.154.9.1296. [DOI] [PubMed] [Google Scholar]
- Wandell BA. Foundations of vision. Sunderland, MA: Sinauer; 1995. [Google Scholar]
- Watten RG, Magnussen S, Greenlee MW. Spatial-frequency discrimination, brain lateralisation, and acute intake of alcohol. Perception. 1998;27:729–736. doi: 10.1068/p270729. [DOI] [PubMed] [Google Scholar]
- Wechsler D. The Wechsler Adult Intelligence Scale—Revised. New York: Psychological Corporation; 1981. [Google Scholar]
- Wells DS, Leventhal D. Perceptual grouping in schizophrenia: Replication of Place and Gilmore. Journal of Abnormal Psychology. 1984;93:231–234. doi: 10.1037//0021-843x.93.2.231. [DOI] [PubMed] [Google Scholar]