SYNOPSIS
Objective
We examined disparities in diabetes-related mortality for socioeconomic status (SES) groups in nationally representative U.S. samples.
Methods
We analyzed National Health Interview Survey respondents linked to their death records and included those eligible for mortality follow-up who were aged 25 years and older at the time of interview and not missing information on covariates (n=527,426). We measured SES by education and family income. There were 5,613 diabetes-related deaths.
Results
Having less than a high school education was associated with a twofold higher mortality from diabetes, after controlling for age, gender, race/ethnicity, marital status, and body mass index, compared with adults with a college degree or higher education level (relative hazard [RH] = 2.05, 95% confidence interval [CI] 1.78, 2.35). Having a family income below poverty level was associated with a twofold higher mortality after adjustments compared with adults with the highest family incomes (RH=2.41, 95% CI 2.05, 2.84). Approximately one-quarter of the excess risk among those in the lowest SES categories was explained by adjusting for potential confounders.
Conclusion
Findings from this nationally representative cohort demonstrate a socioeconomic gradient in diabetes-related mortality, with both education and income being important determinants of the risk of death.
Diabetes has remained one of the top 10 leading causes of death in the United States since the 1980s1 and is one of six focus areas of the Department of Health and Human Services' (HHS) initiative to eliminate health disparities.2 Furthermore, one of the goals of Healthy People 2010 is to eliminate health disparities, including the well-known differences that occur by gender and race/ethnicity, and also by socioeconomic characteristics, such as education or income.
In general, in the U.S. we know less about the extent of socioeconomic differences in diabetes-related mortality due in large part to the paucity of data sources that contain health, mortality, and socioeconomic information. Currently, Healthy People 2010 tracks progress toward eliminating socioeconomic disparities in diabetes-related mortality only for education groups, using data from the National Vital Statistics System, as education level is listed on the death certificate.3 Yet, such data have limitations for examining socioeconomic disparities, including a lack of correspondence between the education information in the numerator and denominator,4 issues with the quality of education information on death certificates,5 and, finally, the absence of information on family income.
There are few prospective studies of socioeconomic differences in diabetes mortality in the U.S., with those available often limited by examining only one socioeconomic indicator or not adjusting for other important sociodemographic and health factors. For example, a study of American Cancer Society cohorts (1959–1972 and 1982–1996) found an inverse gradient for education and diabetes mortality for both time periods, but information on income or race/ethnicity was not included.6 Using the National Longitudinal Mortality Study for 1979–1989, researchers found a strong inverse relationship between family income and diabetes mortality among both men and women, but other sociodemographic and health risk factors were not considered.7 An analysis of the National Health Interview Survey (NHIS) and Linked Mortality Files data from 1987 to 1997 also found an inverse gradient for education and income associated with diabetes mortality, but did not adjust for race/ethnicity.8
This article addresses several of these limitations by examining socioeconomic differences in diabetes-related mortality, as indicated by both educational attainment and family income, as each may provide greater understanding of the pathways (biological, behavioral, and social) that link socioeconomic status (SES) to diabetes mortality.9 Also, our study is based upon a nationally representative sample of adults in the U.S. who participated in the NHIS from 1990 to 2000 and had their mortality status ascertained through 2002, allowing for self-report of education and income as well as other sociodemographic and health information.
METHODS
Data sources
We used data from the NHIS and the NHIS Linked Mortality Files. The NHIS is a continuous, cross-sectional, in-person, household interview survey of the civilian noninstitutionalized U.S. population that collects high-quality social, demographic, and health information. The sample size from 1990 to 2000 was approximately 100,000 people each year, with the exception of 1996, which was a reduced sample of approximately 63,000 people. The annual response rate of NHIS is close to 90% of the eligible households in the sample. Descriptions of the NHIS design have been published elsewhere.10,11
The National Center for Health Statistics (NCHS) periodically conducts mortality follow-up for eligible NHIS participants through probabilistic record linkage to the National Death Index (NDI), which maintains a national file of death certificate records collected from state vital statistics offices.12 A complete description of the methodology used to link NHIS records to the NDI can be found elsewhere.13 We combined 11 years of the NHIS (1990–2000) that had mortality follow-up for eligible participants from the time of their interview through December 31, 2002. Starting with the 1997 NHIS, a major revision of the instrument occurred. The survey switched to a data collection system using computer-assisted personal interviews, and the questionnaire was redesigned, with some items being collected by self-report only as compared with proxy report.10 We utilized the restricted versions of the files so as to have more complete information on age, interview date, and death date.14
Baseline assessments
Participants' age, gender, race/ethnicity (non-Hispanic white, non-Hispanic black, or Hispanic), marital status (married, never married, or divorced/separated/widowed), height, and weight were self-reported at the time of the NHIS interview or reported by a family member. We calculated body mass index (BMI) as weight in kilograms per square meter (kg/m2) of height for each participant and categorized participants based on BMI as underweight (BMI <18.50 kg/m2), normal weight (BMI 18.50–24.99 kg/m2), overweight (BMI 25.00–29.99 kg/m2), obese (BMI 30.00–34.99 kg/m2), or extremely obese (BMI ≥35.00 kg/m2).
Socioeconomic measures
For indicators of individual SES, we chose educational attainment and family income of the NHIS participant, which were reported (by participant or family member) at the time of the NHIS interview.
Both education and family income have demonstrated a nonlinear association with overall mortality.15 Education was measured in the NHIS as the number of years of schooling (1990–1996 surveys) or the highest level of education completed (1997–2000 surveys), which we described by four categories representing attained educational credentials: (1) less than a high school diploma (<12 years of school); (2) high school diploma or general educational development (GED) equivalent (12 years of school), (3) having some college (13–15 years of school), and (4) having completed at least a college degree (≥16 years of school).9,16
Family income was represented by the ratio of income to the federal poverty level (FPL). We chose the ratio of family income to poverty thresholds because it takes into account family size and changes in the consumer price index over time. The NHIS's detailed annual family income question has a substantial amount of missing data: approximately 16% to 18% of these data are missing for the NHIS years 1990–1996 and 20% to 29% of these data are missing for the years 1997–2000. This loss of sample data due to missing values is problematic because deleting a large proportion of respondents raises questions about population generalizability (a strength of the NHIS) and is likely to introduce bias. For those not reporting their income, we used imputed values based upon a single imputation provided by NCHS.17,18 We used five cut-points for income: <100% FPL (below poverty), 100% to 199% FPL (near poor), 200% to 299% FPL, 300% to 399% FPL, and ≥400% FPL.
Diabetes-related mortality
Death of NHIS participants was ascertained through December 31, 2002. We included deaths that had diabetes as an underlying or contributing cause of death listed on the death certificate (n=5,613).
Statistical methods
We weighted all analyses to the U.S. population to provide nationally representative estimates using the sample weights provided for each year by NHIS to take into account oversampling of non-Hispanic black and Hispanic populations.10,11 We used SUDAAN® version 9.119 statistical software to account for the NHIS complex survey design. We restricted all analyses to those eligible for mortality follow-up—i.e., those who were at least 25 years of age at the time of the NHIS interview to prevent misclassification due to changing education status; who were non-Hispanic white, non-Hispanic black, or Hispanic; and who had no missing values for cause of death or other covariates (n=527,426).
We compared participants' baseline assessments and SES measures by education and family income categories separately, using a χ2 test. We considered p<0.05 to be statistically significant. We calculated age-adjusted diabetes-related mortality rates per 100,000 person-years at risk by gender and race/ethnicity and by categories of educational attainment and family income. We age-standardized mortality rates using the direct method and the 2000 U.S. population, applying the following age groups in years: 25–34, 35–44, 45–54, 55–64, 65–74, and ≥75.1 We used Cox proportional hazards models to examine the relationship between our two SES indicators and diabetes-related mortality risk and to calculate the relative hazard (RH).20 We used age as the timescale for analysis, with left truncation. Participants were entered at their age at interview and were censored at the end of follow-up if they were still alive. If a participant died from causes other than diabetes, they were censored at their age at death. The mean duration of the follow-up period was 6.4 years.
To determine whether differences in diabetes-related mortality by education or family income could be explained by other variables, we constructed a series of proportional hazards models for each socioeconomic indicator separately and then with both measures in the model. Our basic model included only the socioeconomic indicator, either education level or family income; the next model adjusted for gender, race/ethnicity, and marital status; and then we included BMI. Also, we included both socioeconomic measures in a model adjusted for all other covariates. Finally, we examined SES differences in diabetes-related mortality stratified by age at NHIS interview (25–64 years and ≥65 years). We calculated the percent explained by the covariates in the model using the following formula:21
 |
We tested for multiplicative interactions between gender and our SES indicators as well as race/ethnicity and our SES indicators, and none was statistically significant at the p<0.05 level.
RESULTS
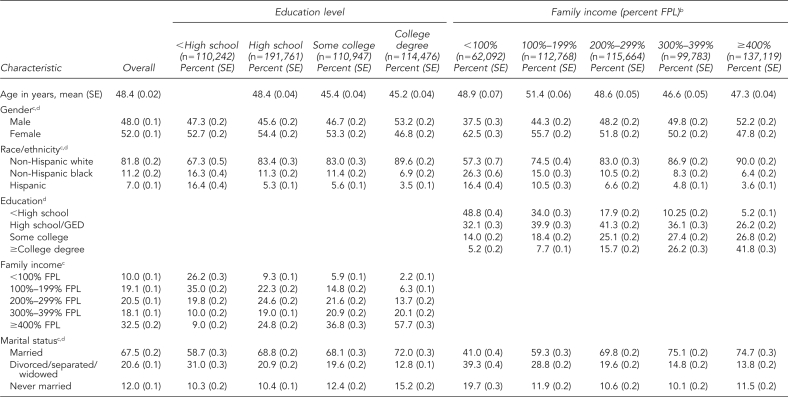
The baseline characteristics of the weighted study population of adults aged 25 years or older in the NHIS from 1990 to 2000 are shown in Table 1. The mean age was 48 years. The sample had slightly more women (52%) than men and was predominantly non-Hispanic white (82%). Two-thirds of the sample participants were married. Roughly one-third were overweight and 13% were obese, with almost 7% being extremely obese. Approximately one-third had completed high school or a GED equivalency, with nearly one-quarter having some college and another quarter having completed a college degree. Ten percent had family incomes <100% FPL, 20% had incomes at 100% to 199% FPL, and approximately one-third had family incomes at ≥400% FPL. Participants' characteristics were significantly different (p<0.001) by education level and family income. Women, non-Hispanic black and Hispanic people, and obese people were more likely to have a high school diploma or less education and to be in lower-income categories.
Table 1.
Baseline characteristics, overall and by socioeconomic status, of 527,426 adults aged 25 years and older in the National Health Interview Survey, U.S., 1990–2000a
aResults are reported as weighted percentages (SE) except for age, which is reported as the mean value (SE).
bFamily income is presented as the ratio of reported income to FPL and includes imputed values for those not reporting income.
cStatistically different across education categories based upon χ2, p<0.001
dStatistically different across family income categories based upon χ2, p<0.001
eUnderweight defined as BMI <18.50 kg/m2, normal weight defined as BMI 18.50–24.99 kg/m2, overweight defined as BMI 25.00–29.99 kg/m2, obese defined as BMI 30.00–34.99 kg/m2, and extremely obese defined as BMI ≥35.00 kg/m2
SE = standard error
FPL = federal poverty level
GED = general educational development
BMI = body mass index
kg/m2 = kilograms per square meter
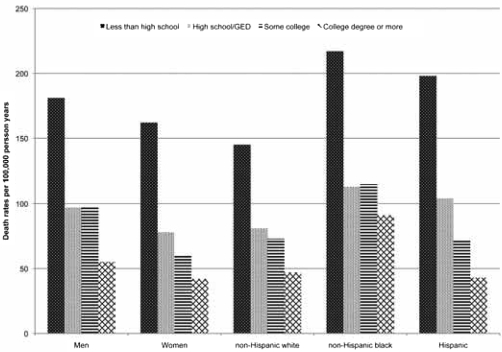
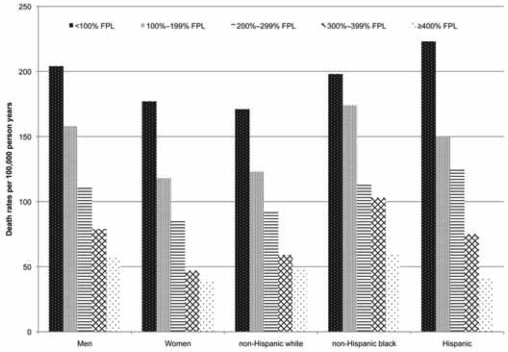
Figures 1 and 2 show age-adjusted diabetes-related mortality rates by education level and family income attained at baseline, respectively, by gender and race/ethnicity. For both SES indicators, there was an inverse gradient with decreasing diabetes-related mortality as attained education level or family income increased. The pattern was generally consistent for men and women and across racial/ethnic groups, with the single exception of the education pattern for non-Hispanic black people.
Figure 1.
Diabetes-related mortality by education level among adults aged 25 years and older in the National Health Interview Survey Linked Mortality Filesa
aAge-adjusted to the standard U.S. population using the following age groups in years (25–34, 35–44, 45–54, 55–64, 65–74, and ≥75)
GED = general educational development
Figure 2.
Diabetes-related mortality by income level among adults aged 25 years and older in the National Health Interview Survey Linked Mortality Filesa
aAge-adjusted to the standard U.S. population using the following age groups in years (25–34, 35–44, 45–54, 55–64, 65–74, and ≥75)
FPL = federal poverty level
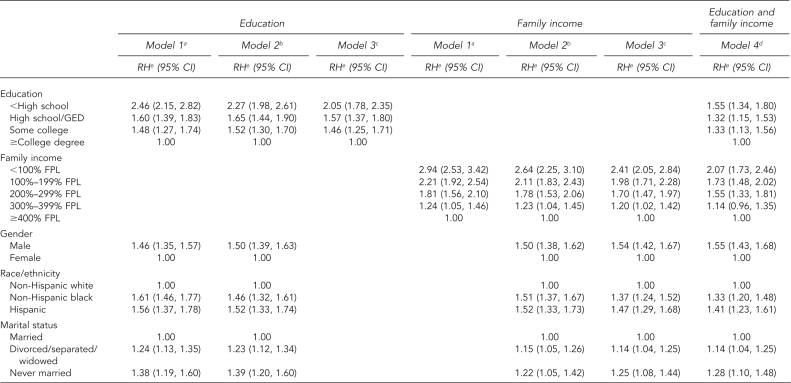
Table 2 presents the results from the proportional hazards models for the risk of diabetes-related mortality by education level and family income attained at baseline. The RH for diabetes-related death for those with less than a high school education was about 2.5 times that of those with a college degree or higher level of education (Education, Model 1: RH=2.46, 95% confidence interval [CI] 2.15, 2.82). The association of education to diabetes-related death was attenuated when controlling for other factors; however, even controlling for gender, race/ethnicity, and BMI, the risk of diabetes-related death for those with less than a high school education was two times greater compared with those with at least a college degree (Education, Model 3: RH=2.05, 95% CI 1.78, 2.35). In addition, the risk of diabetes-related death demonstrated a clear gradient from lowest to highest education level. Adjusting for all the potential confounders explained 28% of the excess risk of diabetes-related mortality among those with less than a high school education and explained 5% of the excess risk among those who had either completed high school or some college.
Table 2.
Risk of diabetes-related mortality by socioeconomic status for 527,426 adults aged 25 years and older in the National Health Interview Survey Linked Mortality Files, U.S., 1990–2002
aModel 1: socioeconomic status indicator only
bModel 2: socioeconomic status indicator and demographic characteristics
cModel 3: socioeconomic status indicator, demographic characteristics, and BMI
dModel 4: both socioeconomic status indicators and fully adjusted for all other variables in model
eRelative hazards are based on the Cox proportional hazards model with age as the time scale.
fUnderweight defined as BMI <18.50 kg/m2, normal weight defined as BMI 18.50–24.99 kg/m2, overweight defined as BMI 25.00–29.99 kg/m2, obese defined as BMI 30.00–34.99 kg/m2, and extremely obese defined as BMI ≥35.00 kg/m2
RH = relative hazard
CI = confidence interval
GED = general educational development
FPL = federal poverty level
BMI = body mass index
kg/m2 = kilograms per square meter
The RH for diabetes-related death for those with family incomes <100% FPL was about three times that of those with family incomes of ≥400% FPL (Family income, Model 1: RH=2.94, 95% CI 2.53, 3.42). Again, the association was attenuated with control for other factors, but still remained robust. The risk of diabetes-related death for those with family incomes <100% FPL remained more than two times greater compared with those with the highest family incomes (Family income, Model 3: RH=2.41, 95% CI 2.05, 2.84). For those with family incomes of 200% to 299% FPL, the RH was 1.70 (95% CI 1.47, 1.97) compared with those with the highest incomes. Potential confounders included in our model explained 27% of the excess risk among those with family incomes <100% FPL. Including both education and family income in the model attenuated the risks for each SES indicator (Table 2, Model 4), but the relationship of education and family income to diabetes-related mortality remained statistically significant and the marked gradient persisted for each SES indicator.
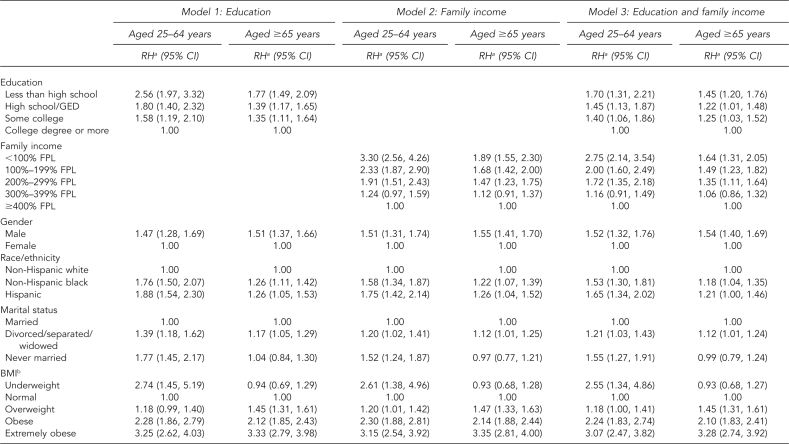
Table 3 presents the results from the proportional hazards models stratified by age. The association between education and family income to the risk of diabetes-related mortality was stronger among those aged 25–64 years compared with those aged ≥65 years. Adjusting for age, gender, race/ethnicity, marital status, and BMI, those aged 25–64 years with less than a high school education had an RH of 2.56 (95% CI 1.97, 3.32) compared with those with at least a college degree, whereas those aged ≥65 years had an RH of 1.77 (95% CI 1.49, 2.09). Similarly, those aged 25–64 years with family incomes <100% FPL had an RH of 3.30 (95% CI 2.56, 4.26) compared with those with incomes of ≥400% FPL, while those aged ≥65 years had an RH of 1.89 (95% CI 1.55, 2.30). Including both education and income in the model further attenuated the results, but the estimates remained statistically significant, and the gradient of diabetes-related mortality with education level and family income remained in both age groups.
Table 3.
Risk of diabetes-related mortality by socioeconomic status for adults aged 25 to 64 years (n=419,554) and aged >65 years (n=107,872) in the National Health Interview Survey Linked Mortality Files, U.S., 1990–2002
aRelative hazards are based on the Cox proportional hazards model with age as the time scale.
bUnderweight defined as BMI <18.50 kg/m2, normal weight defined as BMI 18.50–24.99 kg/m2, overweight defined as BMI 25.00–29.99 kg/m2, obese defined as BMI 30.00–34.99 kg/m2, and extremely obese defined as BMI ≥35.00 kg/m2
RH = relative hazard
CI = confidence interval
GED = general educational development
FPL = federal poverty level
BMI = body mass index
kg/m2 = kilograms per square meter
Sensitivity analyses
We conducted several sensitivity analyses. We restricted diabetes mortality to deaths indicated only as an underlying cause (n=1,835), and the overall pattern of results remained the same. We examined the effect of using imputed income on our results by using only reported income and dropping the approximately 14.0% with unknown income from the sample, and the results were essentially unchanged. Finally, we restricted the sample to those with smoking information (n=236,790) and included smoking status (current, former, or never) as a covariate, but again, the results remained unchanged.
DISCUSSION
A socioeconomic gradient exists in diabetes-related mortality in the U.S., with both education and income being important determinants of the risk of death associated with this disease. In models adjusted for age, sociodemographic characteristics, and BMI, adults with less than a high school education had a risk of diabetes-related mortality that was twice that of those with a college degree, and those living in poverty had a risk that was 2.4 times that of those with an income ≥400% FPL. However, the increased risk was not present just for those with the lowest SES, but rather an increased risk for diabetes-related mortality existed for all levels of education compared with adults who had a college degree and all levels of income compared with adults with family incomes ≥400% FPL.
Our findings add further support to previous observations of SES disparities in diabetes mortality in the U.S. Studies based upon vital statistics data have found age-adjusted diabetes-related mortality rates to be two to three times higher for those with less than a high school education compared with those with more than a high school education.22,23 Compared with other prospective studies, we found a stronger relationship between education and diabetes mortality. An American Cancer Society study of men and women aged 45 years and older reported a nonsignificant RH of 1.13 and 1.18 for men and women, respectively, with a high school degree compared with those with a college degree.6 Rogers and colleagues,8 using an earlier mortality linkage of the NHIS, found an RH of 1.17 for high school graduates compared with those with some college. However, both studies focused on diabetes mortality only as the underlying cause of death and had baseline data collected in the mid-1980s.
Limitations
Several limitations of this study need to be considered. Previous studies have demonstrated an underreporting of diabetes on death certificates,24,25 and it is not known whether diabetes reporting on death certificates differs by social and economic characteristics in the U.S. However, the U.K. Prospective Diabetes Study did find that diabetes coding on death certificates differed by social class. In this study, participants in the lower social class had a 1.5-fold increased likelihood of having diabetes reported on their death certificate compared with people in the professional or managerial class.26 Also, the NHIS relies on self-reported height and weight to calculate BMI, and from 1990 to 1996 a family member may have reported the data. Although studies have shown, in general, good correlation between self--reported and measured height and weight, self-reported height and weight has been shown to underestimate measured BMI among individuals who are obese and overestimate BMI among individuals who are underweight, with variations in reporting bias by social and demographic characteristics.27–29 However, studies in the U.S. and Canada have found that differences in self-reported and measured height and weight did not differ by SES.27,29 Finally, SES was reported only at baseline. While educational attainment was likely to change little during the course of follow-up because we excluded those younger than 25 years of age, family income likely changed during the study period.
Strengths
This study also had several strengths. These findings are based upon the most recently available nationally representative cohorts of the noninstitutionalized U.S. population with mortality information, which is valuable for efforts to monitor overall patterns and trends in diabetes mortality. Also, we examined more than one SES indicator, with the large effects of family income being noteworthy, given that most studies have focused on education due to both data availability and the fact that education level is likely important because of health literacy, prevention messages, and disease management. Also, the NHIS allows a sufficient sample size to examine differences in diabetes-related mortality across the entire socioeconomic gradient, not just those at the lowest end of the distribution. This level of SES detail is important to reach a more complete understanding of the role of SES in the causes of diabetes as well as its prevention and management, which, in turn, may lead to interventions and treatments that will reduce diabetes-related mortality.
The implications of our findings must be considered within the context of the time period available for examination. Our findings apply to the period 1990 through 2002, when diabetes-related mortality was increasing, which reflects the most recent mortality follow-up data available. Diabetes-related deaths increased from the mid-1980s through 2003, but more recently, diabetes-related mortality has decreased slightly and stabilized.3,23,30 Although we cannot say whether the effect of SES would remain the same against this backdrop of flattening rates, we do know that while this pattern has occurred for white, black, and Hispanic racial/ethnic groups as well as for both men and women, the mortality disparity between white people vs. black and Hispanic people and between men and women has remained very consistent since 1998.23 Also, we did not explore the effect of SES on diabetes mortality specifically among those with diagnosed diabetes. The recent observed decline in diabetes-related mortality among people with diagnosed diabetes suggests that this issue warrants further research.3
CONCLUSION
Reducing overall diabetes mortality and disparities in diabetes mortality remains an important goal for federal programs.3,31 Currently, the Healthy People 2010 objective to reduce the diabetes-related death rate to 45 deaths per 100,000 population is not being met for those with the lowest education levels, and there is no objective based upon income.3 The National Diabetes Education Program aims to reduce the morbidity and mortality associated with diabetes and includes programs focused on reducing disparities by race/ethnicity, but there is less focus on SES as a major source of disparities.31 Diabetes mortality research provides guidance for primary, secondary, and tertiary diabetes prevention efforts; yet, failure to address the important role that SES plays in diabetes mortality will likely hamper efforts to reduce disparities in diabetes and its adverse sequelae.
Footnotes
The views and interpretations presented in this article are those of the authors and do not necessarily represent the official position of the Centers for Disease Control and Prevention.
REFERENCES
- 1.National Center for Health Statistics (US). Health, United States, 2007 with chartbook on trends in the health of Americans. Hyattsville (MD): NCHS; 2007. [PubMed] [Google Scholar]
- 2.Centers for Disease Control and Prevention (US), Office of Minority Health and Health Disparities. Eliminating racial and ethnic health disparities. [cited 2009 Aug 17]. Available from: URL: http://www.cdc.gov/omhd/About/disparities.htm.
- 3.Centers for Disease Control and Prevention (US) [cited 2010 Jan 11];Healthy People 2010: progress review: diabetes. Available from: URL: http://www.cdc.gov/nchs/healthy_people/hp2010/focus_areas/fa05_diabetes2.htm. [Google Scholar]
- 4.Kunst AE, Groenhof F, Borgan JK, Costa G, Desplanques G, Faggiano F, et al. Socio-economic inequalities in mortality. Methodological problems illustrated with three examples from Europe. Rev Epidemiol Sante Publique. 1998;46:467–79. [PubMed] [Google Scholar]
- 5.Sorlie PD, Johnson NJ. Validity of education information on the death certificate. Epidemiology. 1996;7:437–9. doi: 10.1097/00001648-199607000-00017. [DOI] [PubMed] [Google Scholar]
- 6.Steenland K, Henley J, Thun M. All-cause and cause-specific death rates by educational status for two million people in two American Cancer Society cohorts, 1959–1996. Am J Epidemiol. 2002;156:11–21. doi: 10.1093/aje/kwf001. [DOI] [PubMed] [Google Scholar]
- 7.Pamuk E, Makuc D, Heck K, Reuben C, Lochner K. Socioeconomic status and health chartbook. Health, United States, 1998. Hyattsville (MD): National Center for Health Statistics (US); 1998. [Google Scholar]
- 8.Rogers RG, Hummer RA, Krueger PM. The effect of obesity on overall, circulatory disease- and diabetes-specific mortality. J Biosoc Sci. 2003;35:107–29. [PubMed] [Google Scholar]
- 9.Braveman PA, Cubbin C, Egerter S, Chideya S, Marchi KS, Metzler M, et al. Socioeconomic status in health research: one size does not fit all. JAMA. 2005;294:2879–88. doi: 10.1001/jama.294.22.2879. [DOI] [PubMed] [Google Scholar]
- 10.Botman SL, Moore TF, Moriarity CL, Parsons VL. Design and estimation for the National Health Interview Survey, 1995–2004. Vital Health Stat 2. 2000;130 [Google Scholar]
- 11.Massey JT. Redesigning the National Health Interview Survey. Vital Health Stat 2. 1989;110 [PubMed] [Google Scholar]
- 12.National Center for Health Statistics (US) National death index. [cited 2008 Sep 2]. Available from: URL: http://www.cdc.gov/nchs/ndi.htm.
- 13.National Center for Health Statistics (US), Office of Analysis and Epidemiology. The 1986–2000 National Health Interview Survey Linked Mortality Files: matching methodology. Hyattsville (MD): NCHS; 2005. [Google Scholar]
- 14.Lochner K, Hummer RA, Bartee S, Wheatcroft G, Cox C. The public-use National Health Interview Survey Linked Mortality Files: methods of reidentification risk avoidance and comparative analysis. Am J Epidemiol. 2008;168:336–44. doi: 10.1093/aje/kwn123. [DOI] [PMC free article] [PubMed] [Google Scholar]
- 15.Backlund E, Sorlie PD, Johnson NJ. A comparison of the relationships of education and income with mortality: the National Longitudinal Mortality Study. Soc Sci Med. 1999;49:1373–84. doi: 10.1016/s0277-9536(99)00209-9. [DOI] [PubMed] [Google Scholar]
- 16.Lynch J, Kaplan G. Socioeconomic position. In: Berkman LK, Kawachi I, editors. Social epidemiology. New York: Oxford University Press; 2000. pp. 13–35. [Google Scholar]
- 17.National Center for Health Statistics (US) National Health Interview Survey, imputed annual family income 1990–96. [cited 2008 Sep 2]. Available from: URL: http://www.cdc.gov/nchs/products/elec_prods/subject/impute.htm.
- 18.National Center for Health Statistics (US) 1997 imputed family income/personal earnings files. [cited 2010 Jan 11]. Available from: URL: http://www.cdc.gov/nchs/data/nhis/tecdoc.pdf.
- 19.Research Triangle Institute. SUDAAN® Version 9.01. Research Triangle Park (NC): Research Triangle Institute; 2005. [Google Scholar]
- 20.Cox DR. Regression models and life tables. J Royal Statistical Society 1972;Series B. 34:187–220. [Google Scholar]
- 21.Szklo M, Nieto FJ. Epidemiology: beyond the basics. 2nd ed. Boston: Jones – Bartlett Publishers; 2007. [Google Scholar]
- 22.Miech RA, Kim J, McConnell C, Hamman RF. A growing disparity in diabetes-related mortality U.S. trends, 1989–2005. Am J Prev Med. 2009;36:126–32. doi: 10.1016/j.amepre.2008.09.041. [DOI] [PMC free article] [PubMed] [Google Scholar]
- 23.Centers for Disease Control and Prevention (US) Data2010: the Healthy People 2010 database. [cited 2008 Oct 6]. Available from: URL: http://wonder.cdc.gov/DATA2010.
- 24.Cheng WS, Wingard DL, Kritz-Silverstein D, Barrett-Connor E. Sensitivity and specificity of death certificates for diabetes: as good as it gets? Diabetes Care. 2008;31:279–84. doi: 10.2337/dc07-1327. [DOI] [PMC free article] [PubMed] [Google Scholar]
- 25.Saydah SH, Geiss LS, Tierney E, Benjamin SM, Engelgau M, Brancati F. Review of the performance of methods to identify diabetes cases among vital statistics, administrative, and survey data. Ann Epidemiol. 2004;14:507–16. doi: 10.1016/j.annepidem.2003.09.016. [DOI] [PubMed] [Google Scholar]
- 26.Thomason MJ, Biddulph JP, Cull CA, Holman RR. Reporting of diabetes on death certificates using data from the UK Prospective Diabetes Study. Diabet Med. 2005;22:1031–6. doi: 10.1111/j.1464-5491.2005.01584.x. [DOI] [PubMed] [Google Scholar]
- 27.Craig BM, Adams AK. Accuracy of body mass index categories based on self-reported height and weight among women in the United States. Matern Child Health. 2009;13:489–96. doi: 10.1007/s10995-008-0384-7. [DOI] [PMC free article] [PubMed] [Google Scholar]
- 28.Kuczmarski MF, Kuczmarski RJ, Najjar M. Effects of age on validity of self-reported height, weight, and body mass index: findings from the Third National Health and Nutrition Examination Survey, 1988–1994. J Am Diet Assoc. 2001;101:28–34. doi: 10.1016/S0002-8223(01)00008-6. [DOI] [PubMed] [Google Scholar]
- 29.Shields M, Gorber SC, Tremblay MS. Estimates of obesity based on self-report versus direct measures. Health Rep. 2008;19:61–76. [PubMed] [Google Scholar]
- 30.National Center for Health Statistics (US). Healthy People 2000 final review. Hyattsville (MD): NCHS; 2001. [Google Scholar]
- 31.Department of Health and Human Services (US) National Diabetes Education Program (NDEP) [cited 2010 Jan 11]. Available from: URL: http://ndep.nih.gov.


