

Abstract
We report the first use of ultrasonic standing waves to achieve cell cycle phase synchronization in mammalian cells in a high-throughput and reagent-free manner. The acoustophoretic cell synchronization (ACS) device utilizes volume-dependent acoustic radiation force within a microchannel to selectively purify target cells of desired phase from an asynchronous mixture based on cell cycle-dependent fluctuations in size. We show that ultrasonic separation allows for gentle, scalable and label-free synchronization with high G1 phase synchrony (~84%) and throughput (3×10⁶ cells/hour/microchannel).
The capability to synchronize a population of asynchronous cells into a particular phase in their cell cycle is of paramount importance in biomedical research. For example, synchronization-based studies of cancer cells have enabled the discovery of cellular proliferation factors1 and cell-cycle regulation factors.2,3 For cancer therapeutics development, achieving effective synchrony of the tumor cell samples is critical to understanding their response to chemotherapeutics because many anticancer drugs target cells in a particular phase.4,5 The cell cycle generally consists of four phases—G1 (gap 1), S (synthesis), G2 (gap 2) and M (mitosis)— and it is well known that for almost all cell types, their size is highly correlated to their phase.6,7 Currently, the most prevalent method for cell synchronization is the chemical arrest and release technique,8-10 wherein cells are treated with metabolic agents that block the cell cycle at a particular point, driving phase-specific accumulation, after which a second reagent is used to release the cells and thereby achieve synchrony. Though effective, this method suffers from a critical drawback in that it affects the physiology of the cells in ways that could undermine their usefulness as accurate models of normal cellular events.11,12 Centrifugal elutriation9,13 offers a less invasive approach,14 but it requires time-consuming sample preparation, suffers from low throughput and imposes mechanical stress on the cells.15
Microfluidics technology offers a promising alternative to conventional methods of cell synchronization because it allows accurate control of fluidic and separation forces in a reproducible manner.16 Recent efforts have explored a number of different separation forces in microchannels for cell synchronization, including dielectrophoresis17 and hydrophoresis,18 but the low throughput of both approaches (<400 μl/hr, ~2.5×10⁵ cells/hour/microchannel) have limited their utility. In an effort to develop a non-invasive, high purity method that can also operate at a higher throughput, we report here the first use of ultrasonic standing waves for cell synchronization. The acoustophoretic cell synchronization (ACS) device uses a volume-dependent acoustic radiation force to isolate and purify mammalian cells based on cell-cycle phase into independent outlets at both high G1 phase synchrony (~84%) and high throughput (3×10⁶ cells/hour/microchannel).
Materials and Methods
Device Fabrication
Standard microfabrication techniques were used to fabricate the ACS device. Briefly, a 500-μm-thick, 100-mm-diameter silicon wafer was coated with a 1.4-μm-thick layer of AZ5214E-IR negative photoresist (Clariant, Somerville, NJ). Standard photolithography was utilized to pattern the microchannels. The channels were etched to a depth of 50 μm using the Bosch deep reactiveion etching process (770 SLR, Plasmatherm, St. Petersburg, FL) using photoresist as a mask. After stripping the photoresist, inlet and outlet access holes were drilled using a CNC drill (Flashcut CNC, Deerfield, IL) equipped with a 1.1-mm-diameter diamond bit (Triple Ripple, Abrasive Technology, Lewis Center, OH). The wafers were subsequently diced using a semi-automatic dicing saw (Disco, Tokyo, Japan). A borofloat glass lid was then anodically bonded onto the silicon chip by applying a 1000 V bias at 375 °C for 5 min (SB6, Suss Microtec AG, Garching, Germany). Finally, inlet and outlet tubing were glued to the device with 5 min epoxy (Devcon, Danvers, MA), and the piezoactuator (26051, Ferroperm Piezoceramics, Kvistgaard, Denmark) was attached to the silicon side of the device with superglue (Ross Super Glue Gel, Elmer’s Products, Inc., Columbus, OH).
Numerical simulation
At sufficiently low concentrations, the hydrodynamic interaction between cells or particles does not significantly impact their motion in microfluidic systems.19 We therefore used a simplified single-particle acoustophoretic model to simulate the particle motion in the ACS device. More specifically, in the direction transverse to the flow (i.e. y-direction), the acoustic radiation force Fac(y) is balanced by the viscous Stokes drag Fdrag = 6πηa dy/dt for a spherical particle of radius a, where η is the viscosity of the medium. If we furthermore make the approximation that the flow velocity along the channel is constant and equal to its mean value, the resulting differential equation Fac (y) = 6πηa dy/dt can be integrated to yield an expression for the transverse position y(t) of a particle in the ultrasound field as a function of time t,20
| (1) |
Here y(0) is the starting position of the particle of radius a, ky = 2π/λ is the wavenumber, and 〈Eac〉 is the time-averaged energy density of the ultrasound wave of wavelength λ inside the channel. Notably, the a2t factor in Equation 1 governs the relationship between particle volume and the necessary time to focus the particle into a particular flow stream. This formula was used to model of the trajectories of particles of different sizes. We found that it was sufficient to plot the paths of the outermost and innermost particle in each band at the inlets, because the paths of all other particle paths fell in between these extremes.
Bead separation
Red fluorescent 2-μm-diameter and green fluorescent 5-μm-diameter polystyrene beads (R0200 and G0500, Duke Scientific, Fremont, CA) were suspended in ultrapure water to form a mixture with total concentration of 0.5×10⁹ beads/ml. For separation, a 2.044 MHz 30 Vpp sinusoidal signal was applied to the ultrasonic transducer. The bead mixture and buffer flow, consisting of ultrapure water, were injected into the ACS device at flow rates of 3 ml/hr and 6 ml/hr respectively via dual programmable syringe pumps (PhD 2000, Harvard Apparatus, Holliston, MA). Outlet fractions were collected in microcentrifuge tubes and subsequently analyzed via flow cytometry (FACSAria, BD Biosciences, San Jose, CA). Following bead separation, the device was rinsed thoroughly with ultrapure water.
Cell preparation and separation
MDA-MB-231 cells were cultured at 37 °C and 5% CO2 in Dulbecco’s Modified Eagle’s Medium (DMEM) supplemented with 10% fetal bovine serum (FBS) and 1% penicillin-streptomycin. Cells were harvested from the culture dish with 0.05% trypsin-EDTA before reaching 70% confluency, to avoid abnormal cell sizes due to confinement. All cell culture media and reagents were purchased from ATCC (Manassas, VA).
Harvested cells were pelleted and resuspended at a concentration of approximately 1.2×10⁶ cells/ml in a 1× phosphate buffered saline (PBS) solution containing 2% bovine serum albumin (BSA) (Fraction V, Sigma-Aldrich, St. Louis, MO) and 1 mM EDTA (Sigma-Aldrich, St. Louis, MO) to avoid cell adhesion and the formation of aggregates. The cell mixture and buffer (also 1×PBS, 2% BSA, 1 mM EDTA) were injected into the device via at flow rates of 3 ml/h and 6 ml/hr respectively, and a sinusoidal signal at 2.044 MHz was applied to the piezoactuator. To account for the different focusing rate of the cells versus the beads, the signal amplitude was set to 11.6 Vpp. Because the actuation frequency determines the induced pressure field, the shape of the acoustic field was not altered compared with the bead experiments. The device was monitored during operation using an inverted microscope (TE2000-S, Nikon Inc., Melville, NY) connected to a CCD camera (CoolSNAP HQ2, Photometrics, Tuscon, AZ). To help reduce cell loss, sample inlet tubing was oriented vertically and leading directly into the device. A small amount of cell adhesion to the walls of the device was observed, chiefly at the fork between the separation channel and the outlet channels. Outlet fractions were collected in microcentrifuge tubes during separation. Following cell separation, the device was cleaned with a solution of 10% bleach, followed by thorough rinsing with ultrapure water.
Propidium iodide staining and FACS analysis
The cell cycle populations were determined by analyzing the cellular DNA content via propidium iodide DNA staining and flow cytometry.21 After synchronizing the cells in the ACS device, the collected cell fractions were pelleted and resuspended in 200 μl of 1×PBS, then fixed in 70% ethanol on ice for at least 2 h. Fixed cells were then centrifuged at 650×g for 8 min, and resuspended in 200 μl of staining solution (1×PBS, 0.1% vol./vol. Triton X-100, 200 μg/ml RNase A and 10 μg/ml propidium iodide, a DNA-intercalating dye21). Cells were incubated for 30 min at room temperature and subsequently analyzed with flow cytometry. Cell cycle populations were obtained from the data using ModFit LT DNA cell-cycle analysis software (Verity Software House, Topsham, ME).
Results and Discussions
As described in seminal work by Laurell and coworkers,22-25 microfluidic acoustophoresis operates by generating an ultrasonic standing wave (typically in the 0.1-10 MHz range) that imposes an acoustic radiation force on the cells such that they are attracted towards the nodes or antinodes of the standing pressure wave. More specifically, the acoustic radiation force Fac in the transverse y-direction can be approximated by
| (2) |
with the contrast factor ϕ(β,ρ) defined as ϕ(β,ρ) = (5ρp − 2ρ0)/(2ρp + ρ0)− βp/β0, where p1 is the ultrasonic pressure amplitude; λ is the wavelength of the standing wave; V is the volume, ρp the density and βp the compressibility of the cell; and ρ0 and β0 are the density and compressibility, respectively, of the suspension medium. From Equation 2 it is apparent that the acoustophoretic force strongly depends on the transverse dimension of the separation channel and the volume of the cell, as well as the cell density and compressibility with respect to the suspension medium.
The acoustophoretic cell synchronization (ACS) device was designed to exploit this volume-dependent force to purify cells in a particular phase from an asynchronous mixture, such that they are eluted into independent outlets (Fig. 1A). The acoustic standing waves are generated in the 3-cm-long, 350-μm-wide and 50-μm-deep separation channel within the ACS device (Fig. 1B), which is patterned in a silicon substrate and sealed with a glass cap. Sample and buffer solutions are injected with two independent syringe pumps, and the piezoelectric ultrasonic transducer is attached to the backside of the device and driven by amplifier circuitry based on an LT1210 operational amplifier (Linear Technologies, Milpitas, CA) and a radiofrequency function generator (33120A, Hewlett-Packard, Palo Alto, CA, USA). The thickness of the piezoactuator was chosen such that its resonant frequency matched the fundamental harmonic of the standing pressure wave in the microchannel (~ 2 MHz).
Figure 1.

Acoustophoretic Cell Synchronization (ACS) device and experimental setup. A) An asynchronous mixture of cells and buffer are volumetrically pumped into the ACS device. Synchronization is achieved by fractionating the cells according to size such that larger cells (e.g., G2) elute through outlet A whereas smaller cells (e.g., G1) elute through outlet B. B) Photograph of the device with attached piezoactuator on its backside (scale bar = 5 mm). C) Fluorescence micrographs of the ACS device in operation. A binary mixture of green (5-μm-diameter) and red (2-μm-diameter) polystyrene beads enters the inlet area (left), and are acoustophoretically separated to elute through outlet 1 and 2, respectively (right). Scale bars are 50 μm in both images. D) A two-dimensional numerical simulation of separation along the channel, showing buffer (gray) with bands of particle trajectories. Larger particles (green) are subject to a greater acoustic radiation force and thus converge faster to the nodal plane at the center of the channel (dashed line), and elute through outlet A. Smaller particles (red) do not reach the nodal plane and elute through outlet B.
Without piezoactuation, the low Reynolds number fluidic conditions (Re ~13) generate a steady laminar flow consisting of two peripheral sample streams and one central buffer stream within the microchannel (Fig 1C, left). When the piezo transducer is actuated, the stronger acoustic radiation force on larger cells (e.g., those in G2/M and S phases) directs them to the central stream more rapidly compared to smaller cells (e.g., those in G1 phase), thereby allowing efficient separation at the outlets (Fig 1C, right). Quantitatively, assuming two cells (a and b) of different sizes but possessing the same density and compressibility, the relationship between the their volumes (Va and Vb) and the required duration for them to focus at a node (τa and τb) can be expressed as
| (3) |
Based on this relationship, the channel geometry and the flow rates were chosen such that larger G2/M and S phase cells elute through outlet A and smaller G1 phase cells elute through outlet B (Fig 1D).
To validate the operating conditions, the ACS device was first characterized with two kinds of fluorescent polystyrene beads, 2 μm (red) and 5 μm (green) in diameter. The initial sample contained a binary mixture of red (91.87%) and green (8.13%) beads as measured with flow cytometry (Fig. 2). We note that this ratio of beads was chosen to mimic the typical proportion of mammalian cells in the G1 and G2 phases.17,18 By monitoring bead separation while adjusting the piezo driving signal, the optimum operational frequency for the device was found to be 2.044 MHz. After a single pass through the device at a sample flow rate of 3 mL/hr (1.5×10⁹ beads/hr), flow cytometry data shows highly efficient, label-free, size-based separation: 98.92% of green beads eluted through outlet A and 99.99% of red beads eluted through outlet B (Fig. 2).
Figure 2.
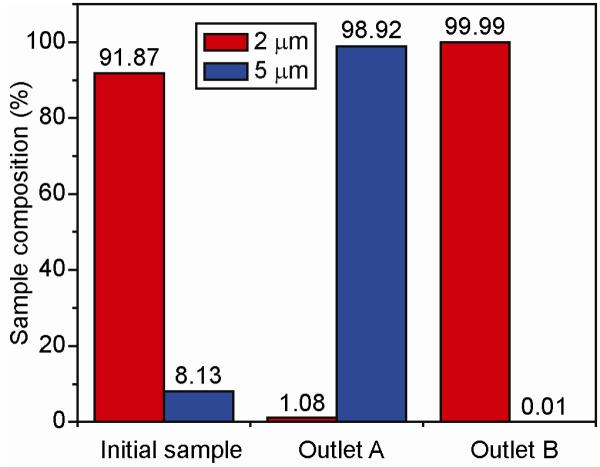
Validation study through separation of beads. A mixture of 2 and 5 μm polystyrene beads were separated in the ACS device at a sample flowrate of 3 ml/hr. Flow cytometry analysis shows that the initial mixture consisted of 91.87% 2-μm beads (red) and 8.13% 5-μm beads (green). After a single pass through the ACS device, the sample retrieved from outlet A contained 98.92% 5-μm beads and that from outlet B contained 99.99% 2-μm beads.
The MDA-MB-231 human breast ductal carcinoma cell line was used as a model for mammalian cell synchronization. Via optical microscopy, we confirmed that their size is highly correlated with their phase; we found that cells typically have a volume of ~400 μm3 in early G1 phase, reaching approximately twice that volume when entering the G2/M phase (data not shown). Studies of variations in the cell density throughout the cell cycle of representative mammalian cells are minor (< 2%) and would not significantly affect the acoustic separation.26,27 The distribution of elastic coefficients (i.e. compressibility) is wider with change in mean value of up to 20% through the cell cycle.28 However, such variability would have significantly smaller impact on the acoustic forces than the volume doubling through the cell cycle. Thus, assuming constant density ρp and compressibility βp, Equation 3 predicts that cells in G2/M phase will move toward the central node approximately 1.6 times faster than those in G1 phase (i.e., τG2/M < τG1). Based on these calculations, the ACS device was configured to enrich G1 cells in outlet B and deplete those in S and G2/M phases via outlet A. This configuration was chosen because the duration of G1 (~16–24 h) is significantly longer than G2/M (2.5-3 h), reducing the probability that cells will undergo division during operation. Cells were separated at a sample throughput of 3 ml/hr (3×10⁶ cells/hr). Compared with the bead validation experiment, the concentration is reduced to limit the presence of cellular aggregates, and no significant difference in separation performance was observed for a wide range of concentrations of beads (Supplementary Fig. 1).
To determine cell cycle phase after separation, the collected cells were fixed and stained with propidium iodide, analyzed with flow cytometry and the resulting histograms modeled using ModFit LT DNA cell cycle analysis software. The number of cells modeled in each histogram was 21115, 9739 and 4399, for the initial, outlet A and outlet B samples respectively. Before separation, the distribution of G1, S and G2/M cells in the sample population was 59%, 30% and 11% respectively, which is consistent with the residence time in their respective phases and with previously reported values (Fig. 3, initial sample).29,30 After a single pass through the device, in outlet A, the population of G1, S and G2/M cells was 57%, 33% and 10% respectively (Fig. 3, outlet A), while at outlet B the population was 84% G1, 14% S and 2% G2/M phase cells (Fig. 3, outlet B), or 84% G1 phase synchrony. We note that to elute only G1 cells out of outlet B, we are necessarily biasing our selection towards only the smallest cells from the early part of the G1 phase. Thus, although many late-stage cells in G1 phase elute through Outlet A, a high level of G1 phase synchrony at outlet B may be achieved.
Figure 3.

Flow cytometry histograms showing cell cycle distributions before and after synchronization, based on measurements of red fluorescence (centered at 576 nm) after staining the cellular DNA with propidium iodide. The populations in each phase of the cell cycle were determined by fitting cell cycle models to the histograms (ModFit LT). The synchronized cell population at outlet B shows 84% of all cells in the G1 phase, with 14% in S phase and 2% in G2/M phase.
The effect of acoustophoretic separation on cell viability was investigated via trypan blue-based dye exclusion experiments immediately after separation (Supplementary Fig. 2), and through long-term reculturing of cells collected after separation (Supplementary Fig. 3). Consistent with previous literature,31 both experiment revealed no significant change in the viability of cells, presumably due to the brief (~200 ms) ultrasound exposure.
Conclusions
We report the first use of ultrasonic standing waves to achieve cell synchronization. The device performance benefited specifically from the use of microfluidic channels that enable accurate, efficient and reproducible establishment of a volume-dependent ultrasonic separation force, as well as multi-stream laminar-flow architecture for high purity separation. We note that our method offers throughput that is approximately an order of magnitude higher than previous microfluidic approaches in both volumetric and cell throughputs,17,18 and appears to have negligible impact on cell viability. In comparison with conventional techniques, the ACS device achieves comparable levels of G1 phase synchrony. For example, various chemical arrest techniques for MDA-MB-231 cells reported purities of individual cell cycle populations of order 85-90% for G1 phase arrest,29,32 while centrifugal elutriation can achieve up to 90-95% G1 phase synchrony.33 We believe higher purities and higher throughput should be achievable through serial integration of the device,34 through optimization of channel geometry, and through parallel operation.22 Finally, given that acoustophoresis allows the use of a wide range of cells and suspension media, we believe our approach represents a promising, universal approach for low-stress and label-free cell synchronization with high throughput and fidelity.
Supplementary Material
Acknowledgments
The authors thank Patrick S. Daugherty for the kind gift of the mammalian cells, Unyoung Kim and Jinpeng Wang for help with flow cytometry as well as Seung-Soo Oh and B. Scott Ferguson for help with cell culturing. We thank the ONR, NIH, ARO Institute for Collaborative Biotechnologies (ICB), and Armed Forces Institute for Regenerative Medicine (AFIRM) for their financial support. Microfabrication was carried out in the Nanofabrication Facility at UC Santa Barbara.
References
- (1).Nagel WW, Vallee BL. Proc. Natl. Acad. Sci. U.S.A. 1995;92:579–583. doi: 10.1073/pnas.92.2.579. [DOI] [PMC free article] [PubMed] [Google Scholar]
- (2).Hartwell LH, Kastan MB. Science. 1994;266:1821–1828. doi: 10.1126/science.7997877. [DOI] [PubMed] [Google Scholar]
- (3).Hunter T, Pines J. Cell. 1994;79:573–582. doi: 10.1016/0092-8674(94)90543-6. [DOI] [PubMed] [Google Scholar]
- (4).Jolivet J, Cowan KH, Curt GA, Clendeninn NJ, Chabner BA. N. Engl. J. Med. 1983;309:1094–1104. doi: 10.1056/NEJM198311033091805. [DOI] [PubMed] [Google Scholar]
- (5).Schiff PB, Fant J, Horwitz SB. Nature. 1979;277:665–667. doi: 10.1038/277665a0. [DOI] [PubMed] [Google Scholar]
- (6).Jorgensen P, Tyers M. Curr. Biol. 2004;14:R1014–R1027. doi: 10.1016/j.cub.2004.11.027. [DOI] [PubMed] [Google Scholar]
- (7).Ramirez OT, Mutharasan R. Biotechnol. Bioeng. 1990;36:839–848. doi: 10.1002/bit.260360814. [DOI] [PubMed] [Google Scholar]
- (8).Jackman J, O’Connor PM. Curr. Prot. Cell Biol. 1998:8.3.1–8.3.20. [Google Scholar]
- (9).Davis PK, Ho A, Dowdy SF. Biotechniques. 2001;30:1322–1324. doi: 10.2144/01306rv01. [DOI] [PubMed] [Google Scholar]
- (10).Kumagai-Sano F, Hayashi T, Sano T, Hasezawa S. Nat. Protoc. 2006;1:2621–2627. doi: 10.1038/nprot.2006.381. [DOI] [PubMed] [Google Scholar]
- (11).Ji C, Marnett LJ, Pietenpol JA. Oncogene. 1997;15:2749–2753. doi: 10.1038/sj.onc.1201441. [DOI] [PubMed] [Google Scholar]
- (12).Cooper S. Cell. Mol. Life Sci. 2003;60:1099–1106. doi: 10.1007/s00018-003-2253-2. [DOI] [PMC free article] [PubMed] [Google Scholar]
- (13).Banfalvi G. Nat. Protoc. 2008;3:663–673. doi: 10.1038/nprot.2008.34. [DOI] [PubMed] [Google Scholar]
- (14).Zickert P, Wejde J, Skog S, Zetterberg A, Larsson O. Exp. Cell Res. 1993;207:115–121. doi: 10.1006/excr.1993.1169. [DOI] [PubMed] [Google Scholar]
- (15).Hohmann LK, Shows TB. Somatic Cell Genet. 1979;5:1013–1029. doi: 10.1007/BF01542657. [DOI] [PubMed] [Google Scholar]
- (16).Adams JD, Kim U, Soh HT. Proc. Natl. Acad. Sci. U.S.A. 2008;105:18165–18170. doi: 10.1073/pnas.0809795105. [DOI] [PMC free article] [PubMed] [Google Scholar]
- (17).Kim U, Shu CW, Dane KY, Daugherty PS, Wang JYJ, Soh HT. Proc. Natl. Acad. Sci. U.S.A. 2007;104:20708–20712. doi: 10.1073/pnas.0708760104. [DOI] [PMC free article] [PubMed] [Google Scholar]
- (18).Choi S, Song S, Choi C, Park JK. Anal. Chem. 2009;81:1964–1968. doi: 10.1021/ac8024575. [DOI] [PubMed] [Google Scholar]
- (19).Mikkelsen C, Bruus H. Lab Chip. 2005;5:1293–1297. doi: 10.1039/b507104f. [DOI] [PubMed] [Google Scholar]
- (20).Barnkob R, Augustsson P, Laurell T, Bruus H. Lab Chip. 2010 doi: 10.1039/b920376a. in press. DOI: 10.1039/B920376A. [DOI] [PubMed] [Google Scholar]
- (21).Darzynkiewicz Z, Juan G, Bedner E. Curr. Prot. Cell Biol. 2001:8.4.1–8.4.18. doi: 10.1002/0471143030.cb0804s01. [DOI] [PubMed] [Google Scholar]
- (22).Laurell T, Petersson F, Nilsson A. Chem. Soc. Rev. 2007;36:492–506. doi: 10.1039/b601326k. [DOI] [PubMed] [Google Scholar]
- (23).Nilsson A, Petersson F, Jonsson H, Laurell T. Lab Chip. 2004;4:131–135. doi: 10.1039/b313493h. [DOI] [PubMed] [Google Scholar]
- (24).Petersson F, Aberg L, Sward-Nilsson A-M, Laurell T. Anal. Chem. 2007;79:5117–5123. doi: 10.1021/ac070444e. [DOI] [PubMed] [Google Scholar]
- (25).Petersson F, Nilsson A, Holm C, Jonsson H, Laurell T. Lab Chip. 2005;5:20–22. doi: 10.1039/b405748c. [DOI] [PubMed] [Google Scholar]
- (26).Loken MR, Kubitschek HE. J. Cell. Physiol. 1984;118:22–26. doi: 10.1002/jcp.1041180106. [DOI] [PubMed] [Google Scholar]
- (27).Anderson EC, Petersen DF, Tobey RA. Biophys. J. 1970;10:630–645. doi: 10.1016/S0006-3495(70)86325-1. [DOI] [PMC free article] [PubMed] [Google Scholar]
- (28).Zhang G, Long M, Wu ZZ, Yu WQ. World J. Gastroentero. 2002;8:243–246. doi: 10.3748/wjg.v8.i2.243. [DOI] [PMC free article] [PubMed] [Google Scholar]
- (29).Pervin S, Singh R, Chaudhuri G. Proc. Natl. Acad. Sci. U.S.A. 2001;98:3583–3588. doi: 10.1073/pnas.041603998. [DOI] [PMC free article] [PubMed] [Google Scholar]
- (30).Li Z, Li J, Mo B, Hu C, Liu H, Qi H, Wang X, Xu J. Cell Biol. Toxicol. 2008;24:401–409. doi: 10.1007/s10565-008-9054-1. [DOI] [PubMed] [Google Scholar]
- (31).Hultstrom J, Manneberg O, Dopf K, Hertz HM, Brismar H, Wiklund M. Ultrasound Med. Biol. 2007;33:145–151. doi: 10.1016/j.ultrasmedbio.2006.07.024. [DOI] [PubMed] [Google Scholar]
- (32).Barascu A, Besson P, Le Floch O, Bougnoux P, Jourdan ML. Int. J. Biochem. Cell. B. 2006;38:196–208. doi: 10.1016/j.biocel.2005.08.015. [DOI] [PubMed] [Google Scholar]
- (33).Wahl AF, Donaldson KL. Curr. Prot. Cell Biol. 1999:8.5.1–8.5.16. doi: 10.1002/0471143030.cb0805s02. [DOI] [PubMed] [Google Scholar]
- (34).Bessette PH, Hu X, Soh HT, Daugherty PS. Anal. Chem. 2007;79:2174–2178. doi: 10.1021/ac0616916. [DOI] [PubMed] [Google Scholar]
Associated Data
This section collects any data citations, data availability statements, or supplementary materials included in this article.