

Abstract
(Cancer Sci 2010; 101: 820–825)
Uniform antibody microdistribution throughout tumor nodules is crucial for antibody‐targeted therapy, because non‐uniform microdistribution leads to suboptimal therapeutic effect, a commonly observed limitation of therapeutic antibodies. Herein, we evaluated the microdistribution of different doses of intraperitoneally injected fluorescence‐labeled full‐antibody trastuzumab (15, 50, and 150 μg) and its Fab fragment (trastuzumab‐Fab: 15 and 50 μg) in a mouse model of ovarian cancer with peritoneal disseminated tumor. A semiquantitative approach (central/peripheral accumulation ratio; C/P ratio) was developed using in situ fluorescence microscopy. Furthermore, we compared the microdistribution of intact trastuzumab with a mixed injection of trastuzumab and trastuzumab‐Fab or serial injections of trastuzumab using in situ multicolor fluorescence microscopy. Fluorescence images after the administration of 15 or 50 μg trastuzumab and 15 μg trastuzumab‐Fab demonstrated antibody accumulation in the tumor periphery, whereas administration of 150 μg trastuzumab and 50 μg trastuzumab‐Fab showed relatively uniform accumulation throughout the tumor nodule. Using serial injections (19‐h interval) of trastuzumab‐rhodamine green and carboxytetramethylrhodamine (TAMRA), it was observed that the latterly injected trastuzumab‐TAMRA was distributed more centrally than trastuzumab‐rhodamine green injected first, whereas no difference was observed in the control mixed‐injection group. Moreover, the mixed injection of trastuzumab and trastuzumab‐Fab showed that trastuzumab‐Fab distributed more centrally than the same amount of co‐injected trastuzumab. Our results suggest that the strategies of increasing dose and using Fab fragments can be used to achieve a uniform antibody distribution within peritoneal disseminated nodules after intraperitoneal injection. Furthermore, serial‐injection and mixed‐injection strategies can modify antibody microdistribution within tumors and have the potential for preferential delivery of anticancer drugs to either the tumor periphery or its center.
Monoclonal antibody‐targeted cancer therapy is an important, growing class of targeted anticancer therapy. Monoclonal antibodies can target specific cell‐surface markers and enable delivery of anticancer agents, such as radionuclides, cytotoxic drugs, and photosensitizers in addition to inducing antibody‐dependent cellular cytotoxicity and complement‐dependent cytotoxicity.( 1 ) Currently, nine cancer‐specific monoclonal antibodies and antibody conjugates have been approved for the treatment of human cancers by the US Food and Drug Administration (FDA) and many more are currently undergoing clinical trials.( 1 , 2 , 3 , 4 , 5 ) For instance, anti‐CD20 monoclonal antibody (rituximab), first approved by the FDA in 1997 as an anticancer monoclonal antibody, demonstrated excellent therapeutic outcomes in patients with follicular lymphoma and diffuse large B cell lymphoma. The combination of rituximab and chemotherapy is now the standard of care in clinical oncology.( 2 ) In spite of considerable success in the field of hematological cancers, the anticancer responses have been more modest in solid tumors.( 5 , 6 ) With hematological cancers, the desired serum antibody concentration can be readily achieved, but mechanical and physiological barriers exist within solid tumors that effectively inhibit penetration of the antibody, leading to a non‐uniform distribution of antibody.( 5 , 7 , 8 , 9 , 10 , 11 , 12 , 13 ) Such non‐uniformity leads to suboptimal therapeutic effects,( 9 , 14 ) thus explaining, in part, the differences in response rates of hematological and solid malignancies to monoclonal antibody therapies.
The factors underlying the failure of antibodies to distribute uniformly through a solid tumor include large tumor size, increased central interstitial pressure, and mechanical barriers (e.g. collagen and tight junctions).( 7 , 8 , 10 , 11 , 14 , 15 , 16 ) However, the majority of this work has been conducted in subcutaneous xenografts (except for a few studies involving lung( 13 ) or liver metastasis models,( 10 )) which may not adequately simulate the microenvironmental conditions found in human solid metastases. Small peritoneal tumors are a realistic model with which to study the microdistribution of antibody‐targeted therapy.( 17 , 18 , 19 ) Such a small peritoneal implant can be a target of antibody therapy after cytoreductive surgery.( 18) Because the surface of the tumor is exposed to the peritoneal cavity except for its narrow attachment to the peritoneal membrane, antibodies can interact with tumor nodules at high concentrations after intraperitoneal injections. Although the intraperitoneal injection of antibodies with and without therapeutic radionuclides has been extensively used for preclinical and clinical studies of cancer treatment,( 17 , 18 , 19 ) microdistribution studies within tumors have not been extensively evaluated. In the present study, therefore, we evaluated the microdistribution of different doses of intraperitoneally injected fluorescence‐labeled IgG and Fab fragments in a peritoneal dissemination model of ovarian cancer in mice using a semiquantitative analysis under in situ fluorescence microscopy. Furthermore, we evaluated mice receiving either serial injections of IgG or mixed injections of IgG and Fab using multicolor fluorescence microscopy. With these two different antibody injection strategies, we hypothesized that the microdistribution of antibody could be modified and these methods have the potential for preferential delivery of anticancer drugs to either the tumor periphery or its center.
Materials and Methods
Reagents. Trastuzumab (Herceptin), an FDA‐approved humanized IgG1 anti‐HER2 antibody that has a complimentary determination region against HER2 grafted onto a human IgG1 framework, was purchased from Genentech (South San Francisco, CA, USA). Amino‐reactive rhodamine green (RhodG‐NHS), Alexa568‐NHS, and carboxytetramethylrhodamine (TAMRA)‐NHS were purchased from Invitrogen Corporation (Carlsbad, CA, USA). Trastuzumab‐Fab was made using the papain digestion method. Briefly, 5 mg/mL trastuzumab‐IgG was incubated with papain beads (immobilized papain; Pierce, Rockford, IL, USA) in a PBS‐based digestion buffer (pH 7) containing 7.88 mg Cysteine • HCl for 31 h at 37°C, a process monitored by the UV absorption profile of a TSK G3000SWxL column during HPLC (Tosoh Bioscience LLC, Montgomeryville, PA, USA; 0.067 sodium phosphate−0.16 m KCl, pH 6.8; 1 mL/min). When trastuzumab‐IgG was totally digested into Fab, the reaction solution was purified with dialysis using a Slide‐A‐Lyzer Dialysis Cassette (Pierce) against PBS, 1 × , pH 7.2 (0.066 m) without magnesium and without calcium overnight at 4°C. After purification, the purity of trastuzumab‐Fab was >97% as measured by HPLC.
Synthesis of RhodG‐, Alexa568‐, and TAMRA‐conjugated trastuzumab and trastuzumab‐Fab. At room temperature, 1 mg (6.85 nmol) of trastuzumab in Na2HPO4 was incubated with 68.5 nmol of RhodG‐NHS, 47.95 nmol of Alexa568‐HNS, or 68.5 nmol of TAMRA‐NHS, at pH 8.5 for 15 min, and 1 mg (20 nmol) of trastuzumab‐Fab was incubated with 60 nmol of RhodG‐NHS at pH 8.5 for 15 min. The mixture was purified with a Sephadex G50 column (PD‐10; GE Healthcare, Piscataway, NJ, USA). Trastuzumab‐RhodG, ‐Alexa568, ‐TAMRA, and ‐Fab‐RhodG were kept at 4°C in the refrigerator as stock solutions. The protein concentrations of samples were determined with a Coomassie Plus protein assay kit (Pierce) by measuring the absorption at 595 nm with a UV‐Vis system (8453 Value UV‐Visible Value System; Agilent Technologies, Santa Clara, CA, USA) using standard solutions of known concentrations of trastuzumab or trastuzumab‐Fab. The concentrations of RhodG, Alexa680, and TAMRA were then measured by absorption at 503, 679, and 679 nm, respectively, with the UV‐Vis system to confirm the number of fluorophore molecules conjugated with each trastuzumab molecule. The number of fluorophore molecules per trastuzumab or trastuzumab‐Fab was adjusted to approximately three for trastuzumab‐RhodG, ‐Alexa568, and ‐TAMRA, and one for trastuzumab‐Fab‐RhodG.
Cell line and cell culture. An established human ovarian cancer cell line, SKOV3, was used for generating intraperitoneal disseminated tumors. SKOV3 overexpresses HER2/neu, the target for trastuzumab.( 20 ) The cell line was grown in RPMI‐1640 medium (Invitrogen Corporation) containing 10% FBS (Invitrogen Corporation), 0.03%l‐glutamine, 100 units/mL penicillin, and 100 μg/mL streptomycin in 5% CO2 at 37°C.
Tumor model. All procedures were approved by the National Cancer Institute Animal Care and Use Committee. The intraperitoneal tumor implants were established by intraperitoneal injection of 2 × 10⁶ SKOV3 cells suspended in 200 μL PBS in female nude mice (National Cancer Institute Animal Production Facility, Frederick, MD, USA). Experiments with tumor‐bearing mice were carried out 30–35 days after inoculation.
In situ fluorescence microscopy after injection of either labeled trastuzumab or trastuzumab‐Fab. After establishing the intraperitoneal dissemination model, groups of mice (n = 3–4 per group) were injected i.p. with 15, 50, or 150 μg trastuzumab‐RhodG, or 15 or 50 μg of trastuzumab‐Fab‐RhodG diluted with 300 μL PBS. After 24 h, mice were killed with carbon dioxide, and then the abdominal cavities were exposed and the peritoneal membranes were spread on glass slides. In situ fluorescence microscopy was carried out using an Olympus BX61 microscope (Olympus America, Melville, NY, USA). Transmitted light differential interference contrast (DIC) images were used to identify the tumor nodules and fluorescence images were obtained with blue filter settings; a band‐pass filter from 470 to 490 nm and a band‐pass filter from 515 to 550 nm were used for excitation and emission light, respectively. Finally, 52 nodules in the 15‐μg trastuzumab group, 62 nodules in the 50‐μg trastuzumab group, 51 nodules in the 150‐μg trastuzumab group, 52 nodules in the 15‐μg trastuzumab‐Fab group, and 54 nodules in the 50‐μg trastuzumab‐Fab group were identified and analyzed.
In situ multicolor fluorescence microscopy of serial trastuzumab injections. After establishing the intraperitoneal dissemination model, groups of mice (n = 3 each) were injected i.p. with 30 μg trastuzumab‐TAMRA diluted with 300 μL PBS. After 19 h, the same mice were injected i.p. with 30 μg trastuzumab‐RhodG diluted with 300 μL PBS. Following an additional 5 h, the mice were killed with carbon dioxide, and then the abdominal cavities were exposed and the peritoneal membranes were spread on glass slides. In situ multicolor fluorescence microscopy was carried out using an Olympus BX61 microscope with blue filter settings and green filter settings (a band‐pass filter from 533 to 588 nm and a band‐pass filter from 608 to 683 nm). As a control, a mixed‐injection group of mice received i.p. a mixture of 30 μg trastuzumab‐TAMRA and 30 μg trastuzumab‐RhodG. and were also evaluated 24 h after injection. Finally, 34 nodules were identified in the serial‐injection group, whereas 27 nodules were identified in the control mixed‐injection group.
In situ multicolor fluorescence microscopy of a mixed injection of trastuzumab and trastuzumab‐Fab. After establishing the intraperitoneal dissemination model, groups of mice (n = 3 each) were injected i.p. with a mixture of 50 μg trastuzumab‐Alexa568 and 50 μg trastuzumab‐Fab‐RhodG diluted with 300 μL PBS. Twenty‐four hours later, the mice were killed with carbon dioxide, and the abdominal cavity was exposed; the peritoneal membranes were spread on glass slides. In situ multicolor fluorescence microscopy was carried out using an Olympus BX61 microscope with blue filter settings and green filter settings. Finally, 40 nodules were identified and analyzed in this mixed‐injection group.
Semiquantitative image analysis. All fluorescence images were analyzed with ImageJ software (http://rsbweb.nih.gov/ij/). Linear regions of interest were placed on the long axis of each tumor nodule (Fig. 1a). Tumor nodules, whose long axes were covered by fat tissue, were eliminated from image analysis because fat absorbs and scatters fluorescence from tumor nodules. The regions of interest were divided evenly into three portions (peripheral 1, central, and peripheral 2) and then mean signal intensities were calculated in each portion (P1, C, and P2, respectively) (Fig. 1b). After obtaining mean signal intensities, central/peripheral signal intensity ratios (C/P ratios) were calculated using the following formula:
Figure 1.
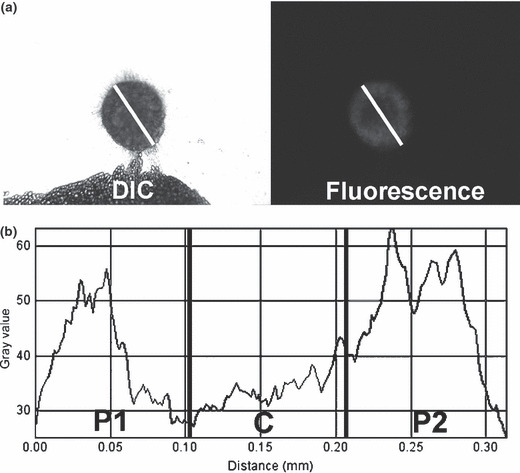
Image analysis procedures for central/peripheral accumulation ratio (C/P ratio) calculations. (a) A linear region of interest (ROI) is placed on fluorescence images of each tumor nodule along its long axis based on the transmitted light differential interference contrast (DIC) images. (b) Linear ROI are divided evenly into three portions and the signal intensities of each pixel are measured. Mean signal intensities are calculated in each portion (P1, C, and P2). Finally, a C/P ratio is calculated using the formula described in the Materials and Methods section.
Statistical analysis. Statistical analyses were carried out using a statistics program (GraphPad Instat, version 3.06; GraphPad Software, La Jolla, CA, USA) on a Windows computer. The Mann–Whitney test was used to compare the mean C/P ratio between the two groups, and a one‐way analysis of variance (anova) with post test (Kruskal–Wallis test with post‐test) was used to compare the mean C/P ratios among the five groups of single‐injection study. Values of P < 0.05 were considered statistically significant.
Results
In situ fluorescence microscopy after single injection of either trastuzumab or trastuzumab‐Fab. Fifty‐two nodules in the 15‐μg trastuzumab group, 62 nodules in the 50‐μg trastuzumab group, 51 nodules in the 150‐μg trastuzumab group, 52 nodules in the 15‐μg trastuzumab‐Fab group, and 54 nodules in the 50‐μg trastuzumab‐Fab group were identified and analyzed in this study. Tumor sizes (long axis) were 0.73 ± 0.28 mm (mean ± SD), 0.71 ± 0.30 mm, 0.64 ± 0.22 mm, 0.71 ± 0.24 mm, and 0.62 ± 0.21 mm, respectively, and showed no significant difference among all the groups. The C/P ratios in each group were 0.91 ± 0.06, 0.88 ± 0.17, 1.23 ± 0.25, 0.90 ± 0.07, and 1.01 ± 0.15, respectively. In situ fluorescence images of the 15‐μg trastuzumab, 50‐μg trastuzumab, and 15‐μg trastuzumab‐Fab groups showed accumulation of the agent predominantly in the periphery whereas 150‐μg trastuzumab and 50‐μg trastuzumab‐Fab showed more homogeneous accumulation throughout tumors (Fig. 2a,b). The C/P ratios were highest for the 150‐μg trastuzumab group among the all groups. The 50‐μg trastuzumab‐Fab group also showed a higher C/P ratio than the other three groups (15‐μg trastuzumab, 50‐μg trastuzumab, and 15‐μg trastuzumab‐Fab groups), whereas these remaining three groups showed no significant difference. These data are summarized in Figure 2(c). These results indicated that the high dose of antibody distributed more centrally than the lower and middle doses of antibody, and trastuzumab‐Fab distributed more centrally than the same amount of IgG.
Figure 2.
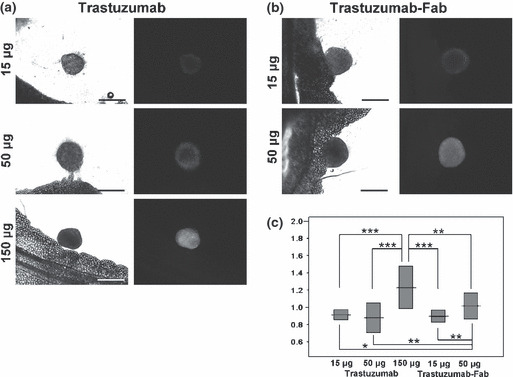
In situ fluorescence microscopic images of the (a) trastuzumab‐injected and (b) trastuzumab‐Fab‐injected groups, and (c) central/peripheral accumulation ratios (C/P ratios) (means and SD) in each group. Fluorescence images of the 15‐μg trastuzumab, 50‐μg trastuzumab, and 15‐μg trastuzumab‐Fab groups show peripheral dominant antibody accumulation, whereas the 150‐μg trastuzumab and 50‐μg trastuzumab‐Fab groups show relatively homogenous accumulation throughout tumors. C/P ratios demonstrate that the 150‐μg trastuzumab group has the highest among all groups. The 50‐μg trastuzumab‐Fab group also shows a higher C/P ratio than the other three groups (15‐μg trastuzumab, 50‐μg trastuzumab, and 15‐μg trastuzumab‐Fab groups), and these three groups show no significant difference. Scale bars on DIC images = 500 μm. *P < 0.05, **P < 0.001, ***P < 0.0001.
In situ multicolor fluorescence microscopy of serial injections of trastuzumab. Thirty‐four nodules were identified in the serial‐injection group, whereas 27 nodules were identified in the control mixed‐injection group. Tumor sizes (long axis) were 0.56 ± 0.28 mm (mean ± SD) and 0.56 ± 0.39 mm, respectively. In the serial‐injection group, the mean C/P ratio of the second injection (trastuzumab‐RhodG) was statistically higher than the C/P ratio of the first injection (trastuzumab‐TAMRA), and 31/34 nodules (91.2%) showed higher C/P ratios after the second injection compared with the first (Fig. 3c). In contrast, no statistical difference was identified between the C/P ratios of simultaneously injected trastuzumab‐RhodG and trastuzumab‐TAMRA (Fig. 3d). These different distribution patterns were clearly visualized in composite fluorescence images (Fig. 3a,b). These findings indicate that the second injection of trastuzumab distributed more centrally than the first injection of trastuzumab in over 90% of the tumor nodules.
Figure 3.
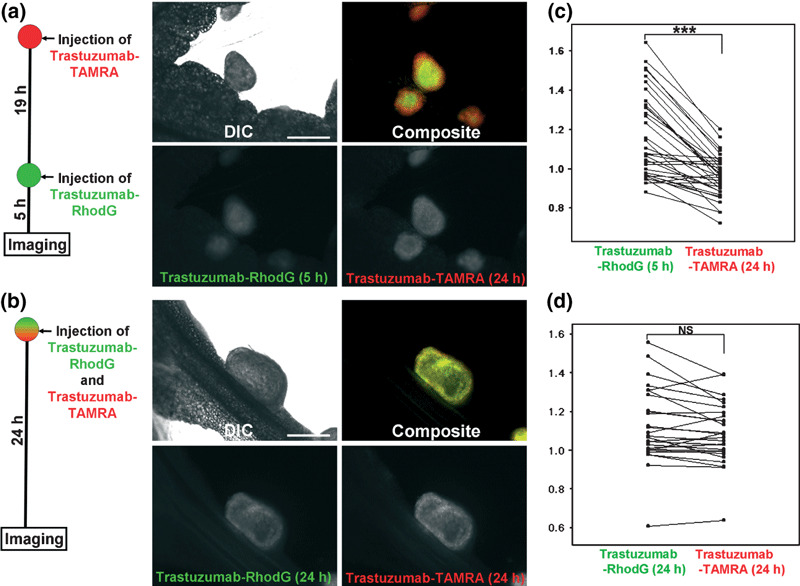
In situ fluorescence microscopic images of the (a) serial‐injection and (b) mixed‐injection groups of trastuzumab‐rhodamine green (RhodG) and ‐carboxytetramethylrhodamine (TAMRA). Scatter plots of central/peripheral accumulation ratios (C/P ratios) in each group are also shown: (c) interval‐injection group; (d) non‐interval‐injection group. The C/P ratios of each set of tumor nodules are connected in scatter plots. A composite image of the serial‐injection group clearly shows that the secondarily injected trastuzumab‐RhodG (green) distributes more centrally than trastuzumab‐TAMRA (red), which was injected first. C/P ratios demonstrate that the second injection of trastuzumab‐RhodG demonstrates a statistically higher C/P ratio than trastuzumab‐TAMRA, which was injected first. In contrast, the mixed‐injection group shows the same accumulation patterns between the two trastuzumabs in both fluorescence images and C/P ratio analysis. Scale bars on DIC images = 500 μm. ***P < 0.0001, NS, not significant.
In situ multicolor fluorescence microscopy of the mixed injection of trastuzumab and trastuzumab‐Fab. Forty nodules were identified and analyzed in this mixed‐injection group. Tumor size was 0.58 ± 0.19 mm. Both fluorescence images and C/P ratio analysis showed that trastuzumab‐Fab distributed more centrally than the co‐injected trastuzumab, and 37/40 nodules (92.5%) showed higher C/P ratios for trastuzumab‐Fab than the co‐injected trastuzumab (Figs 4a,b, S1). In the mixed‐injection group of trastuzumab and trastuzumab‐Fab, trastuzumab‐Fab showed more central accumulation and less peripheral accumulation than the single injections of the same amount of trastuzumab‐Fab (2, 4). Moreover, in the mixed‐injection group trastuzumab‐Fab showed a higher C/P ratio than trastuzumab‐Fab alone (Fig. 4c). These finding indicate that in the mixed‐injection group, trastuzumab‐Fab distributed more centrally in the tumor than the same amount of co‐injected trastuzumab or individually injected trastuzumab‐Fab.
Figure 4.
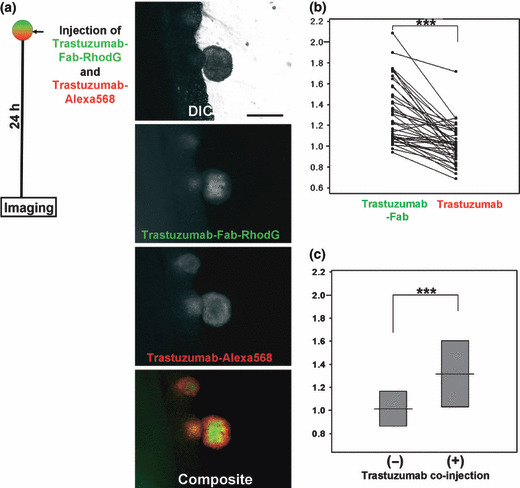
(a) In situ fluorescence microscopic images and (b) scatter plot of central/peripheral accumulation ratios (C/P ratios) in mixed injections of trastuzumab and trastuzumab‐Fab. The C/P ratios of the same tumor nodules are connected in the scatter plots. Both fluorescence images and C/P ratio analysis show that trastuzumab‐Fab distributed more centrally than co‐injected trastuzumab. Comparison of C/P ratios of trastuzumab‐Fab with or without co‐injection of trastuzumab (c, also see Fig. 2) shows that co‐injection of trastuzumab alters the trastuzumab‐Fab accumulation so that it has a more central distribution pattern. Scale bars on DIC images = 500 μm. ***P < 0.0001.
Discussion
In the present study, we evaluated the microdistribution of intraperitoneally injected fluorescence‐labeled trastuzumab and trastuzumab‐Fab in a mouse model of peritoneally disseminated ovarian cancer. When trastuzumab was administrated in low and intermediate doses (15 and 50 μg per mouse, respectively), the agent distributed peripherally (Fig. 2a). This finding can be explained by mechanical and physiological barriers within solid tumor nodules, including increased interstitial pressure, collagen, and tight junctions. In addition to these factors, Fujimori and colleagues also proposed the binding‐site barrier theory to explain such a non‐uniform antibody microdistribution.( 21 ) According to this theory, the high‐affinity interaction between antibodies and antigens interferes with the penetration of antibody into the tumor.
The injected antibodies first interact with tumor antigens at the periphery of each tumor and can be trapped in the periphery due to mechanical and physiological barriers that hamper antibody penetration, resulting in a doughnut‐like accumulation. Such non‐uniform accumulations were overcome by either increasing the dose of the full antibody or by using a Fab in our study. Increasing the dose allows more antibodies to interact with the tumor nodules, and can overcome the binding‐site barrier effect.( 13 ) Fab fragments (50 kDa) have been reported to diffuse faster and penetrate more deeply into tumor nodules due to their smaller molecular weight.( 6 , 22 ) Also, the faster off‐rate of Fab can overcome the binding‐site barrier.( 22 ) These lead to a more uniform microdistribution of Fab within tumor nodules than is seen with the full antibody, although an insufficient dose of Fab may still result in a peripheral‐dominant accumulation (Fig. 2b).
Serial injections of trastuzumab showed that the latterly injected trastuzumab distributed more centrally and less peripherally than the trastuzumab injected first (Fig. 3). This finding is difficult to explain by mechanical barriers alone, because such barriers may not be influenced by antibody–antigen complexes in the peripheral region of the tumor. Therefore, we assumed that this serial‐injection strategy neutralizes the binding‐site barrier; as interactions between primarily injected antibodies and tumor antigens mainly occur in the peripheral region (Fig. 2), unbound available antigens may decrease especially in the peripheral region. Thus, the latterly injected antibody may be free from the binding‐site barrier effect and then distribute more deeply into tumor nodules.
When the mixture of trastuzumab and trastuzumab‐Fab was injected, trastuzumab‐Fab showed more central accumulation and less peripheral accumulation than the same amount of co‐injected trastuzumab or trastuzumab‐Fab alone (2, 4). These findings can partly be explained by the different permeability of IgG and Fab. However, less accumulation in the peripheral region after exposure to Fab is difficult to explain. A possible explanation of this finding is the higher off‐rates of Fab from antigen compared with the full IgG (K d = 4 nm);( 23 ) as IgG has two binding sites per antibody but Fab has only one, the off‐rate of Fab is generally considered faster than that of IgG.( 22 ) Therefore, although both IgG and Fab bind to peripheral antigens at the same time, Fab does not remain bound, resulting in an IgG‐dominant accumulation in the periphery of nodules. Because this leads to decreased unbound antigen in the periphery, Fab may be less affected by the binding‐site barrier effect and distribute more centrally than IgG.
Our results suggest that serial injections of IgG and mixed injections of IgG and Fab can be used to modify antibody microdistribution within tumors. This has the potential for selective delivery of anticancer drugs to either the periphery or center of small peritoneal disseminations. That is to say, if only one antibody is loaded with an anticancer agent, it could be possible to concentrate the drug in either the center or periphery even in submillimeter tumor nodules. Such precise drug delivery may have implications for improving cancer therapies as it is known that regional differences exist within tumors with regard to angiogenesis (periphery) and hypoxia (center), between the periphery and center of tumor nodules.( 24 , 25 )
In conclusion, our study demonstrates that the microdistribution of intraperitoneally injected fluorescence‐labeled antibodies in peritoneally disseminated tumor nodules varies with dose, antibody structure, and administration method (single, serial, mixed). These findings may have implications for improving the uniformity of antibody distribution to improve cancer therapy or conversely exploiting differences in the biology of the periphery and central parts of tumors to more effectively deliver the right drug to the right place.
Supporting information
Fig. S1. To eliminate the possibility that the antibody‐conjugated fluorophores influenced the distribution of trastuzumab or trastuzumab‐Fab, the mixed‐injection study was repeated by swapping the fluorophores. A mixture of 50‐μg trastuzumab‐RhodG and 50‐μg trastuzumab‐Fab‐Alexa568 was injected. After 24 h, the microdistributions within tumor nodules (n = 28) were evaluated with the same methods. (a,b) The identical result that trastuzumab‐Fab distributes more centrally than co‐injected trastuzumab was obtained even after swapping the fluorophores. (c) Also, central/peripheral accumulation ratios (C/P ratios) of trastuzumab‐Fab‐RhodG and ‐Alexa568 did not statistically differ in these co‐injection studies.
Please note: Wiley‐Blackwell are not responsible for the content or functionality of any supporting materials supplied by the authors. Any queries (other than missing material) should be directed to the corresponding author for the article.
Supporting info item
Acknowledgment
This research was supported by the Intramural Research Program of the National Institutes of Health, National Cancer Institute, Center for Cancer Research.
References
- 1. Cheson BD, Leonard JP. Monoclonal antibody therapy for B‐cell non‐Hodgkin’s lymphoma. N Engl J Med 2008; 359: 613–26. [DOI] [PubMed] [Google Scholar]
- 2. Boyiadzis M, Foon KA. Approved monoclonal antibodies for cancer therapy. Expert Opin Biol Ther 2008; 8: 1151–8. [DOI] [PubMed] [Google Scholar]
- 3. Dalle S, Thieblemont C, Thomas L, Dumontet C. Monoclonal antibodies in clinical oncology. Anticancer Agents Med Chem 2008; 8: 523–32. [DOI] [PubMed] [Google Scholar]
- 4. Mauri D, Polyzos NP, Salanti G, Pavlidis N, Ioannidis JP. Multiple‐treatments meta‐analysis of chemotherapy and targeted therapies in advanced breast cancer. J Natl Cancer Inst 2008; 100: 1780–91. [DOI] [PubMed] [Google Scholar]
- 5. Tassev DV, Cheung NK. Monoclonal antibody therapies for solid tumors. Expert Opin Biol Ther 2009; 9: 341–53. 19216623 [Google Scholar]
- 6. Beckman RA, Weiner LM, Davis HM. Antibody constructs in cancer therapy: protein engineering strategies to improve exposure in solid tumors. Cancer 2007; 109: 170–9. [DOI] [PubMed] [Google Scholar]
- 7. Baker JH, Lindquist KE, Huxham LA, Kyle AH, Sy JT, Minchinton AI. Direct visualization of heterogeneous extravascular distribution of trastuzumab in human epidermal growth factor receptor type 2 overexpressing xenografts. Clin Cancer Res 2008; 14: 2171–9. [DOI] [PubMed] [Google Scholar]
- 8. Choi J, Credit K, Henderson K et al. Intraperitoneal immunotherapy for metastatic ovarian carcinoma: resistance of intratumoral collagen to antibody penetration. Clin Cancer Res 2006; 12: 1906–12. [DOI] [PubMed] [Google Scholar]
- 9. Du Y, Honeychurch J, Glennie M, Johnson P, Illidge T. Microscopic intratumoral dosimetry of radiolabeled antibodies is a critical determinant of successful radioimmunotherapy in B‐cell lymphoma. Cancer Res 2007; 67: 1335–43. [DOI] [PubMed] [Google Scholar]
- 10. Fidarova EF, El‐Emir E, Boxer GM et al. Microdistribution of targeted, fluorescently labeled anti‐carcinoembryonic antigen antibody in metastatic colorectal cancer: implications for radioimmunotherapy. Clin Cancer Res 2008; 14: 2639–46. [DOI] [PubMed] [Google Scholar]
- 11. Flessner MF, Choi J, Credit K, Deverkadra R, Henderson K. Resistance of tumor interstitial pressure to the penetration of intraperitoneally delivered antibodies into metastatic ovarian tumors. Clin Cancer Res 2005; 11: 3117–25. [DOI] [PubMed] [Google Scholar]
- 12. Juweid M, Neumann R, Paik C et al. Micropharmacology of monoclonal antibodies in solid tumors: direct experimental evidence for a binding site barrier. Cancer Res 1992; 52: 5144–53. [PubMed] [Google Scholar]
- 13. Saga T, Neumann RD, Heya T et al. Targeting cancer micrometastases with monoclonal antibodies: a binding‐site barrier. Proc Natl Acad Sci U S A 1995; 92: 8999–9003. [DOI] [PMC free article] [PubMed] [Google Scholar]
- 14. El Emir E, Qureshi U, Dearling JL et al. Predicting response to radioimmunotherapy from the tumor microenvironment of colorectal carcinomas. Cancer Res 2007; 67: 11896–905. [DOI] [PubMed] [Google Scholar]
- 15. Flessner MF, Dedrick RL. Monoclonal antibody delivery to intraperitoneal tumors in rats: effects of route of administration and intraperitoneal solution osmolality. Cancer Res 1994; 54: 4376–84. [PubMed] [Google Scholar]
- 16. Jain RK. Physiological barriers to delivery of monoclonal antibodies and other macromolecules in tumors. Cancer Res 1990; 50: 814s–9s. [PubMed] [Google Scholar]
- 17. Aarts F, Bleichrodt RP, Oyen WJ, Boerman OC. Intracavitary radioimmunotherapy to treat solid tumors. Cancer Biother Radiopharm 2008; 23: 92–107. [DOI] [PubMed] [Google Scholar]
- 18. Koppe MJ, Hendriks T, Boerman OC, Oyen WJ, Bleichrodt RP. Radioimmunotherapy is an effective adjuvant treatment after cytoreductive surgery of experimental colonic peritoneal carcinomatosis. J Nucl Med 2006; 47: 1867–74. [PubMed] [Google Scholar]
- 19. Meredith RF, Buchsbaum DJ, Alvarez RD, LoBuglio AF. Brief overview of preclinical and clinical studies in the development of intraperitoneal radioimmunotherapy for ovarian cancer. Clin Cancer Res 2007; 13: 5643s–5s. [DOI] [PubMed] [Google Scholar]
- 20. Hung MC, Zhang X, Yan DH et al. Aberrant expression of the c‐erbB‐2/neu protooncogene in ovarian cancer. Cancer Lett 1992; 61: 95–103. [DOI] [PubMed] [Google Scholar]
- 21. Fujimori K, Covell DG, Fletcher JE, Weinstein JN. A modeling analysis of monoclonal antibody percolation through tumors: a binding‐site barrier. J Nucl Med 1990; 31: 1191–8. [PubMed] [Google Scholar]
- 22. Fujimori K, Covell DG, Fletcher JE, Weinstein JN. Modeling analysis of the global and microscopic distribution of immunoglobulin G, F(ab’)2, and Fab in tumors. Cancer Res 1989; 49: 5656–63. [PubMed] [Google Scholar]
- 23. Koyama Y, Hama Y, Urano Y, Nguyen DM, Choyke PL, Kobayashi H. Spectral fluorescence molecular imaging of lung metastases targeting HER2/neu. Clin Cancer Res 2007; 13: 2936–45. [DOI] [PubMed] [Google Scholar]
- 24. McDonald DM, Choyke PL. Imaging of angiogenesis: from microscope to clinic. Nat Med 2003; 9: 713–25. [DOI] [PubMed] [Google Scholar]
- 25. Tanaka T, Furukawa T, Fujieda S, Kasamatsu S, Yonekura Y, Fujibayashi Y. Double‐tracer autoradiography with Cu‐ATSM/FDG and immunohistochemical interpretation in four different mouse implanted tumor models. Nucl Med Biol 2006; 33: 743–50. [DOI] [PubMed] [Google Scholar]
Associated Data
This section collects any data citations, data availability statements, or supplementary materials included in this article.
Supplementary Materials
Fig. S1. To eliminate the possibility that the antibody‐conjugated fluorophores influenced the distribution of trastuzumab or trastuzumab‐Fab, the mixed‐injection study was repeated by swapping the fluorophores. A mixture of 50‐μg trastuzumab‐RhodG and 50‐μg trastuzumab‐Fab‐Alexa568 was injected. After 24 h, the microdistributions within tumor nodules (n = 28) were evaluated with the same methods. (a,b) The identical result that trastuzumab‐Fab distributes more centrally than co‐injected trastuzumab was obtained even after swapping the fluorophores. (c) Also, central/peripheral accumulation ratios (C/P ratios) of trastuzumab‐Fab‐RhodG and ‐Alexa568 did not statistically differ in these co‐injection studies.
Please note: Wiley‐Blackwell are not responsible for the content or functionality of any supporting materials supplied by the authors. Any queries (other than missing material) should be directed to the corresponding author for the article.
Supporting info item