

Abstract
Individuals with central visual field loss often use a preferred retinal locus (PRL) to compensate for their deficit. We present a case study examining the eye movements of a subject with Stargardt’s disease causing bilateral central scotomas, while performing a set of natural tasks including: making a sandwich; building a model; reaching and grasping; and catching a ball. In general, the subject preferred to use PRLs in the lower left visual field. However, there was considerable variation in the location and extent of the PRLs used. Our results demonstrate that a well-defined PRL is not necessary to adequately perform this set of tasks and that many sites in the peripheral retina may be viable for PRLs, contingent on task and stimulus constraints.
Keywords: central visual field loss, eye movements, natural vision, vision loss
Introduction
Loss of central vision dramatically changes an individual’s capabilities for gathering visual information. With central visual field loss, visually guided actions must be mediated by peripheral vision. This adaptation has been of significant research interest for a greater understanding of the difficulties patients face and possible rehabilitation strategies.
Preferred retinal locus (PRL)
Without central vision, most patients develop an eccentric viewing strategy using one (or more) preferred retinal locus (PRL) that acts as a ‘pseudo-fovea’ that can be directed to saccade targets (Schuchard, 1995, 2005; Nilsson et al., 2003; Crossland et al., 2005; Deruaz et al., 2006). How a patient selects a PRL is largely unconscious and a systematic rationale for PRL selection has not been found (Fletcher and Schuchard, 1997; Schuchard et al., 1999; Crossland et al., 2005; Schuchard, 2005). Defining the PRL can be difficult because many patients have poor fixation control or have multiple PRLs. For instance, Sunness et al. (1995) found that early stage non-exudative macular degeneration patients displayed a transition period of alternating between foveal and eccentric fixation. Recent studies have focused on PRLs in tasks such as reading and visual search (Fletcher and Schuchard, 1997; Crossland et al., 2004; Schuchard, 2005) and training PRLs for reading (Safran et al., 1999; Deruaz et al., 2002; Nilsson et al., 2003).
Stimulus and task-dependence of the PRL
PRLs vary between and within subjects. For instance, Lei and Schuchard (1997) documented use of different PRLs depending on ambient illumination. Schuchard (2005) noted that patients with multiple PRLs tend to use one for objects directly in front of the subject, but use another for vertically or laterally displaced targets, assuming the head is fixed. PRL location dependent on task and stimulus has also been observed in reading (Duret et al., 1999; Safran et al., 1999; Deruaz et al., 2002). In these studies, patients tended to use a PRL in the lower or upper visual field to ascertain a global view of words whereas PRLs to the left or right of the scotoma were used for fine discrimination of individual letters. Deruaz et al. (2002) found that some patients used the same PRL regardless of text size in reading isolated words but the PRL location was affected by word length. Other subjects shifted their PRL dependent on both word length and text size. They concluded that PRLs appear to shift dependent on the need for global or local information. Additionally, the authors speculated that individuals with multiple PRLs may be better suited to match a PRL to task demands, whereas single PRL patients might compromise task specificity for a consistent fixation locus.
Eye movements in natural tasks
Research on central visual field loss in real world activities has largely focused on PRL use in reading. Reading is a common problem for patients and this research has positively influenced rehabilitation strategies. However, little is known about PRL use in other daily circumstances. A study by Turano et al. (2002) started to address this issue by examining fixations while navigating in subjects with central visual field loss. While this study provided useful observations of visual strategies in navigation, it did not directly address how a PRL may be selected for a given task or its reliability when used.
In this study, we compare the eye movement strategies of a subject with central visual field loss with those of normally sighted subjects. Previous studies of eye movements in natural tasks have examined a range of activities including making tea or a sandwich, playing cricket, building models and navigation (Land et al., 1999; Land and McLeod, 2000; Hayhoe et al., 2003; Turano et al., 2003; Mennie et al., 2007). A general finding from these studies is that objects are fixated in a task-relevant manner and subjects fixate relevant objects in regular patterns despite the seemingly uncontrolled nature of natural tasks (Land and Hayhoe, 2001).
Given that fixations are specific for the task at hand, the type of visual information needed may be quite different across tasks. If different tasks have different visual demands and the retina is not uniform in the information it transmits, we may conjecture that PRLs would shift depending on the visual information required and the capacity of peripheral vision. Additionally, the demands of the task may place a constraint on the location and reliability of the PRL. A high spatial frequency task-like reading may require a precise PRL to achieve high reading performance. For another task, like reaching for a cup, a larger portion of peripheral retina may be capable of capturing this information. Nilsson et al. (2003) made a similar suggestion regarding how PRLs may be task dependent in the real world.
By using our knowledge of what normally sighted subjects fixate, we may infer the site of eccentric fixation (PRL) in a patient with central visual field loss. We have previously recorded eye movements in normally sighted subjects while making a sandwich, building a model and catching a ball (Hayhoe et al., 2003, 2005; Mennie et al., 2007). Here, we present a case study of one subject with Stargardt’s disease, a juvenile form of macular degeneration, performing these tasks and use our knowledge of normally sighted strategies to interpret the subject’s eccentric fixation patterns.
Methods
We recorded eye movements of a single patient WT, a 58-year-old male with Stargardt’s disease with onset in his early 20s. WT was recruited from a local clinic, gave informed consent in compliance with the policies of the University of Rochester’s Research Subject Review Board and was paid for his participation. WT’s visual acuity was assessed at 10 ft, OS: 10/120+1, OD: 10/100−2. The patient normally wears glasses with the corrections: OD: −3.25/+1.75 × 110; OS: −2.50/+1.50 × 90. However, all tests were performed without glasses as we were unable to obtain a reliable signal with the eye tracker because of reflections from the glasses. WT reported that he did not feel impaired by the lack of correction but we were unable to compare corrected and uncorrected performance.
WT was run in a battery of visual field tests including tangent screen testing, a Goldman visual field test (I3e, I4e, V4e stimuli) and a Humphrey test (central 24-2 test, III stimulus). All visual field tests were conducted by trained technicians in the University of Rochester Eye Institute at Strong Memorial Hospital and Rochester General Hospital. Humphrey test results are shown in Figure 1 with the results from the Goldman V4e stimulus overlaid. The Humphrey test has superior controls for fixation breaks and gives an estimate of luminance sensitivity lacking in the other tests and is our preferred representation for WT’s visual fields.
Figure 1.

Humphrey visual field test results with Goldman IV-4 stimulus results overlaid. (Left) OD results (Middle) OS Results (Right) Binocular average of Humphrey visual field data. The dotted grey line represents the OS scotomas as determined from Goldman testing. The solid grey line indicates the Goldman results OD.
Note all experimental tasks except visual field testing were performed binocularly and data are presented using an averaged binocular representation from the Humphrey visual field tests. In some cases, the PRL from the dominant eye may be the only visual input used (Schuchard, 2005) but we do not consider such perceptual effects in our plots. WT has asymmetrical scotomas in the two eyes affecting the central 15°–20° of vision. Conversations with WT revealed that he had a general preference to look ‘up and to the right’ at visual targets, i.e. placing the target in the lower left visual field. However, no systematic measures [e.g. scanning laser ophthalmoscope (SLO)] were used to define a retinal region as the PRL.
Eye tracker calibration and validation
WT’s eye movements were recorded using an Eyelink II (SR Research; Osgoode, ON, Canada) binocular eye tracking system. The system has a scene camera that films the subject’s first person perspective, and allows free motion of the head and body. Point of gaze data was recorded as an average across each eye. Eye tracking in patients with central visual field loss is problematic because of the difficulty in calibrating the eye tracking signal. The Eyelink II normally uses a calibration procedure where the subject fixates a series of small points. One way to calibrate an eye tracker for an individual with central visual field loss is to calibrate to the PRL, as in the study by Turano et al. (2002). Given our interest in how PRLs are selected, and in changes that might occur dependent on the current task, we did not want to alter WT’s behaviour by directing him to use a certain PRL. Also, given the possibility of multiple PRL, it is difficult to know if only a single PRL would be used during calibration. Therefore, we used an alternative calibration method using the subject’s estimate of the fovea. A standard nine-point calibration procedure was adapted so that in place of fixating the small calibration points, WT instead centred his gaze onto a large cross (25° × 30°), held in place by the experimenter, that extended beyond the perimeter of his scotomas. WT centred his gaze on his estimate of the intersection of the cross using the portion of the cross visible in his peripheral retina. Normally sighted subjects can fixate the centre of a circle or the imagined intersection of two lines with less than 1° of error, when using targets up to 30° eccentricity (Sansbury et al., 1973). To ensure that our subject was able to reliably centre gaze on the cross intersection, two error measures were obtained, using fundus imaging and using repeatability measurements from the calibrated eye tracker.
Reliability
Fundus imaging (50° field of view, Topcon TRC 501A Fundus Camera: Topcon Corporation, Tokyo, Japan) was performed on both of WT’s eyes while he performed the fixation task. The fundus camera was modified by inserting a small paper cross into the optics. This allowed the subject to see the cross, about 50° high, 50° wide and 3° thick, and allowed photography of the location of the cross on the retina (Figure 2). Each eye was tested monocularly. WT was instructed to centre his eye on the cross and tell the technician when he was ready before a fundus photo was taken. WT was instructed to break for ~1 min between photos. Ten photos from each eye were taken in this manner. Image analysis was conducted using Adobe Photoshop CS to measure the distance of the centre of the optic disc to the centre of the fixation cross, using a methodology similar to that described by Timberlake et al. (2005). A second set of reliability measurements were obtained while WT was wearing the Eyelink II tracker. At the beginning and end of each trial session, WT was asked to centre his gaze on the fixation cross in a variety of locations across the visual field. For each location, the angular distance between the point of gaze cursor and the location of the centre of the fixation cross was measured. Descriptive statistics were calculated for both measures.
Figure 2.
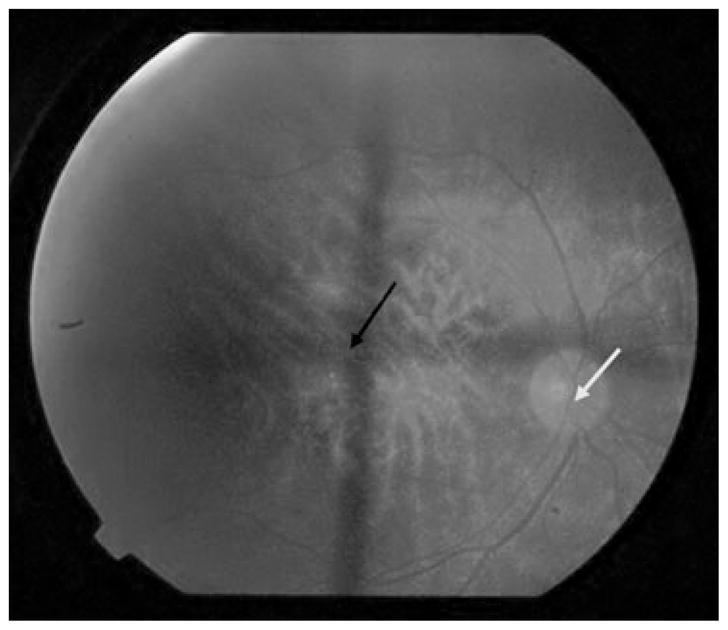
Example fundus image from WT (OD). Arrows indicate centre of fixation cross (black) and centre of the optic disc (white).
Accuracy
WT’s accuracy in aligning the fixation cross with his damaged fovea was measured. This is important because some patients claim to be fixating with central vision even when they are using a PRL (White and Bedell, 1990). Timberlake et al. (2005) examined normally sighted subjects using a SLO and measured the location of the centre of gaze (presumably the fovea) with respect to the optic disc. We were able to compare our results with those of Timberlake et al. (2005) by using the distance from WT’s optic disc to the centre of the fixation cross, i.e. his estimate of his fovea.
Video analysis of trials
After successful calibration, a point of gaze cursor was overlaid on each frame of the scene camera video and recorded using either a Hi-8 (model EVO-9650, Sony, New York, NY, USA) or MiniDV recorder (model BR-DV600 (BR-DV1000U), JVC, Wayne, NJ, USA). The resulting videos were manually coded frame by frame for the location of the point of gaze cursor and the presence or absence of fixation by two experienced coders. Frames with track losses were not included in any analyses. After the calibration procedure, the eye tracker point of gaze cursor indicated WT’s estimate of his foveas. The tasks the subject engaged in, making a sandwich, catching a ball and building a model, have been studied in previous experiments in our lab and were used as a baseline reference for comparison (Hayhoe et al., 2003, 2005; Mennie et al., 2007). With normally sighted subjects, we know when and where items are fixated in a particular task. Assuming that WT requires the same visual information as normally sighted subjects, we may infer the site of a task-relevant PRL by measuring the location of the task-relevant object relative to WT’s point of gaze. For example, normally sighted subjects usually foveate the tip of the knife while they spread peanut butter or jelly during sandwich making. When WT spreads peanut butter or jelly, he fixates above the knife tip so that it is ~20° in the periphery. From this example, we would claim that while spreading, WT used a PRL located 20° out in the lower visual field. Using this rationale, data across several tasks were coded for the distance between the point of gaze and the location of a task-relevant object. Estimates of PRL area were made using a fitted normal bivariate contour ellipse encompassing two standard deviations of the data: a more formal treatment of the technique can be found in Timberlake et al. (2005)
Experimental tasks
Making a sandwich
WT was seated in front of a desk covered by an opaque cloth to prevent any preview of the experimental setup. WT was instructed to make a peanut butter and jelly sandwich, cut it in two, and pour himself a drink. In addition to task-relevant items, several distracter items were placed on the table, to simulate a natural, moderately cluttered environment. WT was instructed to begin as soon as the cloth covering was removed. Eye movements were recorded, analysed manually and compared with the results from normally sighted individuals performing a similar task as reported by Hayhoe et al. (2003).
Model building
WT performed a model building task while seated at the table shown in Figure 3. The task required several reaches in a predetermined sequence to acquire the pieces necessary to complete the model. WT was instructed to gather four pieces in sequence attaching them together with nuts and bolts located at the bottom right of the table. Experimental methodology is discussed in detail by Mennie et al. (2007). The experimenter pointed out the reach locations prior to and during the experiment. Video analysis was conducted for fixations 200 ms before, and during each reach. Fixation strategies were compared against the results from normal subjects from the data collected by Mennie et al. (2007).
Figure 3.

Model building setup. (Left) Schematic of the model table layout. (Right) Uncovered table showing bins filled with parts for the model assembly. The subject needed to reach for pieces located in the bins (in sequence 1–4). Each piece combination was assembled in the work area and placed in the put down area when complete (Figure with permission from Mennie et al., 2007). The approximate visual angle subtended by pieces 1 and 3: 20° × 3°, pieces 2 and 4: 10° × 3°, nuts: 4° × 4°, bolts: 4° × 1° (assuming a distance of 60 cm from the centre of the tabletop to the subject).
To address if the PRL is systematically related to the spatial location of a reach target and/or the hand used, additional data were collected. WT sat at the same table but instead of building a model, he was instructed to reach for a nut placed in the centre of each of the eight bins along the top of the table. Before each reach, WT placed his reaching hand at the edge of the table in the centre. The order of reaches was randomized and WT completed two sets of reaches with each hand, giving 32 reaches in total. Video for each reach was analysed and the relationship between the PRL used and reach location was assessed via linear regression.
Catching a ball
WT’s eye movements were recorded while catching a tennis ball. WT and two experimenters stood in a triangle separated from each other by about 8 ft. The ball was thrown around the triangle from person to person. All throws had one bounce between the thrower and receiver. Hayhoe et al. (2005) previously examined eye movements in normally sighted subjects performing the same task [see Land and McLeod (2000) for similar findings in cricket]. While catching, subjects made predictive fixations to the bounce point of the ball and smoothly pursued the ball after the bounce. WT’s eye movement records were similarly analysed for bounce point prediction and smooth pursuit of the ball’s trajectory. Smooth pursuit gain was calculated from the ratio between the distance travelled by the eye cursor and the distance travelled by the ball (both relative to a point in the background scene to remove the influence of head movements).
Results
Calibration validation – reliability
The distance between the centre of WT’s optic disc and the centre of the fixation cross was measured for 10 fundus images. The standard deviation of this distance was 1.05° horizontal and 1.44° vertical (OD), and was 1.16° horizontal and 1.26° vertical (OS). This means that when WT was instructed to centre his gaze on the fixation cross, he was able to bring his eye back to the same position with about 2° to 3° of error assuming a 95% confidence interval.
In the second test of fixation reliability, measured from the eye tracker signal, on average the point of gaze cursor was 2° from the fixation cross with a standard deviation of 0.8°. Normally sighted subjects are able to refixate, in this case a central target, with much higher precision, with standard deviations of the order of seconds of arc (Timberlake et al., 2005). To estimate WT’s fixation stability, we estimated the area of the ellipse that contained 63.2% of the data while WT fixated the calibration points. The average fixation ellipse area was 2.43 deg2 for each calibration point, with an average of 3 s of fixation data for each point. Normally sighted older adults fixating a point in trials of 12.8 s had a mean of fixation ellipse area of 198 minarc2 (Kosnik et al., 1986). While WT has higher variability in these measures, our results show that this variance in centering gaze on the fixation cross and any resulting calibration error are small relative to the variance of the fixation distributions associated with a given task shown below.
Calibration validation – accuracy
We estimated the placement of the target during fundus imaging with respect to his fovea. To do this, the distance between the fixation cross centre and the centre of WT’s optic disc were measured. As WT’s foveal location is unknown, we can only compare his data with the range of values found in the normally sighted subjects. WT’s measurements were compared with a recent study by Timberlake et al. (2005) and are presented in Table 1. Measures for horizontal and vertical displacement OS and horizontal displacement OD are within 1° of Timberlake et al.’s mean value. Assuming 95% confidence intervals, only WT’s OD vertical mean location measure, a 3.2° difference from Timberlake et al.’s value, is likely to be outside the normally sighted distribution (unequal sample t-test, t = 2.73, p<0.01). These results indicate that in general, WT is placing the fixation cross in an area near the fovea in normally sighted subjects. If the fixation cross is centred approximately on the fovea during the eye tracker calibration, this allows a straightforward way (although with some error) to visualize the eye position data with overlays of the bilateral scotomas. It is possible that WT’s vertical error may corrupt our binocular visualization and the following data must be interpreted with this caveat.
Table 1.
Fixation accuracy measuring the location of the fixation cross relative to the centre of the optic disc
| OS |
OD |
|||
|---|---|---|---|---|
| Horizontal | Vertical | Horizontal | Vertical | |
| WT | 12.9° (1.2°) | 2.4° (1.3°) | 11.8° (1.4°) | 4.6° (1.2°) |
| Normally sighted Subjects | 12.6° (1.2°) | 1.4° (1.2°) | 12.6° (1.2)° | 1.4° (1.2°) |
| Difference | 0.3° | 1° | 0.8° | 3.2°* |
WT’s data are presented along with data from Timberlake et al. (2005) for fovea to optic disc measurements from 50 normally sighted subjects. Standard deviations are presented in parentheses. Note standard deviations in Timberlake et al. (2005) are calculated across subjects and were obtained from ellipses fitted to the fixation data.
Unequal sample t-test, t = 2.73, p < 0.01
Making a sandwich
Even the simple task of making a sandwich involves several individual subtasks. Hayhoe et al. (2003) found regularities across subjects in many of these subtasks. For example, while spreading jelly or peanut butter on bread, subjects tend to fixate the tip of the knife blade. When reaching to pick up an object, subjects fixate near the reaching hand’s future point of contact with that object. Using these previously collected data, we can plot the position of WT’s point of gaze with respect to the points of fixation observed in normally sighted subjects. We applied this technique to several subtasks present within sandwich making. Figure 4 shows data from four subtasks including spreading jelly on the bread, scooping the jelly from the jar, picking up a twist tie and picking up a bread bag.
Figure 4.

Spatial distribution of object features during fixations for four sample task-relevant objects during a sub-task in making a sandwich. Each marker represents the location of the task-relevant object during one fixation. Grey diamonds represent the hand’s contact point with the twist-tie, black diamonds represent the knife tip while scooping, black circles represent the hand’s contact point with the bread bag and grey circles represent the knife tip while spreading. Dashed ellipses indicate the perimeter of a bivariate ellipse fitted to encompass two standard deviations of the data.
While spreading jelly, WT places the tip of the knife in a ~10° × 10° area in the lower left visual field. When scooping the jelly out of the jar a smaller portion of a similar location is used. When picking up the twist-tie and bread bag, small sites in the lower right and lower left visual fields are used, respectively. Fixation duration proportions were compared between WT and normally sighted subjects. Proportions were used as WT took about 1 min longer to complete the task compared with the previous study. The conditions that WT operated under were not identical to the original Hayhoe et al.’s study (different objects on the table, presence of the experimenters), so it is difficult to attribute this increase only to central visual field loss. The two distributions largely overlap and WT’s distribution (individually comparing bins of 100 ms) falls within the error expected from normally sighted subjects for short fixation durations (<500 ms). However, WT did have a shorter mean duration, 410 ms, than the normal sighted mean, 506 ms (two sample t-test, df = 349, t = −2.48, p = 0.0135). This analysis was performed on all subtasks (28 subtasks were identified; additional data are available upon request). In general for most subtasks, WT primarily used the lower left visual field in each subtask but not exclusively. For instance, the lower right visual field was used when picking up the bag of bread, the bottle cap and the knife, all of which were close to the subject on the right hand side. The estimated bivariate ellipse area used by WT varied considerably, from ~7 deg2 when picking up a twist tie, to ~300 deg2 when spreading peanut butter on the bread.
Building a model
WT constructed a model, requiring several pieces to be picked up from a variety of spatial locations. During the assembly period, WT had to reach to areas containing pieces 1–4 and the bins with the nuts and bolts. This experimental setup is discussed comprehensively by Mennie et al. (2007). While reaching to pick up an object, normally sighted subjects tend to fixate near the future point of contact. WT’s fixation patterns were coded by marking the point of contact at the end of the reach as the peripheral locus during the reach. Fixations were analysed 200 ms before the subject started to reach, up to contact with the target. Figure 5a shows WT’s fixation data for reaches to the areas for pieces 1–4. WT again used PRLs of varying size, ranging from ~20 to 110 deg2, for pieces 1–4, and ~100 to 250 deg2, during reaches to the nuts and bolts, respectively. WT’s fixation durations were also analysed. There was a significant difference between WT’s mean fixation duration, 237 ms, and normal sighted subjects, 327 ms (two sample t-test, df = 60, t = −3.98, p = 0.0002). Horizontal coordinate values for object locations were binned into a binary category of left and right side divided along the middle of the tabletop. For objects on the right, the mean PRL centre was located in the lower right visual field (15°, −6.5°), whereas for objects on the left, the mean PRL centre was located in the lower visual field near the midline −0.5°, −11°). A regression analysis was performed using the spatial coordinates of the bins (using the centre of the table as the coordinate origin) as a predictor for PRL location. A positive relationship was found such that the PRL shifts toward the bin [B = 0.286°, F(1,24) = 25.78, p < 0.001]. No effect was found for the vertical dimension [F(1,24) = 0.024, p = 0.848]. These reaches were not evenly distributed across the table and were performed only with the right hand. Subsequent tests were run to systematically examine the relationship of PRL location with the reach target’s spatial location and/or the hand used to reach.
Figure 5.
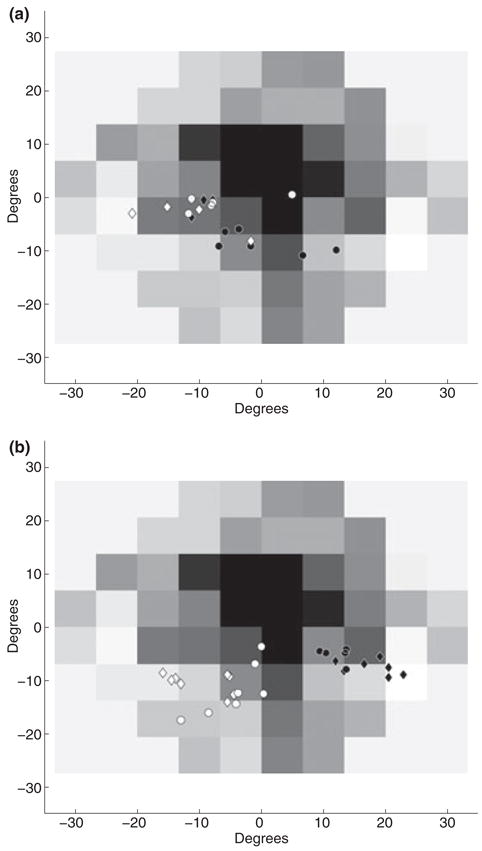
(a) Fixation data while reaching to a target during the assembly of a simple model. (b) Fixation data while reaching to the same target areas with the left hand. Data for reaches to other areas have been excluded for ease of comparison. In both figures, open diamonds and circles indicate the distribution of the point of finger contact on model pieces on the left hand side of the table, pieces 2 and 4, respectively. Filled diamonds and circles indicate the same for model pieces on the right hand side of the table, pieces 1 and 3, respectively.
WT performed 32 reaches (16 per hand) to eight spatial locations. Fixations were analysed 200 ms before the start of the reach, up to contact with the target. Figure 5b shows the distribution of object locations during fixation for the left hand reaches to areas 1–4. Bivariate ellipses fitted to fixation data for each reach area ranged from 10 to 110 deg2 for all eight reach locations. Comparing fixation duration distributions, WT’s mean fixation duration, 444 ms, was greater than expected for normally sighted subjects, 337 ms (t-test, df = 147, t = 3.2, p = 0.0016). Mean eye centred PRL location for an object on the right was (2°, −4°) whereas the mean location for objects on the left was (−11°, −3°). A regression analysis was performed, using target spatial location as a predictor for PRL location, again using the centre of the table as the origin of the coordinate system. When reaching with the right hand, the PRL used was marginally correlated with the spatial location of the target [B = 0.05°, R2 = 0.1, F(1,35)=3.96, p = 0.054]. No significant correlation was found in the vertical dimension [B=−0.01°, R2 = 0.0003, F(1,35)=0.01, p = 0.91]. For left hand reaches a correlation between horizontal target position and PRL location was found [B = 0.13°, R2 = 0.29, F(1,35)=14.5, p = 0.001]. A correlation between vertical target position and PRL location was also found [B = 0.303, R2 = 0.55, F(1,35)=42.84, p<.001].
Catching a ball
WT’s fixations were coded by observing the position of the ball with respect to the eye tracker’s point of gaze cursor for 17 successful catches. The ball was thrown to WT 24 times, on four trials the ball was not caught, three other trials were not used as a result of video problems. On all trials, WT made a saccade downward before the ball bounced on the ground, Figure 6a shows the location of the bounce point in WT’s visual field. On average, WT completed this saccade 238 ms (S.E. = 57 ms) before the ball arrived. For comparison, Hayhoe et al. (2005) found that normally sighted subjects completed the predictive saccade 53 ms (S.E. = 30 ms) before the bounce. On 42% of trials, WT made a single corrective saccade after the initial saccade (average of 169 ms, S.E. = 37 ms, after the first saccade). WT again used a region in the lower left visual field to monitor the bounce, spanning ~165 deg2. After the ball bounced upwards, WT initiated eccentric pursuit and tracked the ball with a gain varying from 0.2 to 1 until he completed the catch. All of the balls WT pursued travelled at ~50°/s. The retinal area used to initiate smooth pursuit was also located in the lower left visual field over a large area ~370 deg2. Figure 6b shows the spread of pursuit initiation points on the retina. A linear regression using eccentricity as predictor for pursuit gain found a significant correlation [B = −0.05, R2 = 0.39, F(1,16)=9.58, p = 0.007]. WT perfectly tracked four balls between 12–15°, but had reduced gain for greater eccentricities, potentially indicating that only a small zone of peripheral retina in the lower left field was capable of high gain tracking.
Figure 6.

(a) Visual field location of bounce points. (b) Smooth pursuit initiation points plotted on WT’s visual field. The circles have been scaled to roughly approximate the visual angle subtended by the ball.
Discussion
We have presented a case study of an individual with central visual field loss because of Stargardt’s disease. The subject’s eye movements were tracked in several tasks including making a sandwich, building a model and catching a ball. While limited in scope, this case study illustrates the feasibility of real world eye tracking of subjects with central visual field loss and reveals the visual strategies used by one such patient, WT. WT’s behaviour reveals that a well-defined PRL is not necessary for satisfactory performance in the tasks studied. We have shown that a PRL can vary widely within an individual and have dependencies related to the task and the stimuli used.
In general, WT used PRLs located in the lower left visual field. However, the location of the PRL varied, as did the area depending on the task and stimulus. Potentially, the use of multiple large PRL could be explained by poor fixation stability. However, reliability and accuracy of WT’s fixation ability rule out this explanation. While WT has fixation error larger than normally sighted individuals, this error is much smaller than the extent of the areas used as PRLs. Timberlake et al. (2005) found that PRLs tend to increase with distance from the fovea. This result agrees with some of WT’s fixation strategies, predicting PRLs of ~100 deg2 at 15° eccentricity. However this would not explain the variability in PRLs, because PRLs centred on similar retinal eccentricities yielded varying areas. Given our methodology, we cannot rule out that WT eccentrically fixated different areas from control subjects leading to misestimates of PRL size. However, while catching a ball, a situation where the ball must be attended to and subtends a small visual angle, WT’s fixation strategies are strikingly similar to the other tasks, suggesting that our results are not a product of WT merely making saccades within large objects. We must note that WT performed these tasks without his normal eyesight correction. While WT reported that he did not feel impaired by this, lack of correction could decrease fixation stability and explain part of the data’s variability. Research by Reinhard et al. (2007) has suggested that Stargardt’s patients may infrequently exhibit multiple PRL. Our subject may not be representative of this population and we cannot make any claims beyond the behaviour we observed. However, it is also possible that the Reinhard et al.’s result is in part because of the nature of the patients’ task, eccentrically fixating a cross. As we have stressed, multiple PRL may only be evident when task demands allow them.
The variation in the selection of PRL appears to stem from task and stimulus factors. For example, while making a sandwich, multiple PRL were identified for each subtask and the extent of the PRL was associated with the task. While building a model, multiple PRL were used and the centre of the PRL was shifted by the spatial location of the reach target. For instance, the PRL was shifted towards the pickup target, possibly as an opportunistic strategy to minimize head and eye movements when shifting the PRL. WT’s behaviour indicates that peripheral retina has many viable sites to accomplish the studied tasks.
WT’s performance while catching a ball provides further evidence for this proposition. WT made anticipatory fixations to the bounce point of the ball and exhibited eccentric pursuit with high gain using most of his lower left visual field. Notably, the pursuit tracking was nearly perfect for eccentricities around 12–15°. Eccentric pursuit was noted by Schuchard et al. (1999) but the dynamics of this eccentric pursuit were not discussed in depth. Previous studies have found that pursuit gain decreases with eccentricity (Lisberger and Westbrook, 1985; Pidcoe and Wetzel, 2006). WT also displays a decrease in gain with increasing eccentricity, but this decrease starts around 15° eccentricity. This suggests that WT’s pursuit system has recalibrated to perform high gain tracking over a number of initiation sites in his lower left visual field.
Overall, our results show WT used a large portion of peripheral retina for the three tasks. PRL selection may be an opportunistic process that exploits much of peripheral retina and is modulated by the location and size of visual targets. These results are from one individual and may not be representative of the population with central visual field loss. However, WT’s behaviour does indicate that using multiple large PRLs allows satisfactory performance in all of the tested experimental tasks. Given the unconstrained nature of the tasks more subjects should be examined to determine performance differences across subjects and how this relates to PRL usage.
Previous studies have mainly examined PRL use while reading or searching, requiring high spatial frequency information. In these circumstances, it may be that the use of one or two spatially restricted PRL is the best information gathering strategy. However, in many real world scenarios much of peripheral retina may be adequate for a variety of tasks. Opportunistic PRL selection may occur contingent on current object locations and task demands. Rehabilitation techniques would benefit from further study of common tasks that low vision individuals perform. Our results provide several interesting examples of fixation strategies, but further study is necessary to know how these findings generalize to patients with and without trained PRLs. Overall, our findings indicate that when researchers and clinicians consider training eccentric viewing strategies, it is reasonable to consider the broader everyday needs of vision and the influence of task and stimuli on PRL selection.
Acknowledgments
This work was supported by NIH EY-05729 and RR 06853. The authors thank Krystel Huxlin, Bill Merigan, Dan Gray, Jessica Wolfing and Terry Schaefer for assistance with data collection at the UR/Strong Hospital.
Footnotes
Portions of this research were previously presented at the Vision 2005 conference
References
- Crossland MD, Culham LE, Rubin GS. Fixation stability and reading speed in patients with newly developed macular disease. Ophthal Physiol Opt. 2004;24:327–333. doi: 10.1111/j.1475-1313.2004.00213.x. [DOI] [PubMed] [Google Scholar]
- Crossland MD, Culham LE, Kabanarou SA, Rubin GS. Preferred retinal locus development in patients with macular disease. Ophthalmology. 2005;112:1579–1585. doi: 10.1016/j.ophtha.2005.03.027. [DOI] [PubMed] [Google Scholar]
- Deruaz A, Whatham AR, Mermoud C, Safran AB. Reading with multiple preferred retinal loci: implications for training a more efficient reading strategy. Vision Res. 2002;42:2947–2957. doi: 10.1016/s0042-6989(02)00354-1. [DOI] [PubMed] [Google Scholar]
- Deruaz A, Goldschmidt M, Whatham AR, Mermoud C, Lorincz EN, Schnider A, Safran AB. A technique to train new oculomotor behavior in patients with central macular scotomas during reading related tasks using scanning laser ophthalmoscopy: immediate functional benefits and gains retention. BMC Ophthalmol. 2006;6:35. doi: 10.1186/1471-2415-6-35. [DOI] [PMC free article] [PubMed] [Google Scholar]
- Duret F, Issenhuth M, Safran AB. Combined use of several preferred retinal loci in patients with macular disorders when reading single words. Vision Res. 1999;39:873–879. doi: 10.1016/s0042-6989(98)00179-5. Erratum in: 39(16),2793. [DOI] [PubMed] [Google Scholar]
- Fletcher DC, Schuchard RA. Preferred retinal loci relationship to macular scotomas in a low-vision population. Ophthalmology. 1997;104:632–638. doi: 10.1016/s0161-6420(97)30260-7. [DOI] [PubMed] [Google Scholar]
- Hayhoe MM, Shrivastava A, Mruczek R, Pelz JB. Visual memory and motor planning in a natural task. J Vis. 2003;3:49–63. doi: 10.1167/3.1.6. [DOI] [PubMed] [Google Scholar]
- Hayhoe M, Mennie N, Sullivan B, Gorgos K. The role of internal models and prediction in catching balls; Proceedings of the Twentieth National Conference on Artificial Intelligence AAAI-05; Menlo Park, CA, USA: Association for the Advancement of Artificial Intelligence; 2005. [Google Scholar]
- Kosnik W, Fikre J, Sekuler R. Visual fixation stability in older adults. Invest Ophthalmol Vis Sci. 1986;27:1720–1725. [PubMed] [Google Scholar]
- Land MF, Hayhoe MM. In what ways do eye movements contribute to everyday activities? Vision Res. 2001;41:3559–3565. doi: 10.1016/s0042-6989(01)00102-x. [DOI] [PubMed] [Google Scholar]
- Land MF, McLeod P. From eye movements to actions: how batsmen hit the ball. Nat Neurosci. 2000;3:1340–1345. doi: 10.1038/81887. [DOI] [PubMed] [Google Scholar]
- Land MF, Mennie N, Rusted J. The roles of vision and eye movements in the control of activities of daily living. Perception. 1999;28:1311–1328. doi: 10.1068/p2935. [DOI] [PubMed] [Google Scholar]
- Lei H, Schuchard RA. Using two preferred retinal loci for different lighting conditions in patients with central scotomas. Invest Ophthalmol Vis Sci. 1997;38:1812–1818. [PubMed] [Google Scholar]
- Lisberger SG, Westbrook LE. Properties of visual inputs that initiate horizontal smooth pursuit eye movements in monkeys. J Neurosci. 1985;5:1662–1673. doi: 10.1523/JNEUROSCI.05-06-01662.1985. [DOI] [PMC free article] [PubMed] [Google Scholar]
- Mennie N, Hayhoe M, Sullivan B. Look-ahead fixations: anticipatory eye movements in natural tasks. Exp Brain Res. 2007;179:427–442. doi: 10.1007/s00221-006-0804-0. [DOI] [PubMed] [Google Scholar]
- Nilsson UL, Frennesson C, Nilsson SE. Patients with AMD and a large absolute central scotoma can be trained successfully to use eccentric viewing, as demonstrated in a scanning laser ophthalmoscope. Vision Res. 2003;43:1777–1787. doi: 10.1016/s0042-6989(03)00219-0. [DOI] [PubMed] [Google Scholar]
- Pidcoe PE, Wetzel PA. Oculomotor tracking strategy in normal subjects with and without simulated scotoma. Invest Ophthalmol Vis Sci. 2006;47:169–178. doi: 10.1167/iovs.04-0564. [DOI] [PubMed] [Google Scholar]
- Reinhard J, Messias A, Dietz K, Mackeben M, Lakmann R, Scholl HP, Apfelstedt-Sylla E, Weber BH, Seeliger MW, Zrenner E, Trauzettel-Klosinski S. Quantifying fixation in patients with Stargardt disease. Vision Res. 2007;47:2076–2085. doi: 10.1016/j.visres.2007.04.012. [DOI] [PubMed] [Google Scholar]
- Safran AB, Duret F, Issenhuth M, Mermoud C. Full text reading with a central scotoma: pseudo regressions and pseudo line losses. Br J Ophthalmol. 1999;83:1341–1347. doi: 10.1136/bjo.83.12.1341. [DOI] [PMC free article] [PubMed] [Google Scholar]
- Sansbury RV, Skavenski AA, Haddad GM, Steinman RM. Normal fixation of eccentric targets. J Opt Soc Am. 1973;63:612–614. doi: 10.1364/josa.63.000612. [DOI] [PubMed] [Google Scholar]
- Schuchard RA. Adaptation to macular scotomas in persons with low vision. Am J Occup Ther. 1995;49:870–876. doi: 10.5014/ajot.49.9.870. [DOI] [PubMed] [Google Scholar]
- Schuchard RA. Preferred retinal loci and macular scotoma characteristics in patients with age-related macular degeneration. Review Can J Ophthalmol. 2005;40:303–312. doi: 10.1016/S0008-4182(05)80073-0. [DOI] [PubMed] [Google Scholar]
- Schuchard RA, Naseer S, de Castro K. Characteristics of AMD patients with low vision receiving visual rehabilitation. J Rehabil Res Dev. 1999;36:294–302. [PubMed] [Google Scholar]
- Sunness JS, Bressler NM, Maguire MG. Scanning laser ophthalmoscopic analysis of the pattern of visual loss in age-related geographic atrophy of the macula. Am J Ophthalmol. 1995;119:143–151. doi: 10.1016/s0002-9394(14)73866-8. [DOI] [PubMed] [Google Scholar]
- Timberlake GT, Sharma MK, Grose SA, Gobert DV, Gauch JM, Maino JH. Retinal location of the preferred retinal locus relative to the fovea in scanning laser ophthalmoscope images. Optom Vis Sci. 2005;82:177–185. doi: 10.1097/01.opx.0000156311.49058.c8. [DOI] [PubMed] [Google Scholar]
- Turano KA, Geruschat DR, Baker FH. Fixation behavior while walking: persons with central visual field loss. Vision Res. 2002;42:2635–2644. doi: 10.1016/s0042-6989(02)00299-7. [DOI] [PubMed] [Google Scholar]
- Turano KA, Geruschat DR, Baker FH. Oculomotor strategies for the direction of gaze tested with a real-world activity. Vision Res. 2003;43:333–346. doi: 10.1016/s0042-6989(02)00498-4. [DOI] [PubMed] [Google Scholar]
- White JM, Bedell HE. The oculomotor reference in humans with bilateral macular disease. Invest Ophthalmol Vis Sci. 1990;31:1149–1161. [PubMed] [Google Scholar]