

Abstract
Background:
Evidence suggests that Epstein-Barr virus (EBV) plays a role in triggering or perpetuating disease activity in multiple sclerosis (MS).
Methods:
We investigated 100 subjects (50 clinically isolated syndrome [CIS], 25 relapsing-remitting [RR] MS, 25 primary progressive [PP] MS) for 1) evidence of EBV reactivation and 2) disease activity as indicated by serial gadolinium (Gd)-enhanced MRIs over a 5-year period. EBV DNA in blood was quantified by real-time quantitative PCR and EBV serology for anti-Epstein-Barr virus nuclear antigen 1 (EBNA-1) immunoglobulin G (IgG), anti-viral capsid antigen (VCA) IgG, and anti-EBV IgM. Data were analyzed using repeated measures analysis, analysis of variance, and logistic regression analysis.
Results:
All subjects had serologic evidence of previous EBV infection, but no lytic reactivation was detected. Significant differences in EBNA-1 IgG titers were found between subgroups, highest in the RRMS cohort compared with PPMS (p < 0.001) and CIS (p < 0.001). Gd-enhancing lesions on MRI correlated with EBNA-1 IgG (r = 0.33, p < 0.001) and EBNA-1:VCA IgG ratio (r = 0.36, p < 0.001). EBNA-1 IgG also correlated with change in T2 lesion volume (r = 0.27, p = 0.044) and Expanded Disability Status Scale score (r = 0.3, p = 0.035).
Conclusions:
The correlation between elevated Epstein-Barr virus nuclear antigen 1 (EBNA-1) immunoglobulin G (IgG) and gadolinium-enhancing lesions suggests an association between Epstein-Barr virus (EBV) infection and multiple sclerosis (MS) disease activity. The heightened immune response to EBV in MS is specifically related to EBNA-1 IgG, a marker of the latent phase of the virus. The lack of association between acute viral reactivation in the peripheral blood and Gd+ lesions suggests a limited role of the former in driving disease activity.
GLOSSARY
- CI
= confidence interval;
- CIS
= clinically isolated syndrome;
- CMV
= cytomegalovirus;
- EBNA-1
= Epstein-Barr virus nuclear antigen 1;
- EBV
= Epstein-Barr virus;
- EDSS
= Expanded Disability Status Scale score;
- FOV
= field of view;
- Gd
= gadolinium-DTPA;
- HLA
= human leukocyte antigen;
- IgG
= immunoglobulin G;
- IL
= interleukin;
- IQR
= interquartile range;
- MHC
= major histocompatibility complex;
- MS
= multiple sclerosis;
- OCB
= oligoclonal IgG bands;
- OR
= odds ratio;
- PHV-1
= phocine herpesvirus type 1;
- PPMS
= primary progressive multiple sclerosis;
- RRMS
= relapsing-remitting multiple sclerosis;
- TE
= echo time;
- TR
= repetition time;
- VCA
= viral capsid antigen;
- VZV
= varicella zoster virus.
Multiple sclerosis (MS) is an inflammatory demyelinating disorder of the CNS of unknown etiology. Evidence suggests that MS is an autoimmune condition1–3 despite no definite immune markers correlating with clinical course. It is likely that an interaction between genetic and environmental factors causes and possibly perpetuates the disease.4,5 Epstein-Barr virus (EBV) is a ubiquitous human herpesvirus infecting >90% of the healthy population. Seroepidemiologic evidence shows the risk of developing MS is greater in individuals previously exposed to EBV, the combined risk of MS being 2.3 times higher in subjects with a history of infectious mononucleosis,6,7 whereas the risk of developing MS in seronegative subjects is extremely low (OR 0.06 [95% confidence interval (CI) 0.03–0.13]).6 EBV reactivation has been described using PCR for viral DNA and serologic indices; however, the evidence for an association with MS disease activity is controversial.8–10 Others have hypothesized that peripheral EBV reactivation activates autoreactive T cells, driving CNS inflammation by molecular mimicry.11,12
Serial MRI studies in MS have shown that most new MS lesions enhance on T1-weighted MRI following administration of gadolinium-DTPA (Gd).13,14 Gd-enhancing (Gd+) lesions are 5 to 10 times more frequent than clinical relapses and persist for approximately 4 weeks.15,16 In this study, we therefore sought to identify peripheral EBV reactivation using PCR and serologic testing in subjects with MS and to correlate these data with Gd+ lesions on serial MRI as a marker of disease activity.
METHODS
We studied 100 subjects who from 1995 onwards had taken part in longitudinal MRI studies of MS at the NMR Research Unit of the UCL Institute of Neurology in London. Subjects had MRI scans at baseline and months 1, 2, 3, 6, 12, 18, 24, 30, 36, and 60. Blood samples (whole blood and plasma) were collected and stored at −80°C. Fifty subjects with clinically isolated syndrome (CIS), 25 with relapsing remitting (RR) MS, and 25 with primary progressive (PP) MS were included.17 Patients were consented to take part in longitudinal MRI studies which included storage of blood samples in a specimen library for future use. This study was approved by the National Hospital for Neurology and Neurosurgery and Institute of Neurology joint research and ethics committee.
Detection of EBV DNA in plasma by real time PCR.
DNA was extracted from 200 μL plasma using the Qiagen QiaCube with QIAmp DNA blood mini kit (Hilden, Germany). A fixed amount of phocine (seal) herpesvirus type 1 (PHV-1) was added to the plasma prior to extraction as an internal control for both the extraction and amplification stages. A multiplex quantitative real-time PCR assay for EBV and PHV-1 was performed using an Applied Biosystems 7500 real-time PCR system (Warrington, UK) in a total reaction mixture of 50 μL containing 20 μL DNA extract and 30 μL Applied Biosystems universal master-mix with 400 nmol of each forward and reverse primer and 200 nmol of each probe. The sequences of the EBV and PHV-1 primers and probes are given in table e-1 on the Neurology® Web site at www.neurology.org (EBV sequences provided by Dr. Jeremy Garson, UCL). Thermal cycling consisted of 10 minutes at 95°C for initial denaturation and DNA polymerase activation, followed by 45 cycles of denaturation at 95°C for 15 s and annealing/extension at 60°C for 1 min. Each assay contained template negative controls and a quantitative standard curve dilution run in duplicate.
EBV-specific serology.
We assessed the presence of IgM antibodies to viral capsid antigen (VCA) and IgG antibodies to VCA and Epstein-Barr virus nuclear antigen 1 (EBNA-1) with the automated Liaison® quantitative chemiluminescent assay. Samples with values > upper limit of detection were diluted to extend the range of detection. VCA IgM was considered negative if <20 U/mL, 20–40 U/mL was considered equivocal level, >40 U/mL was considered positive. VCA IgG was considered negative if <20 U/mL, 20–40 U/mL was considered equivocal, and >40 U/mL was considered positive. EBNA-1 IgG was considered negative if <5 U/mL, 5–20 U/mL was considered equivocal, and >20 U/mL was considered positive. These ranges were recommended by the kit manufacturer. Using a further dilution step, the upper limit of detection was 7,500 U/mL for VCA IgG and 6,000 U/mL for EBNA-1 IgG (table e-2).
Serology for control viruses.
A single sample from each subject (100 in total) was randomly selected for additional testing for cytomegalovirus (CMV), varicella zoster virus (VZV), and measles IgG using commercial kits from Virion Serion (Launch Diagnostics). CMV was chosen as another leukotropic herpesvirus, VZV (herpesvirus) and measles as two other common viruses. Twenty healthy control samples were included for comparative purposes. CMV IgG was considered negative if <25, equivocal if 25–40, and positive if >40 U/mL. Measles IgG negative <150, equivocal 150–200, and positive >200 U/mL. VZV IgG negative <50, equivocal 50–100, and positive >100 U/mL (table e-2).
MRI: T1 gadolinium-enhanced scans and T2-weighted scans.
Serial 2D spin echo T1-weighted MRI scans (before and after Gd administration) covering the whole brain were obtained for all subjects on a 1.5-T GE scanner (General Electric, Milwaukee, WI) with the same matrix 256 × 256 and a field of view (FOV) of 24 cm2 (repetition time [TR] 540 msec; echo time [TE] 20 msec; 28 slices of 5-mm thickness) for the RRMS and PPMS cohorts and TR 600 msec, TE 17 msec, 46 slices of 3 mm thickness for the CIS cohort. Postcontrast scans were acquired 20 minutes after administration of Gd (0.1 mmol/kg for the CIS cohort and 0.3 mmol/kg in the RRMS and PPMS cohorts). MRI scans were classified as active if there was at least one Gd+ lesion and non-active in those without. The total number of Gd+ lesions was also recorded. T2-weighted images were acquired in all patients using 2D dual-echo spin echo MRI and T2 lesion volumes measured using semiautomated contouring on electronic images, as previously described.18 All MRI data were collected by researchers at the NMR Research Unit who were blinded to clinical details.
Statistical analysis.
Data were analyzed using SPSS 16 software and Sigma plot 9.0 to generate figures. Repeated measures analysis was used to detect changes over time within subjects. Analysis of variance on ranks and logistic regression models were used to detect differences between clinical subgroups and the relationship between immunologic and MRI findings. Median values of antibody titers were used as the data were not normally distributed. A p value <0.05 (two-tailed analysis) was considered significant. The funding body did not play a role in the study design, collection, analysis, or interpretation of data.
RESULTS
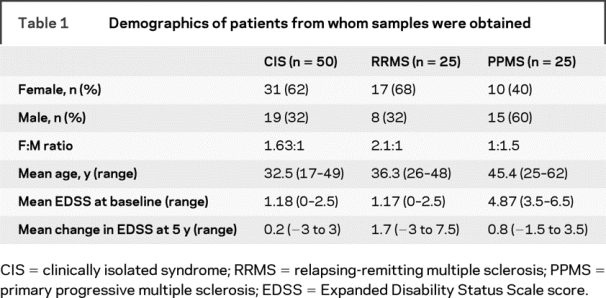
The baseline demographics of the CIS and RRMS cohorts were similar with respect to age at enrollment, female:male ratio, and baseline Expanded Disability Status Scale score (EDSS); subjects with PPMS were older, had a higher EDSS score at baseline, and the female:male ratio was reversed (table 1). The change in EDSS during the study was highest in the RRMS cohort (mean = 1.7; range −3 to 7.5) as compared to subjects with PPMS (0.8; −1.5 to 3.5) and CIS (0.2; −3 to 3). Of 100 subjects, complete blood samples and MRI datasets, obtained at 450 timepoints, were available for this study. A total of 121 data points from CIS subjects, 168 from the RRMS cohort, and 161 from patients with PPMS were available for analysis. The mean number of timepoints per subject was 4.5 (range 2–8). Twelve subjects remained CIS for the duration of the study; all other subjects converted to CDMS.19,20 Of the 12 remaining patients with CIS, one subject developed two Gd+ lesions at a single timepoint. Five subjects with RRMS received interferon beta treatment. Treatment was started between years 3 and 5 in all cases; the 5-year data points were excluded from the MRI analysis.
Table 1 Demographics of patients from whom samples were obtained
PCR and serology.
The sensitivity of the assay to reliably detect EBV DNA was 159 copies/mL. EBV DNA was detected in eight samples of five RRMS subjects. This was in low copy numbers, mostly beneath the sensitivity of the assay (mean 40 c/mL, range 15–240 c/mL). These all occurred at timepoints when the patients' MRI showed a Gd+ lesion but this finding was not a significant predictor of Gd+ lesions.
All subjects showed serologic evidence of previous EBV infection. Eleven subjects on 13 occasions had transiently positive VCA IgM: 3 RRMS, 2 PPMS, and 6 CIS subjects; there was no association with Gd+ lesions. Distinct patterns of IgG response to EBNA-1 and VCA were seen in subjects with relapsing disease as compared with those subjects who remained CIS at the end of the 5-year follow-up or with PPMS (figure 1, A and B). Subjects with RRMS generated higher median EBNA-1 IgG levels (670 [interquartile range (IQR) 251–1,683]) than those with PPMS (267 [IQR 107–650]) or CIS (419 [IQR 38–655]) and the difference was more pronounced when the CIS cohort developing CDMS were considered separately (780 [IQR 400–3,500]). This was not the case for VCA IgG, which was higher in the PPMS cohort. As IgG titers were not normally distributed, by using the ratio of EBNA-1:VCA IgG we generated a linear scale to describe serologic responses in each group. Rates of seropositivity for other viruses tested were 55 of 100 (55%) CMV, 97 of 100 (97%) VZV, and 96 of 100 (96%) measles. The clinical subtype was not found to be a predictor of antibody levels to these viruses.

Figure 1 Pattern of humoral response in clinical subgroups
(A) Box plot of Epstein-Barr virus nuclear antigen 1 (EBNA-1) immunoglobulin G (IgG) (U/mL) by clinical subgroup. Median value and 95% confidence interval indicated. There are significant differences between subjects with relapsing-remitting multiple sclerosis (RRMS) and primary progressive multiple sclerosis (PPMS), and also between subgroups with RRMS and clinically isolated syndrome (CIS). (B) Box plot of viral capsid antigen (VCA) IgG (U/mL) by clinical subgroup. VCA levels were highest in PPMS. Significant differences were detected between CIS/PPMS and between RRMS/PPMS. (C) Box plot of EBNA-1 IgG titer in patients with non-active vs patients with active MRI. Samples from patients with active MRI had higher levels of anti-EBNA-1 IgG. (D) Comparison of the ratio of anti-EBNA-1:VCA IgG titers in patients with non-active/active MRI.
Gd-enhancing lesions and T2 lesion volumes.
Subjects with active scans had significantly higher median EBNA-1 IgG titers compared to subjects with non-active scans (median 791 [95% CI 414–1704] vs 251 [95% CI 82–599], p < 0.001). There was a correlation of EBNA-1 IgG titer with number of Gd+ lesions (Spearman r = 0.33, p < 0.001). The ratio of EBNA-1 IgG:VCA IgG was also significantly higher in samples at time of a Gd+ lesion (3.8 [95% CI 1.4–6.4] Gd+ vs 1.008 [95% CI 0.03–2.0] Gd-negative, p < 0.001, Spearman r = 0.36, p < 0.001) (figure 1, C and D; figure 2).

Figure 2 Scatterplot of log (number of gadolinium-enhancing lesions + 1) and ratio of anti-EBNA-1:VCA IgG
Subjects recruited in the CIS cohort received standard dose Gd. Hence, it was considered possible that in subjects with CIS, fewer Gd+ lesions were detected than in the groups receiving triple dose Gd. Therefore, subgroup analysis was performed to analyze the relationship of EBNA-1 IgG and ratio of EBNA-1:VCA IgG with Gd+ lesions within each subgroup. Subjects who converted from CIS to CDMS had more Gd+ lesions than those remaining CIS for the duration of the study (table e-3). The median EBNA-1 IgG titer and ratio of EBNA-1:VCA IgG was consistently higher in subjects with active scans than those with non-active scans. The correlation with the number of Gd+ lesions remained significant in patients with CIS converting to RRMS as well as the RRMS and PPMS cohorts (table 2). Using repeated measures analysis, there was no effect of timepoint on serologic indices or appearance of new Gd+ lesions.
Table 2 Median values and interquartile ranges of EBNA-1 IgG titers and EBNA-1:VCA IgG ratios in patients with clinically isolated syndromes (CIS), patients who converted from CIS to relapsing remitting (RR) multiple sclerosis (CIS/RRMS), patients with RRMS, and patients with primary progressive multiple sclerosis (PPMS)

The change in T2 lesion volume (mm3) from baseline to last follow-up was calculated for each subject and then correlated with the mean individual EBNA-1 and VCA IgG titers. Regression analysis of all subjects found EBNA-1 IgG was a significant predictor of T2 lesion volume change (p = 0.025) and correlated with change in T2 lesion volume (r2 = 0.26, p = 0.035). Subgroup analysis: CIS T2 lesion volume change (r2 = 0.359, p = 0.018), RRMS (r2 = 0.31, p = 0.051), and PPMS (r2 = 0.074, p = 0.73). There was no significant correlation of VCA IgG with T2 lesion volume change.
Change in EDSS.
EBNA-1 IgG level was also found to be a predictor of change in EDSS over the duration of the study (p = 0.035) and titer correlated with change in EDSS (r2 = 0.3, p = 0.004), CIS cohort (r2 = 0.335, p = 0.028), RRMS cohort (r2 = 0.34, p = 0.04), and PPMS (not significant).
To evaluate whether the elevated EBNA-1 IgG in subjects with more active disease is a specific finding or due to nonspecific hyperresponsiveness of the immune system, we tested a cross-sectional sample set, consisting of 100 samples from the CIS/MS cohorts and 20 randomly selected healthy control samples for CMV, VZV, and measles IgG. Median titers were compared between clinical groups and healthy controls and correlation between viral titers and Gd+ lesions was tested. EBNA-1 IgG was the only antibody whose titer was consistently different between subgroups and correlated with Gd+ lesions (table 3). Neither age nor gender had any influence on the detected associations.
Table 3 Median titers (U/mL) and interquartile ranges of antibodies against virus epitopes detected in 1) 100 randomly selected samples from patients with clinically isolated syndrome (CIS), relapsing remitting multiple sclerosis (RRMS), and primary progressive multiple sclerosis (PPMS), and 2) samples from 20 healthy controls

DISCUSSION
In this study, we have shown, in a large MS/CIS cohort, the absence of significant lytic reactivation of EBV in the periphery either by direct detection of viral DNA in plasma or serologic evidence of reactivation, defined by VCA IgM response or significant fall in EBNA-1 IgG. However, consistent with prior reports, we found that all subjects showed evidence of prior EBV infection. This provides further support for the hypothesis that previous EBV infection may be a necessary cofactor for developing MS. The pattern of serologic response was distinct between clinical subgroups, which may imply a different immunologic response to primary infection with EBV, which subsequently determines the clinical phenotype of disease. The higher levels of EBNA-1 IgG in CIS patients converting to CDMS within 5 years may also be a useful biomarker in the future but further studies are required to investigate this. We found that higher titers of EBNA-1 IgG were associated with the development of Gd+ lesions on MRI. This elevation of EBNA-1 IgG is independent of VCA IgG titers. We also found that a higher EBNA-1 IgG titer predicted increased T2 lesion volume change and EDSS progression over the study period, particularly in the CIS and RRMS cohorts. The dose of Gd administered in the CIS cohort was lower than in the other study groups; thus each subgroup was also analyzed separately. The elevation of EBNA-1 IgG with Gd+ lesions remained consistent. Triple dose Gd is used as a more sensitive measure of lesion activity, detecting up to 75% more lesions than single dose Gd.21,22 However, while a higher dose of Gd results in higher numbers of Gd+ lesions detected, the number of non-active scans becoming active is low.18 Against this backdrop it was justified to categorize scans as either active or non-active to report differences in antibody profiles.
Elevated levels of IgG to other viruses have been described in relation to MS.23–25 We therefore tested the serologic response to other herpesviruses (CMV and VZV) and measles (another ubiquitous virus). Although antibodies to other viruses were elevated in some subjects, the levels were not found to correlate with EBNA-1 IgG or with presence of Gd+ lesions, suggesting that hyperresponsiveness of the immune response to EBV is specifically related to EBNA-1 IgG and—by inference—to the latent phase of the virus.
EBV is a ubiquitous virus infecting ∼90% of the adult population worldwide. Primary infection usually occurs in the first decade of life and is largely asymptomatic. However, in industrialized countries ∼50% of the population experience primary infection at a later age and are more likely to develop infectious mononucleosis.26 EBV infects naive human B cells causing clonal expansion of these cells and subsequent lifelong latent infection in mature memory B cells. In the resting memory B cell no proteins are actively expressed and antigen cannot be detected on the surface of these cells.12 Of all the EBV proteins, EBNA-1 is consistently expressed in dividing EBV-infected B cells of healthy carriers27 and is a dominant antigen for both humoral and cellular immune responses. Anti-EBNA-1 IgG has previously been described as an independent risk factor in subjects destined to develop MS.28,29 EBNA-1 IgG and T-cell responses are selectively increased in subjects with MS and are known to target myelin antigens.30 In over 95% of subjects with CDMS, local synthesis of oligoclonal IgG bands (OCB) can be detected in the CSF,31 and a proportion of OCB recognize EBV-specific antigens. Three independent studies have extracted peptides homologous with EBV from random peptide libraries using CSF-derived MS IgG and have shown intrathecal IgG synthesis reactive to EBV protein.32–34 There are sequence homologies between EBNA-1 and myelin proteins and EBV infection of B cells induces the expression of heat shock protein αB crystalline, which in turn is homologous with myelin basic protein and may explain crossreactivity of EBNA-1 antibodies and myelin basic protein.11
The phenomenon of epitope spreading has also been described in subjects with MS who show increased T-cell–mediated activity against a broader range of epitopes of specific antigens as compared to healthy controls. This has been described both in adults and children with MS.35 These broadened responses to EBV antigens are specific to EBNA-1 and not seen in response to VCA. This may explain the raised total EBNA-1 IgG we see in this study (and many others) and future work to elucidate the epitopes that these antibodies are directed toward would be useful in answering this question.
Intrathecal B-cell follicles, which are closely associated with subpial gray matter lesions, have been described in postmortem brain tissue of subjects with MS.36 More recently, the same group has reported high levels of EBV-infected B cells in such follicles in 21 of 22 postmortem MS brain specimens, a finding not seen in neurologic control cases. Fifty percent of these subjects also showed anti-EBV IgG in CSF collected postmortem.37 These results corroborate our findings of elevated EBNA-1 IgG in subjects with more active disease. A pool of EBV-infected memory cells may exist both peripherally and centrally that generate or sustain a population of autoreactive T cells, thereby mediating the inflammatory response in MS.
AUTHOR CONTRIBUTIONS
R.A.F. and G.G. designed this study. Data collection was pursued by R.A.F., D.A., G.R.W., D.A.C., L.F., J.S., and Z.K., statistical analysis by R.A.F., G.G., and K.S., and discussion of findings by all authors. Literature research was done by R.A.F. and G.G. R.A.F. drafted the manuscript, which was then revised, edited, and finally approved for submission by all authors.
ACKNOWLEDGMENT
The authors thank Tanja Rockenbach, Vandna Shah, and Dola Oweyemi of the Virology Department at the Royal London Hospital for their help in establishing the automated serology testing. They also thank Alan Thompson and Declan Chard of the NMR Unit for their support and the staff of the Neuroimmunology Unit at the UCL-Institute of Neurology who processed and stored the blood samples used in this study.
DISCLOSURE
Gavin Giovannoni has received consulting fees from Bayer-Schering Healthcare, Biogen-Idec, GlaxoSmithKline, Merck-Serono, Novartis, Protein Discovery Laboratories, Teva-Aventis, and UCB Pharma; lecture fees from Bayer-Schering Healthcare, Biogen Idec, and Teva-Aventis; and grant support from Bayer-Schering Healthcare, Biogen-Idec, Merck-Serono, Merz, Novartis, Teva-Aventis, and UCB Pharma. David Miller received honoraria from Biogen, Schering, Novartis, and GSK for consulting services and/or speaking at meetings; reimbursements as Co-Chief Editor of the Journal of Neurology; and financial support from GlaxoSmithKline, Biogen, Schering, and Novartis through grants held by the UCL Institute of Neurology. Klaus Schmierer has been supported by Biogen and Serono.
Supplementary Material
Address correspondence and reprint requests to Dr. Rachel Farrell, Department of Neuroinflammation, Institute of Neurology, UCL, Queen Square, London WC1N 3BG, UK r.farrell@ion.ucl.ac.uk
Supplemental data at www.neurology.org
Editorial, page 13
e-Pub ahead of print on May 20, 2009, at www.neurology.org.
Supported by the MS Society of Great Britain and Northern Ireland.
Medical Devices: 1.5-T GE scanner (General Electric, Milwaukee, WI); 7500 real-time PCR system (Applied Biosystems, Warrington, UK); QiaCube with QIAmp DNA blood mini kit (Qiagen, Hilden, Germany).
Disclosure: Author disclosures are provided at the end of the article.
Received July 29, 2008. Accepted in final form February 24, 2009.
REFERENCES
- 1.Hohlfeld R, Wekerle H. Autoimmune concepts of multiple sclerosis as a basis for selective immunotherapy: from pipe dreams to (therapeutic) pipelines. Proc Natl Acad Sci USA 2004;101 suppl 2:14599–14606. [DOI] [PMC free article] [PubMed] [Google Scholar]
- 2.Olerup O, Hillert J. HLA class II-associated genetic susceptibility in multiple sclerosis: a critical evaluation. Tissue Antigens 1991;38:1–15. [DOI] [PubMed] [Google Scholar]
- 3.Hafler DA, Compston A, Sawcer S, et al. Risk alleles for multiple sclerosis identified by a genomewide study. N Engl J Med 2007;357:851–862. [DOI] [PubMed] [Google Scholar]
- 4.Elian M, Dean G. Multiple sclerosis among the United Kingdom–born children of immigrants from the West Indies. J Neurol Neurosurg Psychiatry 1987;50:327–332. [DOI] [PMC free article] [PubMed] [Google Scholar]
- 5.Kurtzke JF, Heltberg A. Multiple sclerosis in the Faroe Islands: an epitome. J Clin Epidemiol 2001;54:1–22. [DOI] [PubMed] [Google Scholar]
- 6.Ascherio A, Munger KL. Environmental risk factors for multiple sclerosis: part I: the role of infection. Ann Neurol 2007;61:288–299. [DOI] [PubMed] [Google Scholar]
- 7.Thacker EL, Mirzaei F, Ascherio A. Infectious mononucleosis and risk for multiple sclerosis: a meta-analysis. Ann Neurol 2006;59:499–503. [DOI] [PubMed] [Google Scholar]
- 8.Buljevac D, van Doornum GJ, Flach HZ, et al. Epstein-Barr virus and disease activity in multiple sclerosis. J Neurol Neurosurg Psychiatry 2005;76:1377–1381. [DOI] [PMC free article] [PubMed] [Google Scholar]
- 9.Torkildsen O, Nyland H, Myrmel H, Myhr KM. Epstein-Barr virus reactivation and multiple sclerosis. Eur J Neurol 2008;15:106–108. [DOI] [PubMed] [Google Scholar]
- 10.Wandinger K, Jabs W, Siekhaus A, et al. Association between clinical disease activity and Epstein-Barr virus reactivation in MS. Neurology 2000;55:178–184. [DOI] [PubMed] [Google Scholar]
- 11.van Sechel AC, Bajramovic JJ, van Stipdonk MJ, Persoon-Deen C, Geutskens SB, van Noort JM. EBV-induced expression and HLA-DR-restricted presentation by human B cells of alpha B-crystallin, a candidate autoantigen in multiple sclerosis. J Immunol 1999;162:129–135. [PubMed] [Google Scholar]
- 12.Jilek S, Schluep M, Meylan P, et al. Strong EBV-specific CD8+ T-cell response in patients with early multiple sclerosis. Brain 2008;131:1712–1721. [DOI] [PubMed] [Google Scholar]
- 13.Bastianello S, Pozzilli C, Bernardi S, et al. Serial study of gadolinium-DTPA MRI enhancement in multiple sclerosis. Neurology 1990;40:591–595. [DOI] [PubMed] [Google Scholar]
- 14.Tortorella C, Codella M, Rocca MA, et al. Disease activity in multiple sclerosis studied by weekly triple-dose magnetic resonance imaging. J Neurol 1999;246:689–692. [DOI] [PubMed] [Google Scholar]
- 15.Miller DH, Rudge P, Johnson G, et al. Serial gadolinium enhanced magnetic resonance imaging in multiple sclerosis. Brain 1988;111:927–939. [DOI] [PubMed] [Google Scholar]
- 16.Smith ME, Stone LA, Albert PS, et al. Clinical worsening in multiple sclerosis is associated with increased frequency and area of gadopentetate dimeglumine-enhancing magnetic resonance imaging lesions. Ann Neurol 1993;33:480–489. [DOI] [PubMed] [Google Scholar]
- 17.Lublin FD, Reingold SC. Defining the clinical course of multiple sclerosis: results of an international survey: National Multiple Sclerosis Society (USA) Advisory Committee on Clinical Trials of New Agents in Multiple Sclerosis. Neurology 1996;46:907–911. [DOI] [PubMed] [Google Scholar]
- 18.Silver NC, Good CD, Barker GJ, et al. Sensitivity of contrast enhanced MRI in multiple sclerosis. Effects of gadolinium dose, magnetization transfer contrast and delayed imaging. Brain 1997;120:1149–1161. [DOI] [PubMed] [Google Scholar]
- 19.Poser CM, Paty DW, Scheinberg L, et al. New diagnostic criteria for multiple sclerosis: guidelines for research protocols. Ann Neurol 1983;13:227–231. [DOI] [PubMed] [Google Scholar]
- 20.Poser CM, Brinar VV. Diagnostic criteria for multiple sclerosis. Clin Neurol Neurosurg 2001;103:1–11. [DOI] [PubMed] [Google Scholar]
- 21.Filippi M, Rovaris M, Capra R, et al. A multi-centre longitudinal study comparing the sensitivity of monthly MRI after standard and triple dose gadolinium-DTPA for monitoring disease activity in multiple sclerosis. Implications for phase II clinical trials. Brain 1998;121:2011–2020. [DOI] [PubMed] [Google Scholar]
- 22.van Waesberghe JH, Castelijns JA, Roser W, et al. Single-dose gadolinium with magnetization transfer versus triple-dose gadolinium in the MR detection of multiple sclerosis lesions. AJNR Am J Neuroradiol 1997;18:1279–1285. [PMC free article] [PubMed] [Google Scholar]
- 23.Reiber H, Ungefehr S, Jacobi C. The intrathecal, polyspecific and oligoclonal immune response in multiple sclerosis. Mult Scler 1998;4:111–117. [DOI] [PubMed] [Google Scholar]
- 24.Sundstrom P, Juto P, Wadell G, et al. An altered immune response to Epstein-Barr virus in multiple sclerosis: a prospective study. Neurology 2004;62:2277–2282. [DOI] [PubMed] [Google Scholar]
- 25.Bray PF, Bloomer LC, Salmon VC, Bagley MH, Larsen PD. Epstein-Barr virus infection and antibody synthesis in patients with multiple sclerosis. Arch Neurol 1983;40:406–408. [DOI] [PubMed] [Google Scholar]
- 26.Crawford DH. Biology and disease associations of Epstein-Barr virus. Philos Trans R Soc Lond B Biol Sci 2001;356:461–473. [DOI] [PMC free article] [PubMed] [Google Scholar]
- 27.Hochberg D, Middeldorp JM, Catalina M, Sullivan JL, Luzuriaga K, Thorley-Lawson DA. Demonstration of the Burkitt's lymphoma Epstein-Barr virus phenotype in dividing latently infected memory cells in vivo. Proc Natl Acad Sci USA 2004;101:239–244. [DOI] [PMC free article] [PubMed] [Google Scholar]
- 28.Ascherio A, Munger KL, Lennette ET, et al. Epstein-Barr virus antibodies and risk of multiple sclerosis: a prospective study. JAMA 2001;286:3083–3088. [DOI] [PubMed] [Google Scholar]
- 29.DeLorenze GN, Munger KL, Lennette ET, Orentreich N, Vogelman JH, Ascherio A. Epstein-Barr virus and multiple sclerosis: evidence of association from a prospective study with long-term follow-up. Arch Neurol 2006;63:839–844. [DOI] [PubMed] [Google Scholar]
- 30.Lunemann JD, Jelcic I, Roberts S, et al. EBNA1-specific T cells from patients with multiple sclerosis cross react with myelin antigens and co-produce IFN-gamma and IL-2. J Exp Med 2008;205:1763–1773. [DOI] [PMC free article] [PubMed] [Google Scholar]
- 31.Andersson M, varez-Cermeno J, Bernardi G, et al. Cerebrospinal fluid in the diagnosis of multiple sclerosis: a consensus report. J Neurol Neurosurg Psychiatry 1994;57:897–902. [DOI] [PMC free article] [PubMed] [Google Scholar]
- 32.Rand KH, Houck H, Denslow ND, Heilman KM. Epstein-Barr virus nuclear antigen-1 (EBNA-1) associated oligoclonal bands in patients with multiple sclerosis. J Neurol Sci 2000;173:32–39. [DOI] [PubMed] [Google Scholar]
- 33.Bray PF, Luka J, Bray PF, Culp KW, Schlight JP. Antibodies against Epstein-Barr nuclear antigen (EBNA) in multiple sclerosis CSF, and two pentapeptide sequence identities between EBNA and myelin basic protein. Neurology 1992;42:1798–1804. [DOI] [PubMed] [Google Scholar]
- 34.Cepok S, Zhou D, Srivastava R, et al. Identification of Epstein-Barr virus proteins as putative targets of the immune response in multiple sclerosis. J Clin Invest 2005;115:1352–1360. [DOI] [PMC free article] [PubMed] [Google Scholar]
- 35.Lunemann JD, Huppke P, Roberts S, Bruck W, Gartner J, Munz C. Broadened and elevated humoral immune response to EBNA1 in pediatric multiple sclerosis. Neurology 2008;71:1033–1035. [DOI] [PMC free article] [PubMed] [Google Scholar]
- 36.Magliozzi R, Howell O, Vora A, et al. Meningeal B-cell follicles in secondary progressive multiple sclerosis associate with early onset of disease and severe cortical pathology. Brain 2007;130:1089–1104. [DOI] [PubMed] [Google Scholar]
- 37.Serafini B, Rosicarelli B, Franciotta D, et al. Dysregulated Epstein-Barr virus infection in the multiple sclerosis brain. J Exp Med 2007;204:2899–2912. [DOI] [PMC free article] [PubMed] [Google Scholar]
Associated Data
This section collects any data citations, data availability statements, or supplementary materials included in this article.