

Abstract
Background
Although most prostate cancers respond well to initial treatments, a fraction of prostate cancers are more aggressive and will recur and metastasize. At that point, there are few treatment options available. Significant efforts have been made to identify biomarkers that will identify these more aggressive cancers to tailor a more vigorous treatment in order to improve outcome. Polycomb Group protein Enhancer of Zeste 2 (EZH2) was found to be overexpressed in metastatic prostate tumors, and is considered an excellent candidate for such a biomarker. Scattered studies have found that EZH2 overexpression causes neoplastic transformation, invasion, and growth of prostate cells. However, these studies utilized different systems and cell lines, and so are difficult to correlate with one another.
Methods
In this study, a comprehensive evaluation of the phenotypic effects of EZH2 in a panel of five prostate cancer cell lines was performed. By using multiple cell lines, and examining overexpression and knockdown of EZH2 concurrently, a broad view of EZH2's role in prostate cancer was achieved.
Results
Overexpression of EZH2 led to more aggressive behaviors in all prostate cell lines tested. In contrast, downregulation of EZH2 reduced invasion and tumorigenicity of androgen-independent cell lines CWR22Rv1, PC3, and DU145, but not of androgen-dependent cell lines LAPC4 and LNCaP.
Conclusions
Findings from this study suggest androgen-independent prostate tumors are more dependent on EZH2 expression than androgen-dependent tumors. Our observations provide an explanation for the strong correlation between EZH2 overexpression and advanced stage, aggressive prostate cancers.
Keywords: EZH2, Prostate, Cancer, Growth, Aggression
Introduction
American Cancer Society projects that there will be 192,300 newly diagnosed cases of prostate cancer and over 27,000 deaths resulting from the disease in 2009, making prostate cancer the most diagnosed and second deadliest cancer for American men. One of the most frequently used treatments for prostate cancer is hormone ablation therapy. Although most prostate tumors initially respond well to hormone ablation therapy, disease often recurs in the form of Hormone Refractory Prostate Cancer (HRPC). HRPCs are more aggressive, and there are few treatment options available for these patients [1]. One of the primary difficulties in the treatment of HRPC is the heterogeneity of recurrent tumors at different metastatic sites within the same patient [2]. Furthermore, HRPC tumors from patients can give rise to androgen-dependent tumors in animal models [3], demonstrating that even with this basic characterization is not entirely accurate. Many attempts have been made to isolate a biomarker to distinguish aggressive from indolent prostate cancers. The majority of these attempts have identified markers that fit some, but not all, prostate cancers due to disease heterogeneity [4-7].
One promising marker is the Polycomb Group (PcG) protein EZH2, which is overexpressed in many aggressive, metastatic prostate cancers [8]. Furthermore, EZH2 expression status is predictive of disease progression and treatment outcome [8]. This result was confirmed by other groups on separate sample sets, lending additional credence to the finding [9-11]. The issue of heterogeneous cancers resurfaced, however, when the mechanism of EZH2 overexpression was investigated. According to one study, the EZH2 expression level was elevated in more than half of all HRPC tumors compared to 27% of early untreated prostate carcinoma cases, and the range of elevation of EZH2 RNA levels in HRPC tumors was very heterogeneous. Moreover, in the group of patients undergoing early stages of treatment, the EZH2 copy number did not correlate with either Gleason score or pT-stage [12]. Therefore, the association between EZH2 and prostate cancer aggression is likely a complex and potentially convoluted relationship.
EZH2 was first identified as a master regulator of homeobox gene expression during development (reviewed in [13]). EZH2 and its binding partners, EED [14] and Su(z)12 [15], compose Polycomb Repressive Complex 2 (PRC2), which is responsible for gene silencing [16]. PRC2 silences target genes by tri-methylating Lysine 27 of Histone 3 (H3K27) via catalytic activity provided by EZH2 [17,18]. The tri-methylation of H3K27 results in chromatin condensation [19], and eventual DNA methylation [20]. While H3K27 tri-methylation is a reversible form of gene silencing [21], DNA methylation appears to be permanent [22]. The exact mechanism by which EZH2 may cause prostate cancer aggression has not yet been fully explored, although the prevailing hypothesis is that overexpression results in aberrant silencing of cancer or cell cycle regulatory genes. However, prior to performing extensive studies on genes downstream of EZH2 in prostate cells, a clear understanding of the role of EZH2 in the available prostate cancer cell models must be achieved.
Prostate cancer models currently available as cell lines are generally classified into Androgen-Dependent (AD) or Androgen-Independent (AI) in regards to their growth requirements. LAPC4 is a relatively recently developed prostate cancer cell line that expresses wild type androgen receptor (AR), and secretes prostate-specific antigen (PSA) [3]. Although the growth of growth of LAPC4 cell line in culture and as a xenograft tumor is dependent on androgen (AD), LAPC4 was originally derived from an HRPC lymph node metastasis. The most commonly used AD prostate cancer cell line, LNCaP, was also derived from a lymph node metastasis of a HRPC patient. LNCaP cells also express PSA and AR, but their AR contains a point mutation that makes it more promiscuous than wild type AR [23]. The prostate cancer cell line CWR22Rv1 is an AI cell line that retains expression of a mutant AR and PSA [24]. The Rv1 variant was derived from the parental xenograft model CWR22, which was started from a primary prostate tumor [25]. DU145 and PC3 are two most widely studied AI prostate cell lines that were derived from a brain metastasis and a bone metastasis, respectively. Both of these cell lines are AR negative and do not express PSA, which raises concerns about their relevance to clinical prostate cancer [26-28]. However, these cell lines do express several markers that are classically used in prostate cancer diagnosis, and thus are valuable in a comprehensive prostate cancer cell line study [29].
In this study, we performed a comprehensive evaluation of EZH2 expression changes and the effect on cell behavior in a panel of prostate cancer cell lines including LAPC4, LNCaP, CWR22Rv1, DU145, and PC3. Each cell line was transduced with lentiviruses to either overexpress or knockdown EZH2, then tested for changes in proliferation, invasion, and three-dimensional colony growth. We observed that EZH2 overexpression promotes more aggressive behaviors in all prostate cancer cell lines. In the knockdown experiments, AI cell lines were more affected by a reduction in EZH2 expression levels, and AD prostate cancer cell lines appeared to be less responsive to reduction of EZH2 levels. This study highlights the complex relationship between EZH2 expression and prostate cancer aggression, which is greatly influenced by the heterogenic nature of prostate cancer.
Materials and Methods
Construct Production
Lentiviruses were constructed in the Self-Inactivating lentiviral backbones pCCL or pRRL [30]. HA-EZH2 [31] was inserted into pCCL-CMV-IRES-EGFP to create pCCL-CMV-EZH2-IRES-EGFP. The empty vector was used as the GFP control. pCCL-CMV-RLuc [32] and pRRL-U6-shLuc-pgk-egfp [33] were previously described. The shEZH2 hairpin sequence is 5′–CTGCAGAAAAAGAACTCACCGAACAGCAGCTCTCTTGAAGC TGCTGTTCGGTGAGTTCGGTGTTTCGTCCTTTCCACAA-3′. The shLuc vector was used as the short hairpin control virus.
Tissue Culture, Transductions, and Assays
Cells were cultured in media with 10% Fetal Bovine Serum (FBS) and 1% Penicillin-Streptomycin at 37°C with 5% CO2 and humidity. HEK-283T and LAPC4 were cultured in Iscove's Modification of DMEM with L-Glutamine and 25 mM HEPES, without α-Thioglycerol and β-Mercaptoethanol, and BPH1, CWR22Rv1, PC3, DU145, and LNCaP were cultured in RPMI 1640 with L-Glutamine (Mediatech, Manassas, VA).
Lentivirus was produced by triple transfections into HEK-293T using calcium phosphate transfection protocol [34].
Lentiviral transductions in tissue culture were performed at an MOI of 2 for 6 hours with 8 μg/mL Polybrene (Sigma, St. Louis, MO). On Day 4, transduced cells were assayed for lentiviral gene expression by Flow analysis on a FACScan Flow Instrument (BD Biosciences, Franklin Lakes, NJ) and seeded for additional assays.
Viable cells were measured by the formazan dye-based CCK8 assay. Briefly, cells were plated in triplicate on Day 0 at 1×10³ cells per well in 100 μL of media in a 96-well plate. On Days 1, 3, and 5, 10 μL of CCK8 assay reagent (Dojindo, Japan) was added to the wells and incubated for 2 hours. Plates were read at an absorbance of 450 nm on a Bio-Tek PowerwaveXS Plate Reader (Bio-Tek, Winooski, VT) and analyzed using KC Junior Software (Bio-Tek, Winooski, VT).
Western Blot
Samples were lysed in Whole Cell Lysis Buffer (50 mM HEPES, 150 mM NaCl, 1.5 mM MgCl2, 0.5 mM EDTA, 10% Glycerol, 1% Triton-X100, 10 mM NaF, 1 mM DTT, 1 mM PMSF, pH 7.0) by 3 freeze-thaw cycles followed by 30 minutes. Lysates were spun down at 4000×g for 5 minutes, and supernatants were collected. Total protein (25 μg per sample) was separated by electrophoresis on 4-20% Tris-HCl SDS-PAGE. Antibodies used are as follows: anti-HA-HRP (1:1000, Roche, Indianapolis, IN), anti-EZH2 (1:750; Chemicon, Billerica, MA), anti-GFP (1:1000; Invitrogen, Carlsbad, CA), anti-β-actin (1:5000; Sigma, St. Louis, MO), anti-rabbit-HRP (1:20,000; Santa Cruz Biotechnology, Santa Cruz, CA), and anti-mouse-HRP (1:20,000; Santa Cruz Biotechnology, Santa Cruz, CA). Densitometry was performed using ImageJ.
Microscopy
Cells were photographed using an Olympus BX41 fluorescent microscope (Olympus, Center Valley, PA) fitted with a Q-Imaging QICAM FAST 1394 camera (Surrey, BC Canada). Images were captured and quantified using the software QCapture Pro Version 5.1 (Media Cybernetics, Bethesda, MD) and processed using Adobe Photoshop CS (Adobe Systems, Inc., San Jose, CA).
Immunocytochemistry
Cells for Immunocytochemistry were plated at 2.5×10⁵ on growth treated, sterile glass coverslips in a 6-well plate. Cells were allowed to attach and grow for 36 hours. Coverslips were washed in Phospate Buffered Saline with 100 μM CaCl2 and 1 mM MgCl2 (PBS-CM). Cells were then fixed in 3% Paraformaldehyde (PFA) in PBS-CM for 30 minutes at room temperature, permeabilized for 5 minutes in 3% PFA-PBS-CM with 0.1% Triton-X100, and washed 3 times in PBS with 0.5% Bovine Serum Albumin (BSA). Coverslips were blocked for 20 minutes at room temperature in PBS with 3% BSA and 1% Normal Goat Serum (NGS). Antibodies were diluted in PBS with 0.1% BSA and 1% NGS. Coverslips were incubated in a humidity chamber with antibody either overnight at 4°C [35]. Coverslips were mounted on a slide using Vectashield Hardmount with DAPI (Vector Labs, Burlingame, CA). Imaged shown were captured using a 40× objective lens on the Olympus BX41 microscope.
Antibodies used were anti-Histone 3 Lysine 27 tri-methylation (1:750; Upstate, Billerica, MA) and Alexa Fluor 594 F(ab')2 fragment of goat anti-mouse IgG (1:1000; Invitrogen, Carlsbad, CA).
Matrigel Invasion Assay
The Invasion Assay protocol was adapted from a previously published protocol [36]. Briefly, 24-well plate inserts with 8 micron membrane pores (BD Falcon, Franklin Lakes, NJ) were coated evenly with 20 μL of ice cold 1:6 Matrigel:Serum-Free Media dilution (BD Biosciences, Franklin Lakes, NJ) then allowed to set for 30 minutes at 37°C. 1×10⁵ cells (5×10⁵ cells for LAPC4 and LNCaP) were plated in a volume of 500 μL of media containing 0.5% FBS. The bottom chamber was filled with 500 μL of media containing 10% FBS. Cells were allowed to invade for 48 hours.
Invaded cells were fixed in 0.5% Glutaraldehyde in 1× PBS for 20 minutes, then the Matrigel layer was removed with a cotton swab. The membrane was cut out and mounted on a slide using Vectashield Hardmount with DAPI (Vector Labs, Burlingame, CA). Each membrane was quantified by capturing 5 independent fields under a 10× lens on the Olympus BX41microscope and determining the total area covered by cells in the field using ImageJ. The five fields were combined to obtain total membrane coverage. Images shown were captured using a 4× objective lens.
Soft Agar Transformation Assay
The base support layer was 100 μL of 0.5% sterile agar in RPMI with 10%FBS. The base layer was allowed to set for 20 minutes at room temperature. 5×10³ cells per well were resuspended in 25 μL of 2× RPMI/20% FBS and mixed with 25 μL of molten 0.7% sterile agarose equalized to 40°C then plated immediately on top of the base layer. The top layer was allowed to set 10 to 20 minutes, and then the plates were placed at 37°C with 5% CO2 and humidity. Colonies grew for 14 days, then stained overnight with 0.1% INT-violet dye (Sigma, St. Louis, MO).
Plates were assayed at the UCLA Immunology Core on an Immunospot Series 1 Imager (Cellular Technologies Limited, Shaker Heights, OH). Colonies were photographed, analyzed, and counted using ImmunoSpot 4.0 Professional by CTL.
Animal Work and Optical Imaging
Animal care and procedures were performed in accordance with the University of California Animal Research Committee guidelines. Age-matched male SCID mice from Charles Rivers (Wilmington, MA) were used. Mice were implanted bilaterally with 5×10⁵ DU145 cells marked with each respective lentivirus (at an MOI of 3) and Renilla Luciferase lentivirus (at an MOI of 1).
For each imaging session, mice were anesthetized with ketamine/xylazine (4:1). In vivo luciferase expression was monitored over time using a cooled IVIS CCD camera (Xenogen, Alameda, CA). Mice were given a tail-vein injection of coelenterazine at a dose of 1 mg/kg for Renilla Luciferase Imaging. Images were analyzed with IGOR-PRO Living Image Software. Tumor volumes were calculated using the formula: V = a × 2b × π/6, where a is the largest diameter and b is the smallest diameter [37,38].
RNA Extraction and Quantitative Real-Time PCR
RNA was extracted using TRIzol Reagent (Invitrogen, Carlsbad, CA). Two μg of RNA was reverse transcribed using iScript cDNA Synthesis Kit (Biorad, Hercules, CA).
Quantitative Real-Time PCR (qRT-PCR) was performed using 1 μL cDNA (roughly 40 ng), SyBr green 2× master mix (Applied Biosystems, Foster City, CA), 10 nM Fluorescein, and 10 μM each of the following previously published primer sets: β-Actin, EZH2, EED, and HoxA9 [39].
Reactions were run on MyiQ iCycler Real-Time PCR machine (Biorad, Hercules, CA) under the following cycling conditions: 40 repeats of 95°C/15sec; 60°C/30sec; 72°C/30sec, and analyzed using BioRad iQ5 software. All samples were normalized to internal β-Actin levels by the comparative threshold cycle (Ct) method [40].
Results
EZH2 modifies phenotype of all prostate cancer cell lines upon knockdown and overexpression
The aim of this study was to use either overexpression or knockdown to modulate EZH2 expression levels in prostate cancer cell lines. Prior to beginning the study, endogenous EZH2 levels were examined in a panel of cancer cell lines and compared to EZH2 levels in a non-cancerous prostate cell line, BPH1 [41]. A range of RNA transcript levels of EZH2 and its binding partner EED was found among the prostate cancer cell lines by quantitative Real-Time PCR (qRT-PCR, Figure 1C), with CWR22Rv1 (22Rv1) expressing the most EZH2 and BPH1 expressing very low levels of EZH2. EED levels were highest in LAPC4, and lowest in PC3. Because EZH2 has been reported to degrade in the absence of bound EED [42,43], EZH2 protein levels were examined by western blot (Figure 1C). Interestingly, 22Rv1, which had the most EZH2 transcript, had low levels of EZH2 protein. This difference was attributed to relatively low levels of EED in 22Rv1 (Figure 1C). LAPC4 had high levels of EZH2 protein, which corresponds well with its high EED expression.
Figure 1. EZH2 expression, overexpression, and knockdown in prostate cancer cell lines.

A. Schematic diagrams of EZH2-overexpressing and GFP control lentiviruses. LTR: Long Terminal Repeat; cppt: central polypurine tract; CMV: human cytomegalovirus promoter; IRES: ECMV internal ribosomal entry site; EGFP; enhanced green fluorescent protein; wpre: woodchuck post-transcriptional regulatory element. B. Schematic diagrams of short hairpin lentiviral vectors specific against EZH2 and Firefly Luciferase (control). U6: U6 pol III promoter; PGK: Phosphoglycerate Kinase Promoter. C. qRT-PCR examination of endogenous levels of EZH2 and EED in a panel of prostate cell lines, and western blot examination of endogenous EZH2. 22Rv1, DU145, LAPC4, LNCaP, and PC3 are prostate cancer cell lines. BPH1 is a prostatic epithelial cell line. α-EZH2: antibody specific for endogenous and exogenous EZH2; α-Actin: antibody specific for β-Actin, used as a loading control for all western blots. D. Western Blot examination of shRNA mediated knockdown of HA-EZH2 in 293T cells.
To modulate the expression levels of EZH2, lentiviruses were used to introduce HA-tagged EZH2 (Figure 1A) or EZH2-specific short hairpin RNA (shRNA) (Figure 1B). shRNA is a RNA pol III promoter-driven RNAi-inducing tool that degrades the mRNA for the targeted genes [33]. The control viruses were either expressing GFP reporter gene alone or expressing non-specific shRNA against irrelevant luciferase gene (shLuc). The shEZH2 lentivirus was demonstrated to efficiently knock down expression of HA-tagged EZH2 in HEK-293T (Figure 1D).
Each of the cancer cell lines were infected with EZH2 overexpressing, GFP control, shEZH2, or shLuc control lentivirus. Cells were assayed by Flow cytometry for GFP expression to confirm at least 50% transduction in the population (data not shown). Because permissiveness to infection varies, the goal was to achieve above 50% transduction. Therefore, any phenotypes observed would be a reflection of the majority of cells. qRT-PCR analysis of LAPC4 (Figure 2A), LNCaP (Figure 2B), 22Rv1 (Figure 2C), PC3 (Figure 2D), and DU145 (Figure 2E) infected with each of the lentiviruses revealed successful overexpression and knockdown of EZH2 in each cell line. Protein levels of both HA-tagged EZH2 and endogenous EZH2 were also examined by western blot (Figure 2A-E). Western blots were quantified by densitometry to examine the protein levels achieved through overexpression (Figure 2F) and knockdown (Figure 2G) of EZH2. Interestingly, the amount of EZH2 overexpression achieved at the protein level was much lower than the qRT-PCR values. This was most likely due to the instability of EZH2 in the absence of bound EED. To gauge active PRC2 complexes, we analyzed the transcript levels of HoxA9, an unrelated developmental gene that is negatively regulated by EZH2 [15]. HoxA9 levels inversely correlate with EZH2 levels within each prostate tumor cell line, indicating the functional consequence of EZH2 modulation (Figure 2A-E). The changes in HoxA9 expression substantiated the inverse relationship with EZH2 function.
Figure 2. Expression levels of EZH2 after transduction with overexpression and shRNA viruses.
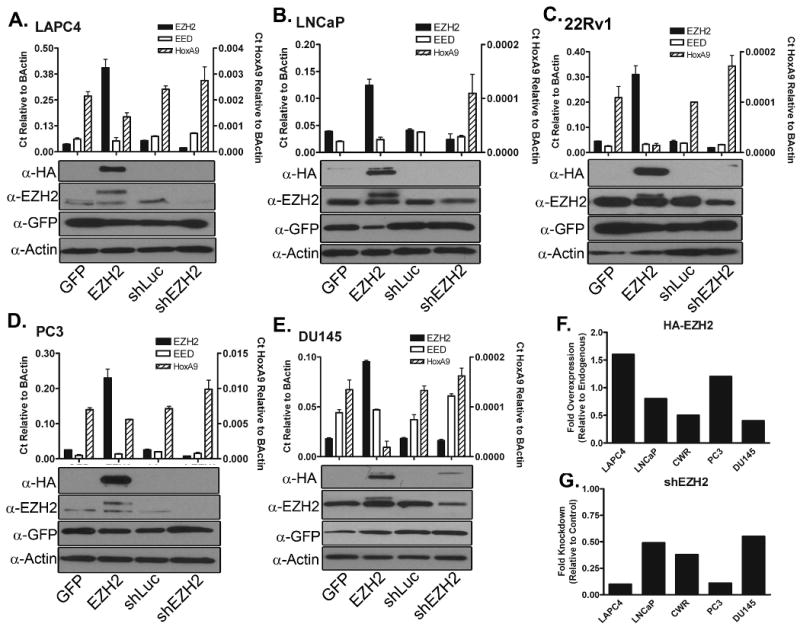
Overexpression and knockdown of EZH2 by qRT-PCR and western blot in A. LAPC4, B. LNCaP, C. 22Rv1, D. PC3, and E. DU145. For each panel, qRT-PCR results examining EZH2 and EED transcript levels are plotted on the left y-axis. qRT-PCR results examining HoxA9 expression levels in EZH2 overexpressing and knockdown cells are plotted on the right y-axis. α-HA: antibody specific for HA-tagged EZH2; α-EZH2: antibody specific for exogenous and endogenous EZH2; α-GFP: antibody specific for EGFP; and α-Actin: antibody specific for β-Actin, used as a loading control; GFP: Cells infected with the GFP Control Lentivirus; EZH2: Cells infected with the EZH2-overexpession Lentivirus; shLuc: Cells infected with a control shRNA lentivirus specific to Firefly Luciferase; shEZH2: Cells infected with shEZH2 lentivirus. Densitometry was performed on western blots to evaluate (F) the fold overexpression of HA-tagged EZH2 (relative to endogenous EZH2 levels) and (G) the fold knockdown of EZH2 by shEZH2 lentivirus. Quantification of HA-tagged EZH2 (upper band in α-EZH2 western panels) versus endogenous EZH2 (lower band in α-EZH2 panels was possible due to the slight size difference in the proteins.
To confirm functional impact of altered EZH2 levels, immunocytochemistry for tri-methylated Histone 3 at Lysine 27 (H3K27Me3) was performed (Figure 3). Transduced cells were identified within each population by EGFP expression, and compared to untransduced cells in the same field. More intense staining for H3K27Me3 in cells overexpressing EZH2 was consistently observed, confirming functionality and biochemical impact of exogenous EZH2. Furthermore, a decline in H3K27Me3 staining was seen in cells infected with the shEZH2 lentivirus, verifying EZH2 knockdown (Figure 3).
Figure 3. Immunocytochemistry confirms functionality of overexpressed EZH2 and of shEZH2.
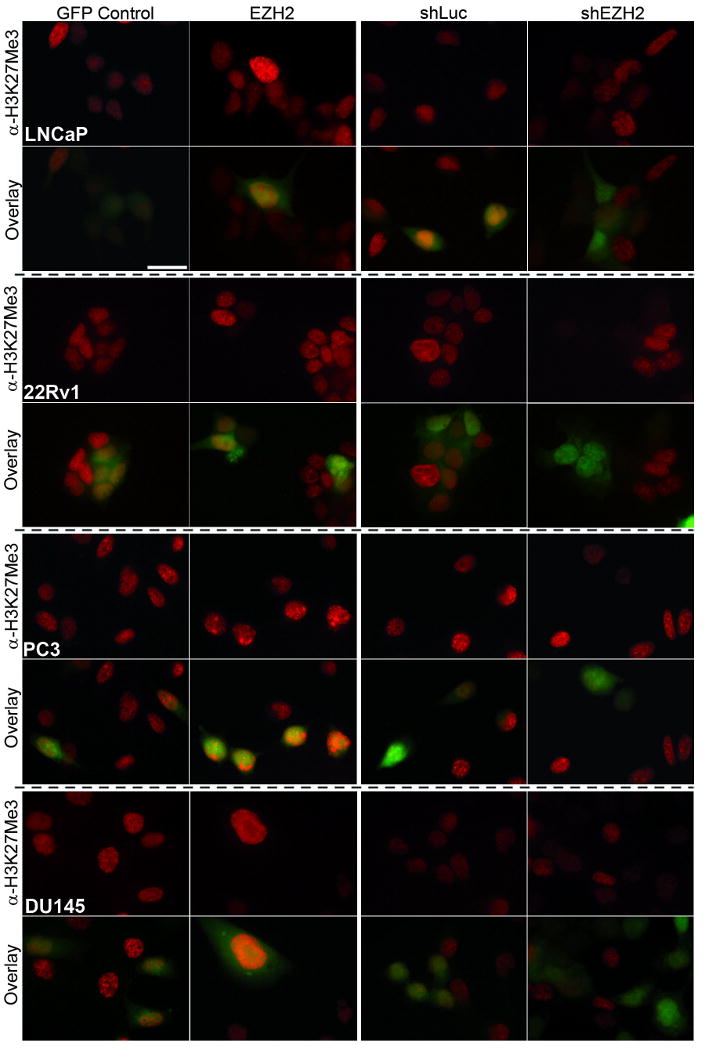
LNCaP, 22Rv1, PC3, and DU145 were grown and fixed on coverslips, then stained with an anti-Histone 3 Lysine 27 Tri-Methylation antibody (α-H3K27Me3) to detect catalytic activity of EZH2 within the cells. GFP Control: Cells infected with the GFP Control lentivirus; EZH2: Cells infected with the EZH2-overexpession lentivirus; shLuc: Cells infected with a control shRNA lentivirus; shEZH2: Cells infected with shEZH2 lentivirus. Overlay panel allows direct comparison of α-H3K27Me3 staining in transduced (GFP positive) versus non-transduced (GFP negative) cells. In all cell lines tested, cells overexpressing EZH2 have more intense staining with α-H3K27Me3, indicating more histone methylation. Cells with EZH2 knockdown lost nearly all staining with α-H3K27Me3, indicating no histone methylation at this position. Scale Bar is equal to 25 Microns. Nuclear staining intensity for H3K27Me3 was quantified and is shown in Table I.
To quantitatively assess the changes in functional EZH2-containing complex, the nuclear staining intensity for H3K27Me3 was measured for GFP positive cells in each population. All cells overexpressing EZH2 showed a quantifiable increase in their nuclear staining (Table I). Quantification of the fold change in nuclear staining in shEZH2 cells revealed a consistent decline in H3K27Me3 staining (Table I). Interestingly, the fold increase or decrease in nuclear staining did not directly correlate with either the change in EZH2 expression by qRT-PCR (Table I) or with the protein levels (Figure 2F). This indicates a potentially complex relationship between the functionality of EZH2 modulation and the biochemical state of the cells.
Table I. Quantification of Nuclear Staining Intensity following Overexpression or Knockdown of EZH2.
| Endogenous* | Expression** | Nuclear Staining** | |||||
|---|---|---|---|---|---|---|---|
| EZH2 | EED | Ratio† | EZH2 | shEZH2 | EZH2 ± SD | shEZH2 ± SD | |
| LAPC4 | 0.060 | 0.101 | 0.6 | 11.0 | 0.3 | 1.52 ± 0.35 | 0.53 ± 0.02 |
| LNCaP | 0.032 | 0.027 | 1.2 | 4.3 | 0.5 | 1.8 ± 0.04 | 0.45 ± 0.01 |
| 22Rv1 | 0.066 | 0.036 | 1.8 | 7.0 | 0.4 | 1.46 ± 0.14 | 0.31 ± 0.03 |
| PC3 | 0.038 | 0.018 | 2.1 | 9.0 | 0.3 | 1.35 ± 0.20 | 0.51 ± 0.15 |
| DU145 | 0.026 | 0.047 | 0.6 | 5.6 | 0.8 | 1.86 ± 0.04 | 0.69 ± 0.13 |
EZH2: Overexpression of EZH2, shEZH2: Knockdown of EZH2.
Relative to β-Actin;
Nuclear staining for H3K27Me3 was quantified in at least two GFP positive cells in each field, quantities shown are fold change over respective controls;
Ratio of EZH2 to EED.
EZH2 knockdown decreases cellular growth rate, while EZH2 overexpression has no appreciable effect
EZH2 has been implicated in regulation of various cell cycle proteins including cyclin A [44] and p16INK4a [45]. Furthermore, high EZH2 expression levels generally correlate with increased proliferation in tumor samples [46-48]. Consequently, the effect of altered EZH2 expression levels on the proliferation rate of each cell line was examined (Table II). For all cell types tested, no noticeable change in the growth rate was found between EZH2 overexpressing and GFP control cells. Concurrently, a significant decrease was observed in the growth rate in all cell lines transduced with shEZH2 lentivirus, albeit to varying degrees (Table II). 22Rv1 was most impacted by EZH2 knockdown. DU145 growth was also significantly reduced despite less knockdown than any other cell type (Table II). PC3, which showed the greatest knockdown of EZH2 by both qRT-PCR and nuclear staining, was least impacted in growth rate, indicating that these cells may be less dependent on EZH2 for proliferation. Because of potential toxicity in U6-mediated expression of shRNAs [49], all shEZH2-expressing populations were compared directly to shLuc control populations.
Table II. Comprehensive Summary of all assays performed.
| Expression*† | Function*§ | Proliferation* | Invasion* | Colony Number* | ||||||
|---|---|---|---|---|---|---|---|---|---|---|
| EZH2 | shEZH2 | EZH2 | shEZH2 | EZH2 | shEZH2 | EZH2 | shEZH2 | EZH2 | shEZH2 | |
| LAPC4 | 11.0 | 0.3 | 1.52 | 0.53 | 1.03 | 0.53 | 1.9 | 0.9 | 1.7 | 1.1 |
| LNCaP | 4.3 | 0.5 | 1.80 | 0.45 | 0.97 | 0.55 | 1.8 | 1.0 | 1.9 | 0.7 |
| 22Rv1 | 7.0 | 0.4 | 1.46 | 0.31 | 1.10 | 0.40 | 2.0 | 0.5 | 1.5 | 0.4 |
| PC3 | 9.0 | 0.3 | 1.35 | 0.51 | 0.99 | 0.62 | 1.4 | 0.7 | 1.7 | 0.5 |
| DU145 | 5.6 | 0.8 | 1.86 | 0.69 | 0.95 | 0.51 | 3.3 | 0.4 | 1.8 | 0.5 |
EZH2: Overexpression of EZH2, shEZH2: Knockdown of EZH2.
Fold over respective controls;
Expression as determined by qRT-PCR;
Function as determined by nuclear staining.
We also examined whether the observed decrease in cell growth resulting from EZH2 knockdown could be attributed to an increase in apoptosis. By both Annexin V/PI staining and caspase-3 activation, DU145 expressing shEZH2 showed no significant increase in apoptosis compared to the shLuc control cells (data not shown).
EZH2 overexpression and knockdown affects aggressive behavior of all prostate cancer cell lines to varying degrees
EZH2 overexpression is most often correlated with increased aggression and metastasis in prostate cancers [8,10]. These studies, however, are generally retrospective, evaluating samples immunohistochemically rather than exploring the dynamic interactions that exist within the cells. To examine the relationship between EZH2 expression levels and invasive behavior of prostate cells, Matrigel invasion assays were performed using the panel cell lines with EZH2 overexpressed and knocked down.
In this invasion assay, all cell lines displayed some invasive behavior in both GFP and shLuc controls (Figure 4). EZH2 overexpression consistently increased invasive behavior in all cell lines. EZH2 knockdown, however, decreased invasion in some, but not all, cell lines. DU145 underwent the greatest change in invasive behavior from overexpression or knockdown of EZH2 (Figure 4A, G), with a 3.3-fold increase and a 2.5-fold decrease, respectively (Table III). EZH2 overexpression resulted in a 2-fold increase and EZH2 knockdown in a 2-fold decrease in invasive behavior of 22Rv1 (Figure 4E). LNCaP, which have been reported to be non-invasive in a similar assay [50], were quite invasive here (Figure 4D). While EZH2 overexpression increased invasion in LNCaP, EZH2 knockdown failed to change invasive behavior. LAPC4 showed a similar phenotype, with a nearly 2-fold increase in invasion upon EZH2 overexpression, but virtually no change in invasion with knockdown of EZH2 (Figure 4B, C). PC3 showed the least change in invasion following overexpression of EZH2 (Figure 4F).
Figure 4. Altered expression of EZH2 impacts the invasive behavior of prostate cancer cell lines to varying degrees.
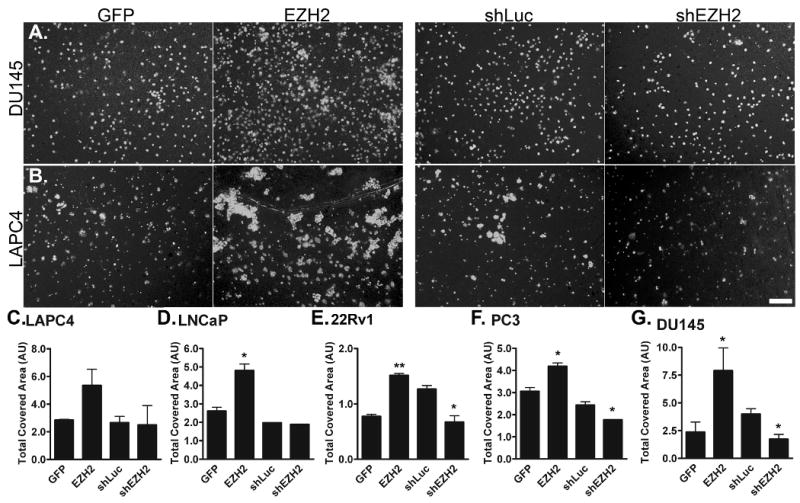
All cells were assayed at 48 hours for invasive behavior towards 10% FBS containing media. A. DU145 and B. LAPC4 are shown. Scale bar is 100 microns. For all panels, GFP: cells infected with the GFP control lentivirus; EZH2: cells infected with the EZH2-overexpession lentivirus; shLuc: Cells infected with a control shRNA lentivirus; shEZH2: cells infected with shEZH2 lentivirus. C-G. Quantification of total invasive behavior in C. LAPC4, D. LNCaP, E. 22Rv1, F. PC3, and G. DU145. p-values were determined using a two-tailed T-Test. * denotes p-value less than 0.05; ** denotes p-value less than 0.01. Quantifications are shown in Table II.
The soft agar assay roughly mimics the growth conditions conditions faced by cancer cells in vivo, including three-dimensional growth, contact inhibition, and nutrition accessibility. DU145, 22Rv1, PC3, and LACP4 expanded into visible colonies in this assay (Figure 5). EZH2 overexpression in 22Rv1 increased both the size and number of colonies, while EZH2 knockdown resulted in significantly fewer and smaller colonies (Figure 5A, E). Similar yet less dramatic results were seen in DU145 (Figure 5G) and PC3 (Figure 5F). While LNCaP grew colonies, they were not as large or as visible as the other cell lines tested (Figure 5D and data not shown). In LAPC4, EZH2 overexpression significantly increased the number and size of colonies (Figure 5B, C). Based on the dramatic growth reduction of cells with EZH2 knocked down, we were expecting a comparable reduction in colony growth. However, the results in LAPC4 refuted this possibility. In fact, colonies from shEZH2-transduced LAPC4 cells were slightly larger than their shLuc counterparts (Figure 5C) and they grew colonies as efficiently as well (Table II). This result clearly demonstrates that three-dimensional, contact-inhibited growth rate is independent of growth rate as measured in two dimensional tissue culture.
Figure 5. EZH2-modulation alters colony growth of some, but not all prostate cancer cell lines.
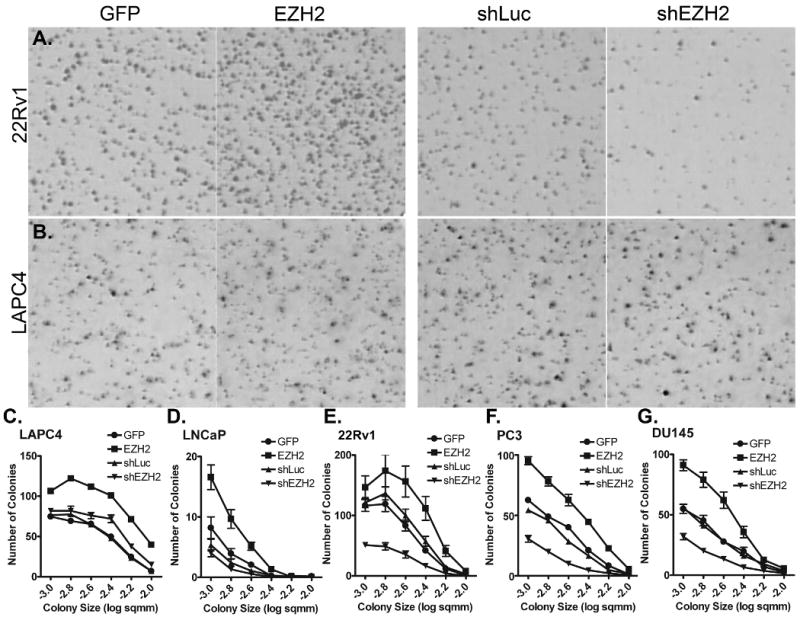
All cells were assayed at 14 days for ability to grow three-dimensional colonies in the presence of contact inhibition. Colonies were stained with 0.1% INT-Violet overnight prior to imaging. A. 22Rv1 and B. LAPC4 colonies are shown. For all panels, GFP: cells infected with the GFP control lentivirus; EZH2: cells infected with the EZH2-overexpession lentivirus; shLuc: Cells infected with a control shRNA lentivirus; shEZH2: cells infected with shEZH2 lentivirus. Quantification of colony growth in C. LAPC4, D. LNCaP, E. 22Rv1, F. PC3, and G. DU145. Colony growth is represented as number of colonies versus colony size. Quantifications are shown in Table II.
The phenotypic impacts on the five prostate cancer cell lines with EZH2 overexpression and knockdown were compiled into Table II. DU145 was the most-affected cell line across all assays performed for both overexpression and knockdown of EZH2. Interestingly, DU145 had the lowest endogenous levels of EZH2 and the most excess EED by qRT-PCR. EZH2 overexpressing DU145 cells also showed the greatest increase in EZH2 functionality by nuclear staining for H3K27Me3 (1.86 fold over control, Table I). Therefore, DU145 was perhaps biochemically poised to take advantage of overexpression of EZH2. Furthermore, low levels of endogenous EZH2 may have made DU145 more susceptible to phenotypes resulting from EZH2 knockdown.
The impact of EZH2 modulation on DU145 tumor growth in vivo
Because of the widespread EZH2-mediated effects seen in DU145, this cell line was carried into a short-term mouse xenograft model with the goal of relating tissue culture to primary tumor growth in vivo. SCID mice were implanted bilaterally with DU145 cells marked with Renilla Luciferase (RLuc) lentivirus (MOI=1) to facilitate optical imaging using a cooled CCD camera [51]. Cells were also marked with GFP control, EZH2 overexpression, shLuc, or shEZH2 lentivirus. Prior to implantation, cells were assayed for GFP expression by Flow analysis to confirm transduction efficiency. Mice were imaged for RLuc activity immediately following implantation (Day 0), followed by weekly imaging to monitor tumor growth (Figure 6A). Tumors were also monitored by caliper measurements (Figure 6B). By both optical imaging and tumor volume measurements, a significant growth advantage was seen in the EZH2 group relative to the GFP control group, indicating that EZH2 overexpression was advantageous to tumor growth (Figure 6A, B). In addition, a significant delay in tumor growth was observed in the shEZH2 group compared to the shLuc control group, demonstrating the importance of EZH2 for tumor growth in vivo. However, a small portion of the shEZH2 tumors did finally grow. These tumors were assessed for GFP expression by Flow analysis upon removal, and found to be composed of almost entirely GFP negative cells. The average for 3 tumors assessed was 14% GFP positive, compared to 95% GFP positive cells at implantation (data not shown). This seemed to indicate that an outgrowth of the unmarked minority population was responsible for the tumor growth. To confirm this outgrowth phenomenon, DU145 marked with shEZH2 and shLuc were cultured continuously and assessed for GFP positivity (Figure 6C, D) and EZH2 levels (Figure 6D) over a time course of 28 days. By both Flow analysis (Figure 6C) and western blot (Figure 6D) for GFP, a loss of shEZH2-transduced cells was confirmed, and corresponded to a recovery of EZH2 expression (Figure 6D). Taken together, the loss of GFP expressing cells in the shEZH2 tumors, and the loss of GFP and subsequent gain in EZH2 expression in the shEZH2 cultured cells suggest an outgrowth of untransduced DU145 cells.
Figure 6. EZH2 overexpression and knockdown phenotypes extend to in vivo tumor growth.
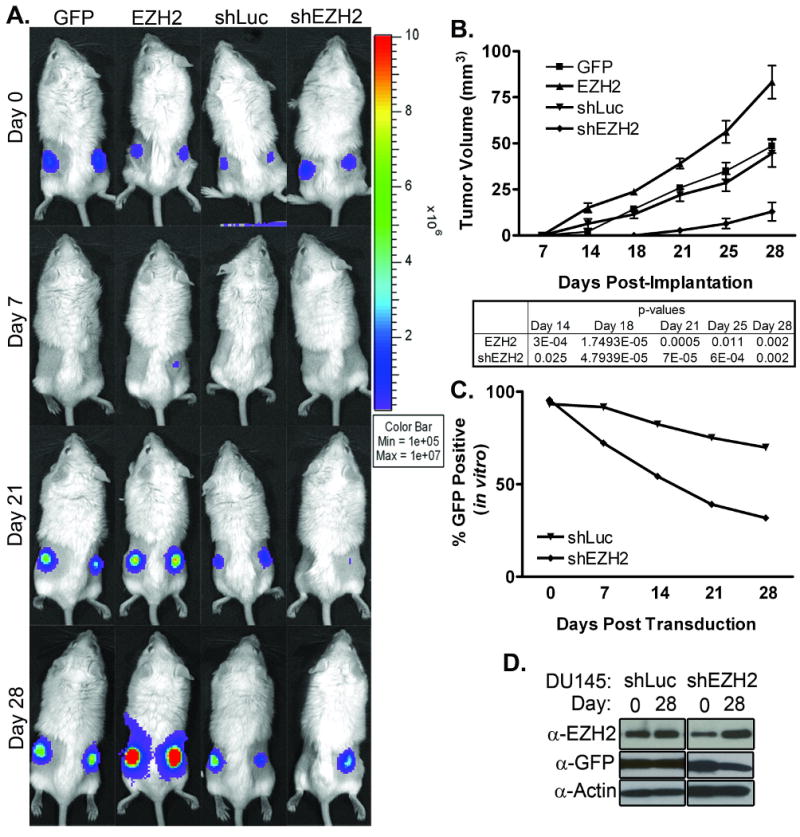
A. SCID mice implanted bilaterally with DU145 cells were imaged for optical signal over the course of tumor growth. Representative mouse from each group is shown. B. Physical tumor volumes based on measurements of largest and smallest diameters. Average of each group is shown. n=10. P-values calculated using two-tailed T-Test. C. In vitro cultured shEZH2- and shLuc-transduced DU145 cells were monitored periodically for GFP expression by Flow analysis to assess changes in the populations. D. In vitro cultured shEZH2- and shLuc-transduced DU145 cells were assayed by western blot for EZH2 and GFP expression over time. Time points shown are Day 0 and Day 28 post transduction. α-EZH2: antibody specific for exogenous and endogenous EZH2; α-GFP: antibody specific for EGFP; and α-Actin: antibody specific for β-Actin, used as a loading control. For all panels, GFP: Cells infected with GFP Control lentivirus; EZH2: Cells infected with EZH2-overexpession lentivirus; shLuc: Cells infected with control shRNA lentivirus; shEZH2: Cells infected with shEZH2 lentivirus.
Discussion
In this study, we evaluated the effects of EZH2 overexpression and knockdown in a panel of commonly used prostate cancer cell lines. In the EZH2 knockdown studies, a relatively straightforward relationship between knockdown at the RNA level and a comparable knockdown at the functional level was observed in all cell lines. EZH2 knockdown suppressed the aggressive behaviors of hormone refractory prostate cancer cell lines, most significantly in DU145 cells, followed by CWR22Rv1 cells and then PC3 cells. However, in the androgen-dependent prostate cancer models tested, LAPC4 and LNCaP cells, down-regulation of EZH2 failed to diminish their aggressive phenotypes in the soft agar and the invasion assays. Instead, LAPC4 grew larger and more numerous colonies in the soft agar assay than the control. Furthermore, LNCaP transduced with shEZH2 virus were as invasive as control cells. Taken together, the results from the EZH2 knockdown data stratify the prostate cell lines tested into groups of dependent (DU145, 22Rv1, and PC3) or not dependent (LNCaP and LAPC4) on endogenous EZH2.
It is interesting to speculate the molecular pathways that can modulate EZH2 response. The PC3 cell line, although classified as dependent on EZH2 above, it is minimally affected by EZH2 knockdown (Table II). Interestingly, PC3 and LNCaP, two weakly or not EZH2 dependent lines, are either mutated or deleted for the PTEN gene [52]. PTEN negatively regulates Akt activation, and activated Akt phosphorylates and inactivates EZH2 [53]. Therefore, these cells may customarily have mostly inactivated EZH2, and are less dependent on that mechanism for growth. On the other hand, although efficient knockdown of EZH2 was achieved in both LAPC4 and LNCaP cell lines, they were neglibily affected by these changes. Both LAPC4 and LNCaP cell lines express a high level of AR, and they are dependent on AR signaling for growth [3,23]. Perhaps the dependence on AR signaling decreases the dependence of these cell types on EZH2 function. Studies are currently underway to explore this possibility. This result lends support to the theory that EZH2 overexpression is tied to more aggressive and androgen-independent prostate cancer.
Findings from this study reveal that the consequences of overexpressing EZH2 varied greatly among the different cell lines. Furthermore, the amount of overexpression assayed by qRT-PCR and western blot was not necessarily indicative of the functionality of the overexpressed EZH2. For example, although EZH2 overexpression by RNA level was highest in LAPC4, overexpression by protein level was highest in LNCaP, and enzymatic function resulting from overexpression was highest in DU145. Hence, we employed the biochemical activity of EZH2, namely the changes in H3K27Me3 staining, to more accurately correlate with the phenotypic impact. Interestingly, in every prostate tumor cell model tested, augmenting the functional activities of EZH2 resulted in an increase in aggressive behaviors, such as heightened three dimensional proliferation, increased invasion, and tumorigenicity (Table II). Current clinical evidence clearly supports the notion that heightened EZH2 expression correlates with more aggressive cancer behaviors, including prostate and breast cancer (45-47). However, the great difficulty is in knowing how to compare functional levels of EZH2 across different prostate tumor models and, more importantly, across different clinical tumor samples to set a reference point that distinguishes benign and aggressive disease. Clearly, existing cellular conditions influence the amount of exogenous EZH2 that assembles into functional complexes. Furthermore, although EED levels are critical to EZH2 function, assaying for EED alone was not adequate to justify the differences observed between overexpressed EZH2 and function.
Our experiments in cell lines showed that DU145 exhibited the most dramatic enhancement in invasion and three-dimensional growth with EZH2 overexpression. DU145 was shown to have excess EED, which may enable the excess introduced EZH2 protein to assemble into a stable complex with EED, thus accounting for the 1.86-fold increase in EZH2 enzymatic activity upon EZH2 overexpression, the highest amongst all the cell lines tested. On the other hand, PC3 demonstrated the least overall effect from overexpression of EZH2. Unlike DU145, these cells had a meager supply of EED. Correspondingly, minimal phenotypic changes were observed in PC3 in both the invasion and soft agar assays. LNCaP and 22Rv1 cell expressed an intermediate level of EED, which might account for the intermediate impact on their aggressive behaviors upon overexpression of EZH2.
Conclusions
Taken together, the results from the EZH2 overexpression experiments reconfirm the complexity of the situation facing the use of EZH2 as a biomarker. Although EZH2 function correlates well with aggressive behavior in each cell line tested, it is difficult to predict or to rank the aggressive behavior of different prostate tumor models based on their different functional level of EZH2. Simply assaying for EZH2's primary binding partner EED is also insufficient as many clinical studies revealed no difference in EED expression level between benign and aggressive disease [8].
By performing a comprehensive evaluation of the effects of EZH2 overexpression and knockdown on the tumorigenic phenotypes of a panel of prostate cancer cell lines, we are able to appreciate some aspects of the heterogeneity seen in clinical prostate cancer. Although some cell lines appear to be more dependent on EZH2 for maintenance of their neoplastic properties, other cell lines were unaltered by EZH2 changes. These results clearly indicate that the heterogeneity of prostate cancer extends to and includes the dependence on EZH2. While there is great potential for EZH2 and its binding partners to be used collectively as a biomarker for identifying the more aggressive cases of prostate cancer, we believe that the disease is far too complex to rely on only one potential aggression factor. In combination with other markers, however, EZH2 is likely to contribute significantly to the diagnosis and treatment of aggressive prostate cancers.
Acknowledgments
BDWK is supported by UCLA SPORE in Prostate Cancer Career Development Award (P50 CA092131).
This project was supported by DOD Exploratory grant CDMRP W81XWH-04-0138.
We would like to thank Drs. Maarten van Lohuizen and Thomas Jenuwein for supplying the initial HA-tagged EZH2 construct.
Flow Cytometry was performed in the UCLA Jonsson Comprehensive Cancer Center and Center for AIDS Research Flow Cytometry Core Facility that is supported by the National Institutes of Health Awards CA-16042 and AI-28697, by the Jonsson Cancer Center, the UCLA AIDS Institute, and the UCLA School of Medicine.
BioSpot was performed in the UCLA Immuno/BioSpot Core Facility that is supported by the UCLA Center for AIDS Research (CFAR) NIH/NIAID AI028697 and the David Geffen School of Medicine at UCLA.
References
- 1.Abate-Shen C, Shen MM. Molecular genetics of prostate cancer. Genes Dev. 2000;14:2410–2434. doi: 10.1101/gad.819500. [DOI] [PubMed] [Google Scholar]
- 2.Shah RB, Mehra R, Chinnaiyan AM, Shen R, Ghosh D, Zhou M, Macvicar GR, Varambally S, Harwood J, Bismar TA, Kim R, Rubin MA, Pienta KJ. Androgen-independent prostate cancer is a heterogeneous group of diseases: lessons from a rapid autopsy program. Cancer Res. 2004;64:9209–9216. doi: 10.1158/0008-5472.CAN-04-2442. [DOI] [PubMed] [Google Scholar]
- 3.Klein KA, Reiter RE, Redula J, Moradi H, Zhu XL, Brothman AR, Lamb DJ, Marcelli M, Belldegrun A, Witte ON, Sawyers CL. Progression of metastatic human prostate cancer to androgen independence in immunodeficient SCID mice. Nat Med. 1997;3:402–408. doi: 10.1038/nm0497-402. [DOI] [PubMed] [Google Scholar]
- 4.Edelman EJ, Guinney J, Chi JT, Febbo PG, Mukherjee S. Modeling Cancer Progression via Pathway Dependencies. PLoS Comput Biol. 2008;4:e28. doi: 10.1371/journal.pcbi.0040028. [DOI] [PMC free article] [PubMed] [Google Scholar]
- 5.Lapointe J, Malhotra S, Higgins JP, Bair E, Thompson M, Salari K, Giacomini CP, Ferrari M, Montgomery K, Tibshirani R, van de Rijn M, Brooks JD, Pollack JR. hCAP-D3 expression marks a prostate cancer subtype with favorable clinical behavior and androgen signaling signature. Am J Surg Pathol. 2008;32:205–209. doi: 10.1097/PAS.0b013e318124a865. [DOI] [PubMed] [Google Scholar]
- 6.Saha B, Arase A, Imam SS, Tsao-Wei D, Naritoku WY, Groshen S, Jones LW, Imam SA. Overexpression of E-cadherin and beta-catenin proteins in metastatic prostate cancer cells in bone. Prostate. 2008;68:78–84. doi: 10.1002/pros.20670. [DOI] [PubMed] [Google Scholar]
- 7.Schlomm T, Kirstein P, Iwers L, Daniel B, Steuber T, Walz J, Chun FH, Haese A, Kollermann J, Graefen M, Huland H, Sauter G, Simon R, Erbersdobler A. Clinical significance of epidermal growth factor receptor protein overexpression and gene copy number gains in prostate cancer. Clin Cancer Res. 2007;13:6579–6584. doi: 10.1158/1078-0432.CCR-07-1257. [DOI] [PubMed] [Google Scholar]
- 8.Varambally S, Dhanasekaran SM, Zhou M, Barrette TR, Kumar-Sinha C, Sanda MG, Ghosh D, Pienta KJ, Sewalt RG, Otte AP, Rubin MA, Chinnaiyan AM. The polycomb group protein EZH2 is involved in progression of prostate cancer. Nature. 2002;419:624–629. doi: 10.1038/nature01075. [DOI] [PubMed] [Google Scholar]
- 9.Laitinen S, Martikainen PM, Tolonen T, Isola J, Tammela TL, Visakorpi T. EZH2, Ki-67 and MCM7 are prognostic markers in prostatectomy treated patients. Int J Cancer. 2008;122:595–602. doi: 10.1002/ijc.23145. [DOI] [PubMed] [Google Scholar]
- 10.Rhodes DR, Sanda MG, Otte AP, Chinnaiyan AM, Rubin MA. Multiplex biomarker approach for determining risk of prostate-specific antigen-defined recurrence of prostate cancer. J Natl Cancer Inst. 2003;95:661–668. doi: 10.1093/jnci/95.9.661. [DOI] [PubMed] [Google Scholar]
- 11.Yu J, Yu J, Rhodes DR, Tomlins SA, Cao X, Chen G, Mehra R, Wang X, Ghosh D, Shah RB, Varambally S, Pienta KJ, Chinnaiyan AM. A polycomb repression signature in metastatic prostate cancer predicts cancer outcome. Cancer Res. 2007;67:10657–10663. doi: 10.1158/0008-5472.CAN-07-2498. [DOI] [PubMed] [Google Scholar]
- 12.Saramaki OR, Tammela TL, Martikainen PM, Vessella RL, Visakorpi T. The gene for polycomb group protein enhancer of zeste homolog 2 (EZH2) is amplified in late-stage prostate cancer. Genes Chromosomes Cancer. 2006;45:639–645. doi: 10.1002/gcc.20327. [DOI] [PubMed] [Google Scholar]
- 13.Brock HW, van Lohuizen M. The Polycomb group--no longer an exclusive club? Curr Opin Genet Dev. 2001;11:175–181. doi: 10.1016/s0959-437x(00)00176-3. [DOI] [PubMed] [Google Scholar]
- 14.Sewalt RG, van der Vlag J, Gunster MJ, Hamer KM, den Blaauwen JL, Satijn DP, Hendrix T, van Driel R, Otte AP. Characterization of interactions between the mammalian polycomb-group proteins Enx1/EZH2 and EED suggests the existence of different mammalian polycomb-group protein complexes. Mol Cell Biol. 1998;18:3586–3595. doi: 10.1128/mcb.18.6.3586. [DOI] [PMC free article] [PubMed] [Google Scholar]
- 15.Cao R, Zhang Y. SUZ12 is required for both the histone methyltransferase activity and the silencing function of the EED-EZH2 complex. Mol Cell. 2004;15:57–67. doi: 10.1016/j.molcel.2004.06.020. [DOI] [PubMed] [Google Scholar]
- 16.Bunker CA, Kingston RE. Transcriptional repression by Drosophila and mammalian Polycomb group proteins in transfected mammalian cells. Mol Cell Biol. 1994;14:1721–1732. doi: 10.1128/mcb.14.3.1721. [DOI] [PMC free article] [PubMed] [Google Scholar]
- 17.Cao R, Wang L, Wang H, Xia L, Erdjument-Bromage H, Tempst P, Jones RS, Zhang Y. Role of histone H3 lysine 27 methylation in Polycomb-group silencing. Science. 2002;298:1039–1043. doi: 10.1126/science.1076997. [DOI] [PubMed] [Google Scholar]
- 18.Kirmizis A, Bartley SM, Kuzmichev A, Margueron R, Reinberg D, Green R, Farnham PJ. Silencing of human polycomb target genes is associated with methylation of histone H3 Lys 27. Genes Dev. 2004;18:1592–1605. doi: 10.1101/gad.1200204. [DOI] [PMC free article] [PubMed] [Google Scholar]
- 19.Rea S, Eisenhaber F, O'Carroll D, Strahl BD, Sun ZW, Schmid M, Opravil S, Mechtler K, Ponting CP, Allis CD, Jenuwein T. Regulation of chromatin structure by site-specific histone H3 methyltransferases. Nature. 2000;406:593–599. doi: 10.1038/35020506. [DOI] [PubMed] [Google Scholar]
- 20.Vire E, Brenner C, Deplus R, Blanchon L, Fraga M, Didelot C, Morey L, Van Eynde A, Bernard D, Vanderwinden JM, Bollen M, Esteller M, Di Croce L, de Launoit Y, Fuks F. The Polycomb group protein EZH2 directly controls DNA methylation. Nature. 2006;439:871–874. doi: 10.1038/nature04431. [DOI] [PubMed] [Google Scholar]
- 21.Whetstine JR, Nottke A, Lan F, Huarte M, Smolikov S, Chen Z, Spooner E, Li E, Zhang G, Colaiacovo M, Shi Y. Reversal of histone lysine trimethylation by the JMJD2 family of histone demethylases. Cell. 2006;125:467–481. doi: 10.1016/j.cell.2006.03.028. [DOI] [PubMed] [Google Scholar]
- 22.McGarvey KM, Greene E, Fahrner JA, Jenuwein T, Baylin SB. DNA methylation and complete transcriptional silencing of cancer genes persist after depletion of EZH2. Cancer Res. 2007;67:5097–5102. doi: 10.1158/0008-5472.CAN-06-2029. [DOI] [PubMed] [Google Scholar]
- 23.Horoszewicz JS, Leong SS, Kawinski E, Karr JP, Rosenthal H, Chu TM, Mirand EA, Murphy GP. LNCaP model of human prostatic carcinoma. Cancer Res. 1983;43:1809–1818. [PubMed] [Google Scholar]
- 24.Sramkoski RM, Pretlow TG, 2nd, Giaconia JM, Pretlow TP, Schwartz S, Sy MS, Marengo SR, Rhim JS, Zhang D, Jacobberger JW. A new human prostate carcinoma cell line, 22Rv1. In Vitro Cell Dev Biol Anim. 1999;35:403–409. doi: 10.1007/s11626-999-0115-4. [DOI] [PubMed] [Google Scholar]
- 25.Wainstein MA, He F, Robinson D, Kung HJ, Schwartz S, Giaconia JM, Edgehouse NL, Pretlow TP, Bodner DR, Kursh ED, et al. CWR22: androgen-dependent xenograft model derived from a primary human prostatic carcinoma. Cancer Res. 1994;54:6049–6052. [PubMed] [Google Scholar]
- 26.Kaighn ME, Lechner JF, Narayan KS, Jones LW. Prostate carcinoma: tissue culture cell lines. Natl Cancer Inst Monogr. 1978:17–21. [PubMed] [Google Scholar]
- 27.Kaighn ME, Narayan KS, Ohnuki Y, Lechner JF, Jones LW. Establishment and characterization of a human prostatic carcinoma cell line (PC-3) Invest Urol. 1979;17:16–23. [PubMed] [Google Scholar]
- 28.Stone KR, Mickey DD, Wunderli H, Mickey GH, Paulson DF. Isolation of a human prostate carcinoma cell line (DU 145) Int J Cancer. 1978;21:274–281. doi: 10.1002/ijc.2910210305. [DOI] [PubMed] [Google Scholar]
- 29.Mitchell S, Abel P, Ware M, Stamp G, Lalani E. Phenotypic and genotypic characterization of commonly used human prostatic cell lines. BJU Int. 2000;85:932–944. doi: 10.1046/j.1464-410x.2000.00606.x. [DOI] [PubMed] [Google Scholar]
- 30.Dull T, Zufferey R, Kelly M, Mandel RJ, Nguyen M, Trono D, Naldini L. A third-generation lentivirus vector with a conditional packaging system. J Virol. 1998;72:8463–8471. doi: 10.1128/jvi.72.11.8463-8471.1998. [DOI] [PMC free article] [PubMed] [Google Scholar]
- 31.Laible G, Wolf A, Dorn R, Reuter G, Nislow C, Lebersorger A, Popkin D, Pillus L, Jenuwein T. Mammalian homologues of the Polycomb-group gene Enhancer of zeste mediate gene silencing in Drosophila heterochromatin and at S. cerevisiae telomeres. Embo J. 1997;16:3219–3232. doi: 10.1093/emboj/16.11.3219. [DOI] [PMC free article] [PubMed] [Google Scholar]
- 32.Burton JB, Priceman SJ, Sung JL, Brakenhielm E, An DS, Pytowski B, Alitalo K, Wu L. Suppression of prostate cancer nodal and systemic metastasis by blockade of the lymphangiogenic axis. Cancer Res. 2008;68:7828–7837. doi: 10.1158/0008-5472.CAN-08-1488. [DOI] [PMC free article] [PubMed] [Google Scholar]
- 33.An DS, Xie Y, Mao SH, Morizono K, Kung SK, Chen IS. Efficient lentiviral vectors for short hairpin RNA delivery into human cells. Hum Gene Ther. 2003;14:1207–1212. doi: 10.1089/104303403322168037. [DOI] [PubMed] [Google Scholar]
- 34.Soneoka Y, Cannon PM, Ramsdale EE, Griffiths JC, Romano G, Kingsman SM, Kingsman AJ. A transient three-plasmid expression system for the production of high titer retroviral vectors. Nucleic Acids Res. 1995;23:628–633. doi: 10.1093/nar/23.4.628. [DOI] [PMC free article] [PubMed] [Google Scholar]
- 35.Aschenbrenner L, Lee T, Hasson T. Myo6 facilitates the translocation of endocytic vesicles from cell peripheries. Mol Biol Cell. 2003;14:2728–2743. doi: 10.1091/mbc.E02-11-0767. [DOI] [PMC free article] [PubMed] [Google Scholar]
- 36.Lochter A, Srebrow A, Sympson CJ, Terracio N, Werb Z, Bissell MJ. Misregulation of stromelysin-1 expression in mouse mammary tumor cells accompanies acquisition of stromelysin-1-dependent invasive properties. J Biol Chem. 1997;272:5007–5015. doi: 10.1074/jbc.272.8.5007. [DOI] [PubMed] [Google Scholar]
- 37.Sorensen AG, Patel S, Harmath C, Bridges S, Synnott J, Sievers A, Yoon YH, Lee EJ, Yang MC, Lewis RF, Harris GJ, Lev M, Schaefer PW, Buchbinder BR, Barest G, Yamada K, Ponzo J, Kwon HY, Gemmete J, Farkas J, Tievsky AL, Ziegler RB, Salhus MR, Weisskoff R. Comparison of diameter and perimeter methods for tumor volume calculation. J Clin Oncol. 2001;19:551–557. doi: 10.1200/JCO.2001.19.2.551. [DOI] [PubMed] [Google Scholar]
- 38.Tomayko MM, Reynolds CP. Determination of subcutaneous tumor size in athymic (nude) mice. Cancer Chemother Pharmacol. 1989;24:148–154. doi: 10.1007/BF00300234. [DOI] [PubMed] [Google Scholar]
- 39.Karanikolas BD, Figueiredo ML, Wu L. Polycomb group protein enhancer of zeste 2 is an oncogene that promotes the neoplastic transformation of a benign prostatic epithelial cell line. Mol Cancer Res. 2009;7:1456–1465. doi: 10.1158/1541-7786.MCR-09-0121. [DOI] [PMC free article] [PubMed] [Google Scholar]
- 40.Winer J, Jung CK, Shackel I, Williams PM. Development and validation of real-time quantitative reverse transcriptase-polymerase chain reaction for monitoring gene expression in cardiac myocytes in vitro. Anal Biochem. 1999;270:41–49. doi: 10.1006/abio.1999.4085. [DOI] [PubMed] [Google Scholar]
- 41.Hayward SW, Dahiya R, Cunha GR, Bartek J, Deshpande N, Narayan P. Establishment and characterization of an immortalized but non-transformed human prostate epithelial cell line: BPH-1. In Vitro Cell Dev Biol Anim. 1995;31:14–24. doi: 10.1007/BF02631333. [DOI] [PubMed] [Google Scholar]
- 42.Montgomery ND, Yee D, Chen A, Kalantry S, Chamberlain SJ, Otte AP, Magnuson T. The murine polycomb group protein Eed is required for global histone H3 lysine-27 methylation. Curr Biol. 2005;15:942–947. doi: 10.1016/j.cub.2005.04.051. [DOI] [PubMed] [Google Scholar]
- 43.Pasini D, Bracken AP, Jensen MR, Lazzerini Denchi E, Helin K. Suz12 is essential for mouse development and for EZH2 histone methyltransferase activity. Embo J. 2004;23:4061–4071. doi: 10.1038/sj.emboj.7600402. [DOI] [PMC free article] [PubMed] [Google Scholar]
- 44.Tonini T, Bagella L, D'Andrilli G, Claudio PP, Giordano A. Ezh2 reduces the ability of HDAC1-dependent pRb2/p130 transcriptional repression of cyclin A. Oncogene. 2004;23:4930–4937. doi: 10.1038/sj.onc.1207608. [DOI] [PubMed] [Google Scholar]
- 45.Kotake Y, Cao R, Viatour P, Sage J, Zhang Y, Xiong Y. pRB family proteins are required for H3K27 trimethylation and Polycomb repression complexes binding to and silencing p16INK4alpha tumor suppressor gene. Genes Dev. 2007;21:49–54. doi: 10.1101/gad.1499407. [DOI] [PMC free article] [PubMed] [Google Scholar]
- 46.Bachmann IM, Halvorsen OJ, Collett K, Stefansson IM, Straume O, Haukaas SA, Salvesen HB, Otte AP, Akslen LA. EZH2 expression is associated with high proliferation rate and aggressive tumor subgroups in cutaneous melanoma and cancers of the endometrium, prostate, and breast. J Clin Oncol. 2006;24:268–273. doi: 10.1200/JCO.2005.01.5180. [DOI] [PubMed] [Google Scholar]
- 47.Collett K, Eide GE, Arnes J, Stefansson IM, Eide J, Braaten A, Aas T, Otte AP, Akslen LA. Expression of enhancer of zeste homologue 2 is significantly associated with increased tumor cell proliferation and is a marker of aggressive breast cancer. Clin Cancer Res. 2006;12:1168–1174. doi: 10.1158/1078-0432.CCR-05-1533. [DOI] [PubMed] [Google Scholar]
- 48.Raaphorst FM, Meijer CJ, Fieret E, Blokzijl T, Mommers E, Buerger H, Packeisen J, Sewalt RA, Otte AP, van Diest PJ. Poorly differentiated breast carcinoma is associated with increased expression of the human polycomb group EZH2 gene. Neoplasia. 2003;5:481–488. doi: 10.1016/s1476-5586(03)80032-5. [DOI] [PMC free article] [PubMed] [Google Scholar]
- 49.An DS, Qin FX, Auyeung VC, Mao SH, Kung SK, Baltimore D, Chen IS. Optimization and functional effects of stable short hairpin RNA expression in primary human lymphocytes via lentiviral vectors. Mol Ther. 2006;14:494–504. doi: 10.1016/j.ymthe.2006.05.015. [DOI] [PMC free article] [PubMed] [Google Scholar]
- 50.Bryant RJ, Cross NA, Eaton CL, Hamdy FC, Cunliffe VT. EZH2 promotes proliferation and invasiveness of prostate cancer cells. Prostate. 2007;67:547–556. doi: 10.1002/pros.20550. [DOI] [PubMed] [Google Scholar]
- 51.Bhaumik S, Gambhir SS. Optical imaging of Renilla luciferase reporter gene expression in living mice. Proc Natl Acad Sci U S A. 2002;99:377–382. doi: 10.1073/pnas.012611099. [DOI] [PMC free article] [PubMed] [Google Scholar]
- 52.Majumder PK, Sellers WR. Akt-regulated pathways in prostate cancer. Oncogene. 2005;24:7465–7474. doi: 10.1038/sj.onc.1209096. [DOI] [PubMed] [Google Scholar]
- 53.Cha TL, Zhou BP, Xia W, Wu Y, Yang CC, Chen CT, Ping B, Otte AP, Hung MC. Akt-mediated phosphorylation of EZH2 suppresses methylation of lysine 27 in histone H3. Science. 2005;310:306–310. doi: 10.1126/science.1118947. [DOI] [PubMed] [Google Scholar]