Abstract
Purpose: A large number of false positives (FPs) generated by computer-aided detection (CAD) schemes is likely to distract radiologists’ attention and decrease their interpretation efficiency. This study aims to develop projection-based features which characterize true and false positives to increase the specificity while maintaining high sensitivity in detecting colonic polyps.
Methods: In this study, two-dimensional projection images are obtained from each initial polyp candidate or volume of interest, and features are extracted from both the gray and color projection images to differentiate FPs from true positives. These projection features were tested to exclude different types of FPs, such as haustral folds, rectal tubes, and residue stool using a database of 325 patient studies (from two different institutions), which includes 556 scans at supine and∕or prone positions with 347 polyps and masses sized from 5 to 60 mm. For comparison, several well-established features were used to generate a baseline reference. The experimental evaluation was conducted for large polyps (≥10 mm) and medium-sized polyps (5–9 mm) separately.
Results: For large polyps, the additional usage of the projection features reduces the FP rate from 5.31 to 1.92 per scan at the comparable by-polyp sensitivity level of 93.1%. For medium-sized polyps, the FP rate is reduced from 8.89 to 5.23 at the sensitivity level of 80.6%. The percentages of FP reduction are 63.9% and 41.2% for the large and medium-sized polyps, respectively, without sacrificing detection sensitivity.
Conclusions: The results have demonstrated that the new projection features can effectively reduce the FPs and increase the detection specificity without sacrificing the sensitivity. CAD of colonic polyps is supposed to help radiologists to improve their performance in interpreting computed tomographic colonography images.
Keywords: computed tomographic colonography, colonic polyps, computer-aided detection, projection images, features
INTRODUCTION
According to the up-to-date statistics from American Cancer Society (ACS),1 colorectal cancer ranks the third most common occurrence of both cancer deaths and new cancer cases in 2008 for both men and women in the United States. Fortunately, early detection and removal of colonic polyps prior to their malignant transformation can effectively decrease the incidence of colon cancer2, 3, 4 and, therefore, adequate time interval screening is recommended for people over 50 yr old by ACS.1 As a new minimally invasive screening technique, computed tomographic colongraphy (CTC) or CT-based virtual colonoscopy (VC) has shown several advantages over the traditional optical colonoscopy (OC).5 To improve the performance of CTC in detecting polyps, computer-aided detection of polyps (CADpolyp) has shown the potential of being a second reader assisting physicians for finding polyps in the colon.6, 7, 8, 9
Up to now, several research groups have developed various CADpolyp schemes.10, 11, 12, 13, 14, 15, 16, 17, 18, 19, 20, 21, 22, 23, 24, 25, 26 Although some of these schemes reported acceptable detection sensitivities, challenges still remain to hinder them from being used in clinical practice.27, 28 One of the challenges is the high detection rate of false positives (FPs), which distracts the physicians’ attention during their image interpretation and lowers their performance. Therefore, it is desirable to reduce the number of FPs as much as possible without sacrificing the detection sensitivity. Many previous works have been devoted to the reduction in FPs in their CADpolyp schemes, which may be generally classified into two strategies of (1) exploring new features that can better distinguish FPs from true positives (TPs); and (2) improving the performance of the classifiers or introducing new ones. We mainly focus on the first strategy in this study.
Shape-related features have been extensively reported in the previous works, such as various orders of statistics of the shape index and the curvedness,16, 17, 18, 19 the mean curvature, and sphericity ratio-based features,10 etc. However, many colonic objects, such as haustra fold, stool, and even the rectal tubes (RTs), have a shape very similar to true polyps. The shape-related features may fail to eliminate the polypoid FP findings. Therefore, many researchers have devoted great effort to extract the features from the CT density distribution in the volume of interest (VOI), referred to as texture features. Intuitively, the mean and standard deviation of the CT densities in the VOI were directly used to reduce FPs,12, 13, 16, 17, 18, 24, 25 while Göktürk et al.20 further evaluated them in several randomly selected orthogonal triple planes. Higher order statistics, such as the skewness and kurtosis, of the CT densities in the VOI were pursued in Refs. 16, 17. Lu et al.29 reported their texture features, such as the energy, entropy, etc., derived from the three-dimensional (3D) gray level co-occurrence matrix and gray level gradient co-occurrence matrix in the VOI. Suzuki et al. employed a 3D massive training artificial neural network (MTANN) combined with a predefined 3D Gaussian teaching volume to extract texture features for the elimination of RT-induced FPs in Ref. 30, and they further extended the method to include the mixture of 3D MTANNs to address multiple types of FPs.31
Most of the texture analysis methods mentioned above directly apply various orders of statistics of the image intensity distribution in each VOI to differentiate FPs and TPs. The difference of the CT densities of various material types might be ignored by those “global” statistical measures in the domain of the VOI. However, a local operation of projection or weighted line integral32 through the VOI is expected to enhance the subtle difference, such that the internal distinct distribution patterns of TP and FP findings (further explored in Sec. 2A) could be utilized to differentiate FPs and TPs. Therefore, in this study, we will explore several new features extracted from the projected images from the VOI of each initial polyp candidate (IPC).
The remainder of this paper is organized as follows. Section 2 provides the detailed description of our feature extraction method. The performance evaluation and experimental results are reported in Secs. 3, 4. Finally, several conclusions are drawn in Sec. 5 through some discussions.
METHODOLOGY
Motivation
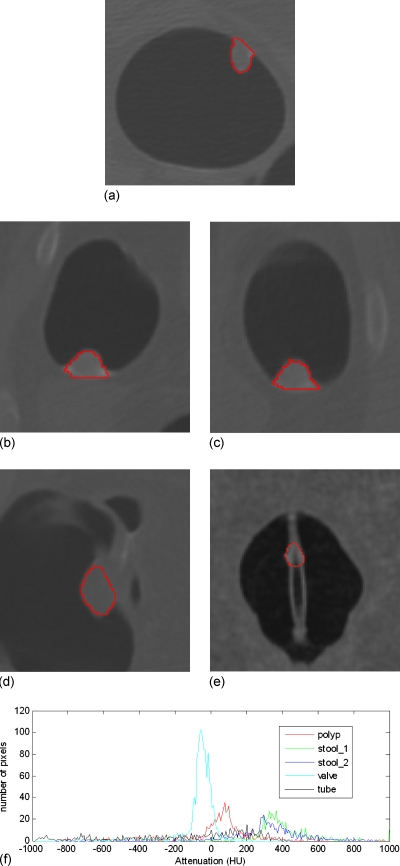
Radiologists often look into the 2D display of CTC images, which actually depends on the CT attenuation values, to decide whether a region of interest is a true polyp or not32 because there is an expectation that the CT density distribution would be visually different for TPs and FPs. In Fig. 1, the histograms of five VOIs (retrieved manually with inclusion of four neighboring slices of the concerned slice in the figure for each VOI) are plotted in terms of the CT density values. The plot from a polyp has a peak around 100 HU due to the soft tissue core, while the plots from two stools have a peak located over 300 HU because of the enhancement in the tagging material. The ileocecal valve has a peak around −80 HU owing to the fat tissue. The VOI on the tube has a relatively flat histogram, resulting in a flat peak around 180 HU, where many pixels have densities less than −200 HU since the tube is hollow and the VOI includes part of the hollow area. Therefore, we can roughly claim that the CT density distribution pattern is different between TPs and FPs, which explains the reason why the existing texture features have the capability of classifying TPs and FPs. However, most of the existing texture features, such as the abovementioned various orders of statistics of the CT densities, might overlook the difference of the distribution patterns. For example, the widely used feature of the mean of CT densities, a global measure, of the VOI of the polyp or the tube in Fig. 1 is 1.7 or −10.5 HU, respectively. This difference depicted by their histograms (peaked or flattened distribution) is very subtle (i.e., 1.7 vs −10.5 HU over the variation in 100 HU) and is less effective to classify FPs and TPs. Therefore, we try to employ the weighted line integral (or projection), a local operation, to enhance the difference of the CT density distributions.
Figure 1.
The histograms (bottom figure (f)) of CT density distribution of five VOIs, which are indicated by the closed curves in the above five pictures. From (a) to (e), the objects are a polyp, two stools (i.e., the stool_1 and stool_2 in (f)), an ileocecal valve, and a rectal tube.
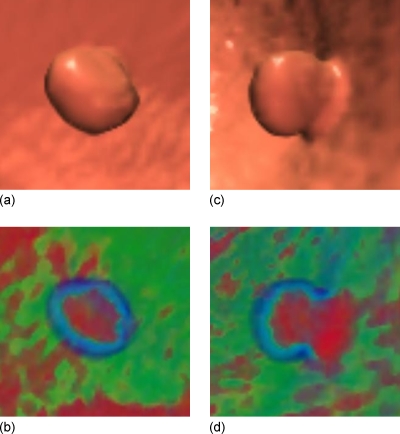
The usefulness of a single projection image, or so-called electronic biopsy view or a “local” operation vs the “global measure” of the existing texture features, through a suspicious patch has been shown in Refs. 33, 34. For example, a typical polyp larger than 5 mm, including neoplastic and non-neoplastic lesions, would have a uniform concentric ring pattern, with a red core gradually changing to a blue outer ring,34 as shown with the center area and the enclosed ring in Fig. 2b. Other colonic objects, e.g., tagged or even untagged stool, impacted diverticula, air bubble artifacts, etc., would have different color patterns.34 Actually, the color translucent image is the result of an integral operation in the viewing direction (i.e., the ray casting direction of the volume rendering33) with a color mapping scheme. With different eye positions or viewing directions, different patterns would be generated in the projected image, as shown in Fig. 2d. These observations reveal that the images from the projection or weighted line integral provide specific information of internal density distribution of a VOI and may serve as an alternative way for texture feature extraction.
Figure 2.
A 10 mm pedunculated tubular adenoma in the ascending colon of a 62 yr old female, showing a typical translucent color signature. (a) The 3D endoluminal view of the polyp. (b) Translucency display applied to the 3D image in (a). (c) The 3D endoluminal view of the same polyp, but from another direction. (d) Translucency display applied to the 3D image in (c).
In this study, orthogonal projections along three optimal directions (rather than a single arbitrary direction for better description of texture feature) of each IPC are obtained, and several effective features are extracted automatically from the projected images to differentiate FPs and TPs. These steps of extracting the projection features are incorporated into the following CADpolyp scheme.
Overview of CADpolyp scheme
Before going to the details of our methods (to be presented in the following subsections), we outline the CADpolyp scheme in Fig. 3. Our previous methods25, 35, 36 were used to generate the VOIs of IPCs. With the generated VOI, we first set up the local reference frame (LRF), and then apply two different projection schemes to obtain gray level and color 2D projection images, based on which we extract the new features. Finally, all the features are fed into the well-known classifier of support vector machines (SVMs)25, 37 to classify the TPs and FPs. In this study, we focus on the feature extraction part in Fig. 3.
Figure 3.
Overview of our CADpolyp scheme.
LRF and subvolume of an IPC
To establish three optimally orthogonal directions for better projections of a VOI, we first define a normal direction of an IPC, along which the height of the candidate is measured. By observation from Figs. 2a, 1b, we notice that the direction close to the normal of a polyp would be very meaningful. Therefore, a LRF is set up for each IPC based on its normal direction, as shown in Fig. 4. It might be difficult to find the exact normal direction for each IPC because of the large variation from case to case in practice. For simplicity, we define the normal direction as follows:
| (1) |
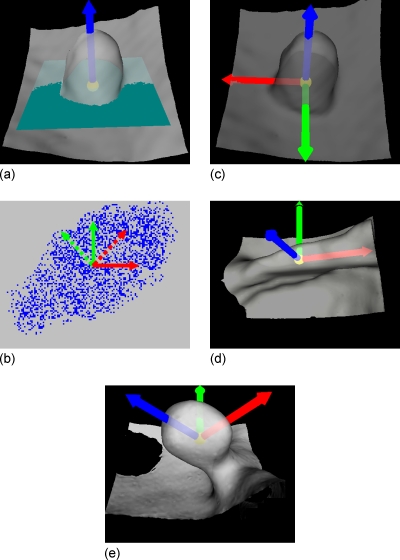
where C represents the VOI of an IPC under consideration, Seed(C) is the set of seed voxels of the IPC, and SI(pi) and denote the shape index and the unit image gradient at voxel pi. The details of seed voxels labeling, shape index, and unit image gradient computation are given in Refs. 25, 35. In Eq. 1, a larger shape index indicates that the voxel is closer to the peak point of the polypoid shape and, therefore, a higher weight should be put on the gradient at that voxel. The arrow in Fig. 4a shows the normal direction which is extracted from the polyp in Fig. 2a.
Figure 4.
Definition of the LRF for a polyp candidate. (a) The arrow along the protruding direction represents the normal direction of the polyp candidate, starting from a small ball centered at the centroid of the VOI of the polyp candidate. The rectangle through the centroid of the VOI denotes the plane perpendicular to the normal direction. (b) Extraction of the optimized 2D frame (the dotted arrows) of a point set (the points mimicking the results of projecting the VOI to the plane in (a)). The solid arrows represent an arbitrarily selected initial frame. (c) The resulted LRF of the polyp candidate in (a). (d) The LRF of an IPC on a fold. (e) The LRF of another 9 mm tubular adenoma. Unlike the one in (a), this polyp has a large angle from the colon wall.
Intuitively, the LRF for each IPC can originate from the centroid of the extracted VOI [the small ball in Fig. 4a]. As for the other two orthogonal directions, they are expected to align with the local “ridge” if it exists. As shown in Fig. 4d, the arrow pointing to the right of the image is expected to align with the ridge of the fold. Therefore, these two directions can be determined using the principal component analysis (PCA).38 Along the normal direction, voxels in the VOI are orthogonally projected onto the plane perpendicular to it, as illustrated by the dots in Fig. 4b. The x and y coordinates of all the dots under an arbitrary 2D frame [the solid arrows in Fig. 4b] are taken as two signals. As a result, the eigenvectors of their covariance matrix are the optimized orthogonal directions, along which the signals vary maximally and minimally. As shown in Fig. 4b, the dotted arrow pointing to top-right of the image is the eigenvector with larger eigenvalue, and the dotted arrow pointing to top-left of the image represents the one with smaller eigenvalue. For convenience, we refer to the three directions of the LRF as axial, sagittal, and coronal directions. Figure 4c illustrates the LRF of the 10 mm polyp in Fig. 2a, which stands vertically on the colon wall, while Fig. 4e shows the LRF for a polyp with a tilted angle from the colon wall. The results of some other IPCs can be seen in Fig. 9. Figure 4d shows the LRF of an IPC on a fold.
Figure 9.
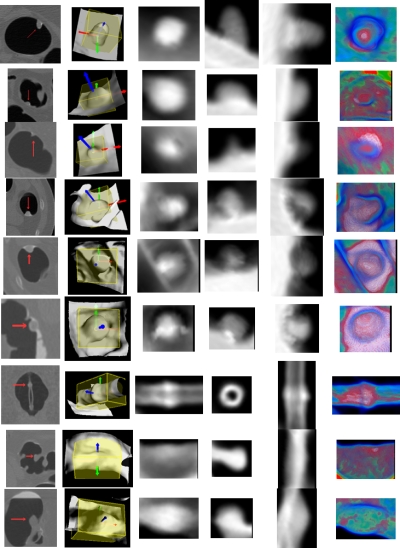
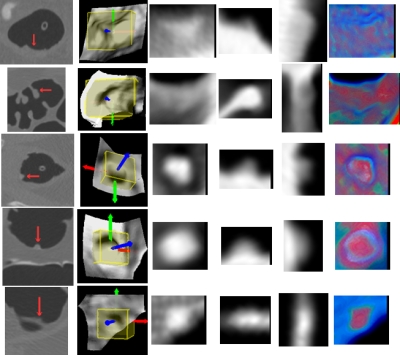
Illustration of the projected gray and color images of several IPCs (including FP and TP findings), where each row represents one IPC. Column 1 shows parts of the original axial, coronal, or sagittal CTC slices with the arrow indicating the IPCs. The sub-volumes and LRFs are shown in column 2. Columns 3 to 5 show the corresponding gray images (the axial, sagittal, and coronal images) of the IPCs. The last column shows the axial color image generated by Eq. 3. True polyps in rows 1 to 3 are 10 (same as in Fig. 2), 9, and 6 mm, respectively. FPs in rows 4 to 6 are three tagged stool, while rows from 7 to 9 are a tube, a thickened fold, and a round ileocecal valve.
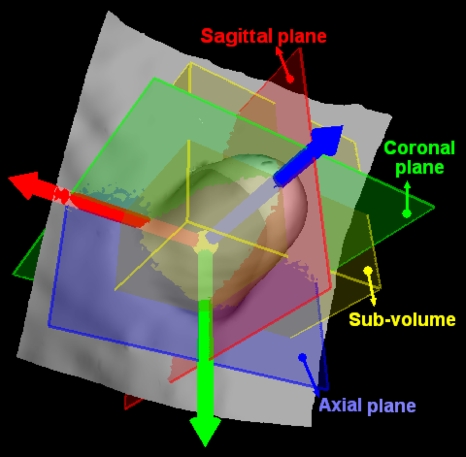
To generate projected images, a subvolume is extracted for each IPC, which is the bounding box of the VOI of each IPC under the LRF. Figure 5 shows the subvolume of the polyp in Fig. 2a with the box. Here we call the planes perpendicular to the three directions as axial, sagittal, and coronal planes, respectively, as shown in Fig. 5. The subvolumes of several IPCs including TPs and FPs are listed in the second column of Fig. 9.
Figure 5.
The sub-volume (the box) of a 10 mm pedunculated tubular adenoma in Fig. 2a.
Typically, the subvolumes of TPs are in cubic shape due to their round polypoid appearance. However, the subvolumes of some FPs, especially those due to long folds (as shown in row 8 of Fig. 9) and rectal tubes (row 7 in Fig. 9), have much larger size in one direction of the LRF. Therefore, a morphological feature, named as axis-ratio, can be designed as
| (2) |
where La, Ls, and Lc represent, respectively, the sizes of the subvolume along the three directions of the LRF.
Acquisition of projection images
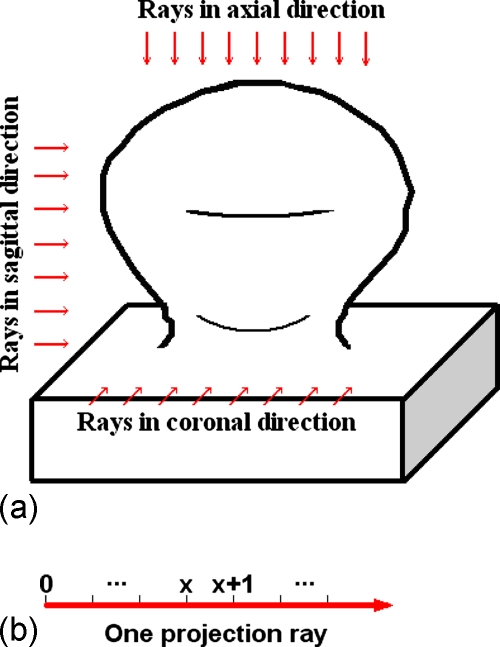
After the LRF is built for each IPC, projection images can be easily acquired by projecting the VOI orthogonally onto the axial, sagittal, and coronal planes, respectively, as illustrated by Fig. 6. During projection, the sampling interval of each projection plane is set to be half of the voxel unit, and the CT values at the sample points are linearly interpolated. The generated 2D images on the axial, sagittal, and coronal planes are referred as axial, sagittal, and coronal images, respectively. The projected images of the polypoid object in Fig. 6 are shown in Fig. 10.
Figure 6.
Illustration of the projection procedure. (a) The projection rays in three directions (arrows) shoot through the 3D polypoid object, and are collected on the three projection planes to form 2D projection images as shown in Fig. 10. (b) Points are evenly sampled on each projection ray.
Figure 10.
Illustration of the projection images of the 3D polypoid object in Fig. 5, where the arrows indicate the characterizing patches. (a) The axial image. (b) The sagittal image. (c) The coronal image.
To expose the internal structure of IPCs, we simulate the ray casting technique33 with a weighted iterative integration process along the projection ray as
| (3) |
where i varies among the red, green, blue model39 and white color channels, and o represents the opacity value serving as the weight. The subscripts d and s indicate the resulted destination and incoming source colors in the iteration process. Together with such a weighted line integral scheme, the differences of CT density values of various material types are explored with the transfer function in Ref. 34. To make a self-contained presentation, we quote the plot of the transfer function in Ref. 34 as Fig. 7. With the function, the green and blue channels monotonically increased with the CT densities in the ranges of [−436, −16] HU (covering all the fat tissue) and [−920, −128] HU (covering all the lumen), and are zeroed elsewhere. The red and white channels are assigned nonzero values only for CT densities larger than −64 HU (including all the soft tissue and bone∕tagging material) and 200 HU (covering all the bone∕tagging material), respectively. The opacity varied in the range of [0, 0.35] as a piecewise linear function of the CT densities. As a result, a projection ray dominated by soft tissue, lumen, fat tissue, or tagging material∕bone will lead to a red, blue, green, or white pixel, respectively, in the projection image.
Figure 7.
Plot of the transfer function which was used for the projection images, where the solid, dash dotted, and dotted curves indicate the mapping of the red, green, and blue channels. The white channel is shown with the dashed curve, and the solid curve with diamonds plots the opacity values according to attenuation (HU).
Additionally, the CT densities along the projection ray are simply accumulated and the accumulation results are normalized to generate gray level images. Such gray projection images can be utilized to pursue the polypoid shape of TP findings, as illustrated in Sec. 2E.
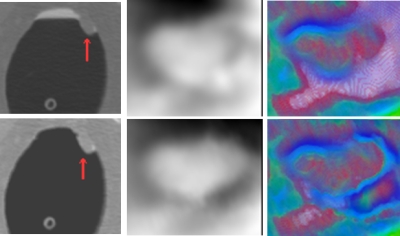
After applying the MAP-EM segmentation algorithm,40, 41 we get the cleansed CTC volumes with the tagged materials being removed. Column 1 in Fig. 8 shows the uncleansed and cleansed axial slices around a TP finding. After applying the above two projection schemes to the uncleansed and cleansed CTC volume, the axial gray and color projection images are shown in the right two columns in Fig. 8. As can be seen, the MAP-EM segmentation algorithm removes the residue materials and exposes the polypoid shape more conspicuous than the uncleansed one. Therefore, the highlighted patch (to be described in Sec. 2E) in the gray axial image from the cleansed volume appears more obvious than that from the uncleansed volume. Similarly, the red core (to be detailed in Sec. 2F) in the color axial image from the cleansed volume appears more obvious as well. In this study, we apply the two projection schemes to the cleansed volumes. Figure 9 lists the projection images of several IPCs including TP and FP findings. Based on these projection images, several effective features are derived from analysis of TPs and FPs, as described in the following subsections.
Figure 8.
The axial projection images (last two columns) of a 10 mm polyp based on the original (upper row) and cleansed (bottom row) CTC images. The arrows in the left column indicate the IPC findings.
Features based on gray projection images
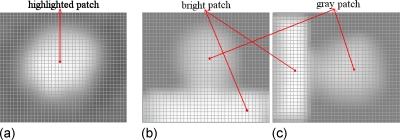
From three directions of LRF, the projected 2D gray images show characterizing patterns. Figure 10 illustrates the three projection images of the polypoid object in Fig. 6. For the axial image, on the rays around the central part of the projection plane, there are more sample points having higher intensities due to soft tissue than those around other parts, where there are more lumen sample points. This leads to a highlighted disklike patch (or simply highlighted patch) in the center area of the image. As for the sagittal and coronal images, rays going through the outer part (the peak) of the polypoid object have less high intensity points than those going through the base where the object is sitting on. Therefore, a gray and a bright patch are visible in the images. Furthermore, the gray patch often locates at the midtop in the sagittal image and at the midright in the coronal image. The bright patch usually locates at the bottom in the sagittal image and at the left in the coronal one. Such pattern characteristics can be observed in the gray images of polypoid IPCs (rows 1–6 and 9 in Fig. 9), but are not available in the images of the FPs, e.g., the fold (row 8 in Fig. 9), and the rectal tube (row 7 in Fig. 9). Based on the above observations, we build up features from the three gray projected images.
Similar to Sec. 2C above, the seed voxel set Seed(C) of the VOI represents the peak of the polypoid shape, and the projection of it, referred to as the seed patch in this paper, usually locates inside the highlighted patch of the axial image, as shown in Fig. 11a. Therefore, starting from the seed patch, the highlighted patch can be extracted by a conditional dilation process
| (4) |
where Pn represents the highlighted patch at step n, and N(Pn) represents a set of pixels satisfying the following equation:
| (5) |
where N4(Pn) represents the four connected neighbors of Pn, I(p) is the image intensity at pixel p, and is the mean intensity of the seed patch (P0). Positive constants εmin<εmax put a limit such that only those new neighbors with similar intensities will be added to the patch. The patch in Fig. 11b indicates the final highlighted patch of the polyp in row 1 of Fig. 9.
Figure 11.
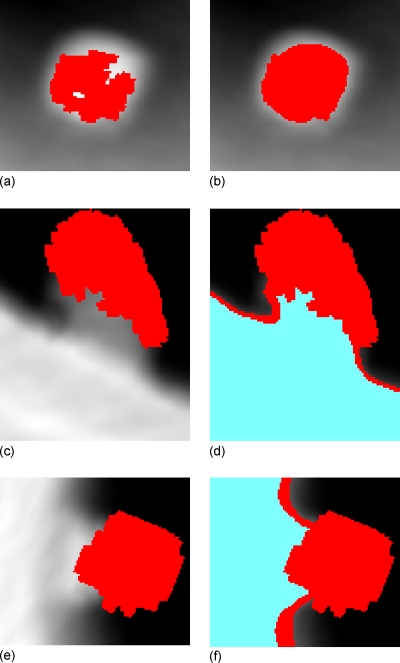
Extraction of the patches in axial, sagittal, and coronal images of the polyp in row 2 of Fig. 7. Pictures (a), (c), and (e) show the projections of the seed voxel sets Seed(C), i.e., the patches imposed on the axial, sagittal, and coronal images, respectively. Picture (b) shows the highlighted patch (center area) in the axial image. Pictures (d) and (f) show the gray patch (upper and right area) and bright patch (bottom and left area) in the sagittal and coronal images.
The same conditional dilation process can be applied to extract the light patches in sagittal and coronal images, respectively. In addition, starting from the extracted gray patches, Eq. 4 is applied again but with larger range of constants εmin and εmax to get the bright patches in the sagittal and coronal images. The extracted gray and bright patches of the polyp in row 1 of Fig. 9 are shown with the patches in Figs. 11d, 11f.
From the extracted patches, several features can be derived to distinguish TPs from FPs. For example, in the axial image, the highlighting ratio is defined by the ratio of the mean intensity of the highlighted patch and its surrounding area to depict how much the patch is highlighted. The larger the value is, the higher the possibility of the IPC will be a true polyp. The surrounding area of the highlighted patch is determined by dilating for a specific distance Ls from it.
The morphological characteristic of the disklike highlighted patches of TPs is reflected by a feature called the disk-likeness, denoted as DL(P) of patch P by
| (6) |
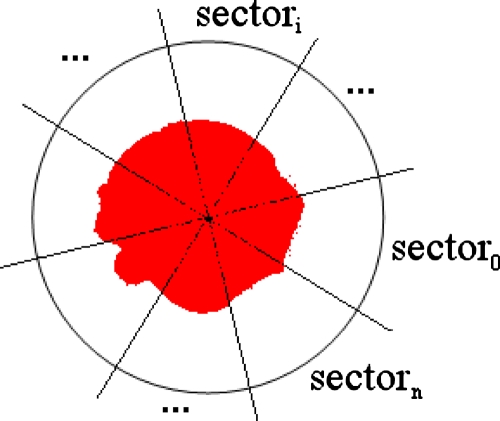
where |⋅| counts the number of elements in a set. As shown in Fig. 12, centered at the centroid of the highlighted patch, a circular area is split into n sectors. The number of pixels in the highlighted patch is counted in each sector, and intuitively, a smaller variance of such numbers for all the sectors would indicate that the patch is more similar to a round disk. A larger sector number n would provide a more accurate estimation.
Figure 12.
A graphical illustration of the disk-likeness of a highlighted patch (the center area), where the circle is centered at the centroid of the patch.
In the sagittal∕coronal images, the ratio of the mean intensity of the gray patch and bright patch is reflected by a feature named as the lightness ratio. Additionally, as mentioned above, the location of the gray and bright patches can also be used to characterize TPs and, therefore, the normalized positions of the centroids of the gray and bright patches are chosen as the corresponding features. Taking the gray patch of the sagittal image as an example, we get two features and
| (7) |
where cx and cy represent the coordinates of the centroid of gray patch PL, and Lx and Ly are the sizes of the sagittal image in the related directions.
It should be noted that the three gray images of the residual stool might be similar to those of the true polyps (as shown in rows 4–6 in Fig. 9), which would impair the performance of the features mentioned above. Fortunately, as reported in Ref. 34, in the presence of tagged colonic materials, most FPs due to the residual stool could be eliminated by the use of the translucency display. To further differentiate the tagged colonic materials, we extract more features from color projection images based on the color mapping scheme.
Features based on color projection images
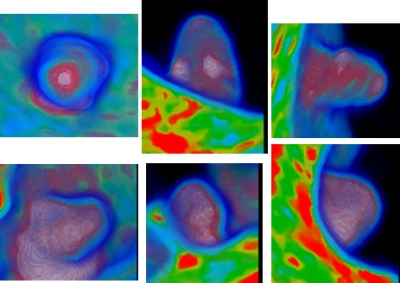
The color mapping scheme in Sec. 2D (Fig. 7) assigns different values of the blue, green, red, and white channels and of the opacity according to different CT density values (indicating different tissue types). The two rows in Fig. 13 show all the three color images of a true polyp and a residual stool, respectively, which are the same IPCs in rows 1 and 4 in Fig. 9. By visual inspection on the color distribution of the two IPCs, it can be recognized that these two objects can be characterized by the colors in the central area in the two axial images (to be detailed in the following text). In the sagittal and coronal images, the locations of the red and white areas are essentially similar to the gray patches in the corresponding gray projections. Therefore, we can use the axial color images to extract characterizing features to further differentiate FPs and TPs.
Figure 13.
The three color projection images of the two IPCs in rows 1 (TP) and 4 (stool FP) of Fig. 9, where the axial images are repeated here for comparison purpose.
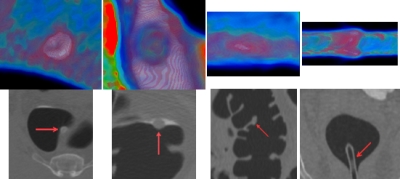
The last column in Fig. 9 shows the projected axial color images of some IPCs. Typically, the dominant soft tissue inside true polyps (rows 1 to 3 in Fig. 9) gives rise to red cores, which are enclosed by blue rings due to the tissue-lumen interface, in the axial projection images. As a major challenge for any stool-tagging technique,42 the coated surface of the polyp by the tagged colonic materials could cause error in detection, and now it can lead to white color in the projection. However, the soft tissues in the polyp would still give rise to a red-dominant core in the color image, as shown in the center area in row 1 column 6 in Fig. 9. The rows 4–6 in Fig. 9 show the typical patterns of tagged stool, which give the white-dominant cores in the color image due to the tagged material distribution all over the stool. This is also evidenced by another stool in column 1 of Fig. 14. However, the stool in column 2 of Fig. 14 is partly submerged in the fluid and is less tagged compared to the fluid, and so the white core is not available in the color image. Fortunately, the red core is not available either. The color images in rows 7 and 8 in Fig. 9 show two other common FPs in CADpolyp systems, i.e., a rectal tube and a fold. In addition, two other examples of a fold and a tube are shown in columns 3 and 4 in Fig. 14. For these IPCs, the soft tissue and pseudosoft tissue voxels in the fold and the tube lead to red patches in their corresponding color images. Fortunately, such kinds of IPCs can be excluded by their large axis-ratio values (described in Sec. 2C). The ileocecal valve mimics big polyps, and is a common source of FPs both for radiologists’ inspection and CADpolyp systems. However, the characteristic fat tissue in the valve leads to green pixels in the core area (row 9 column 6 of Fig. 9), and this color pattern is not available in the color images of the true polyps.
Figure 14.
Color projection images (first row) of four IPCs, where each column represents one IPC. The second row shows the IPCs (indicated by the arrows) from zoomed CTC axial∕sagittal slices. Columns 1 and 2 are two stool. One is a tagged adherent stool on a fold, another is partly submerged in the fluid and is less tagged. Column 3 is a thickened fold without any tagged material nearby and column 4 is a tube in another scan.
Based on the above analysis of human perception on various colors, we adopt the hue, saturation, intensity (HSI) color model to represent the projected colors for the purpose of better description of features. The HSI model has been evidenced to closely correspond to the way of how human eyes describe and interpret colors.39 The red-dominant core in the color axial image is a meaningful signature of true polyps against that of the stool, ileocecal valves, colon folds, and rectal tubes, and is called “core area” from which features will be extracted. Similar to the situation of extracting the highlighted patch of the axial image in Sec. 2E above, there are more sample points with CT densities of soft tissue types and less sample points of lumen type on the projection rays pass through the seed voxels in the VOI of each IPC as compared to those rays through other parts of the VOI [as shown in Fig. 6a]. Therefore, we take the highlighted patch as the core area and describe the associated color pattern. Typically, the red pixels in the red core of a true polyp will distribute as a cluster around the center of the core area, thus we design the weighted average
| (8) |
to reflect the color distribution characteristics of the core area, where i denotes the pixel in the core area and (xi,yi) indicates its coordinates, and n represents the hue, saturation, or the intensity at each pixel, and (mx,my) is the center of the core area. The parameter σ in the weighting term wi is adaptively estimated by the average of the standard deviation of the x and y coordinates of the pixels in the core area. Theoretically, the combination of (fhue, fsaturation, fintensity) shall fully reflect the dominant color of the core area. Therefore, the combination, referred to as the dominant color in this study, is directly used as a feature to characterize TPs and FPs.
DESIGN FOR PERFORMANCE EVALUATION
CTC database
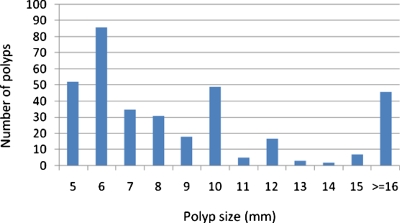
The performance of the extracted features was evaluated on a CTC database of 325 patient studies, which included 66 from the University of Wisconsin Hospital and Clinics and the rest from the publicly available WRAMC database at http://imaging.nci.nih.gov (courtesy of Dr. Richard Choi), Virtual Colonoscopy Center, Walter Reed Army Medical Center, Washington, DC. In these cases, the colon cleansing was performed with standard precolonoscopy or barium enema bowel preparation. Single dose of 2% barium (250 ml) and diatrizoate (60 ml) were given to tag residual stool and fluid for the cases from the first institution, while 500 ml barium and 120 ml of Gastrografin for those from the second institution. For both institutions, multislice CT scanners (Light Speed Ultra, GE Medical System, Milwaukee, WI) were used in helical mode to collect data with collimations of 1.25–5.0 mm, pitch of 1–2, reconstruction interval of 1.25–5.0 mm and the scanning protocol including modulated mA s in the range of 50–200 and kVp in 120–140. Patients from the second institution were scanned in both supine and prone positions, while some of those from the first institution were scanned at an additional lateral position. Among all of these scans, some of them were inadequately distended or some had severe artifacts and, therefore, were excluded from the performance evaluation study. As a result, there were 556 scans altogether, of which 258 scans had polyps and the remaining 298 had no polyp. Assuming that one polyp in different scans was counted as different polyps, there were 347 clinically significant polyps and masses confirmed by both OC and VC. The size distribution of the polyps and masses is shown in Fig. 15, where 64% (222∕347) of the polyps are less than 10 mm. The evaluations were conducted in two polyp size categories of clinical importance: ≥10 mm (125 including, four masses larger than 30 mm) and between 5 and 9 mm (222). Polyps smaller than 5 mm were not considered in this study. For simplicity, the term polyp in the following text refers to both polyp and mass.
Figure 15.
The size distribution of the 347 lesions in the CTC database.
Feature extraction
After IPCs were generated (details in IPC generation can be found in Refs. 25, 36), the LRF and the subvolume of each IPC were extracted (as described in Sec. 2C). From each subvolume, the projection procedure described in Sec. 2D was conducted with two integration schemes to generate the gray and color projection images, respectively.
By the use of Eqs. 4, 5, the highlighted patch in the axial gray image was extracted with the parameters (εmin,εmax) to be set as (0.85, 1.15). That means if the intensity of a neighboring pixel is larger than 85% but less than 115% of the mean intensity of the seed patch, the pixel would be added into the highlighted patch; otherwise it would not. Such a relatively narrow range will make sure that the newly added pixels have similar intensities to that of the original seed patch, which is believed to be part of the highlighted patch. The resulted highlighted patch was then expanded by 4 pixels with a dilation process to specify its surrounding area. In our experiments, the feature of highlighting ratio has performed fairly well with Ls=4, while it would be hampered if dilated too much (such as 6 or more) or too few (such as 1 or 2). The highlighting ratio was then evaluated by the ratio of the mean intensities of the highlighted patch and its surrounding area. The morphological character of the highlighted patch was measured by its disk-likeness with the sector number to be 180 (as shown in Fig. 9). Similarly, to retrieve the light patches of the coronal and sagittal gray images, (εmin,εmax) were set to be (0.85, 1.15), but a broader range of (0.95, 2.85) was used to include denser neighboring pixels for the bright patches.
The highlighted patch described above was directly used to label the core area of the axial color image, based on which we extracted the dominant color through Eq. 8. The involved parameters in Eq. 8 were described in Sec. 2F.
In summary, most of the new features are highly dependent on the CT density distribution, i.e., they are a kind of texture features. However, some features, such as the axis-ratio, highlighting ratio, disk-likeness, and lightness ratio, are associated with shape description (as seen in Sec. 2E). In order to evaluate the performance of these new features, four well-known existing features were used as the reference, including two shape-related features [i.e., the mean of the shape index mean (SI) and the variance of curvedness [var(CV)]] and two texture-related features [i.e., the mean mean(CT) and the variance var(CT) of the CT values].17 All the features involved are listed in Table 1 below.
Table 1.
The list of all features used in this study.
| Features | Description | |
|---|---|---|
| Existing features | mean(SI), var(CV) | Mean of the shape index and variance of the curvedness. |
| mean(CT), var(CT) | Mean and variances of the CT values. | |
| New features | AR | The axis-ratio. |
| HR, DL | The highlighting ratio and disk-likeness from the axial gray image. | |
| LRC, LRS | The lightness ratios of the coronal and sagittal gray images. | |
| , , , ; , , , | The normalized positions of the light and bright patches in the coronal and sagittal images. | |
| fhue, fsaturation, fintensity | The three components of the dominant color of the core area in the axial color image. |
Classification
After applying the initial candidate detection methods of Refs. 25, 36 on all the 556 scans, 11 047 IPCs were generated, where all the 347 true polyps were successfully detected. The features of Table 1 from these IPCs were fed into an online-available package of SVM classifier.37 Two modifications were made on classifier25 as follows: (1) The training goal was modified to minimize the number of FPs at a specified detection sensitivity level of TPs, so that the classification potentials of different features can be investigated through free-response receiver operating characteristic (fROC) analysis; and (2) an adequate larger weight was exhausted and assigned to TPs in the training samples to modulate the heavily imbalanced data sets (biasing toward FP class since there are much more FPs than TPs). A tenfold leave-one-out cross-validation was employed in SVM to seek for an unbiased training process. The nonlinear radial basis function (RBF) kernel was used in this study. There are three parameters involved, the cost function value C, the RBF kernel parameter γ, and the weight w on TPs. The optimal values of the three parameters were determined automatically by a 3D grid search method (a roughly exhausting process). More details can be seen in Ref. 25.
Samples were randomly selected to form independent training and testing sets. To obtain more meaningful results, the grouping process was conducted 25 times and, therefore, led to 25 runs of the corresponding classification process. Table 2 lists the distributions of samples and polyps in the two sets in the 25 grouping processes.
Table 2.
Data distribution in the training and testing sets.
| Total scans | ≥10 mm | 5–9 mm | |
|---|---|---|---|
| Training set | 150 (±4) | 40 (±10) | 78 (±15) |
| Testing set | 406 (±4) | 85 (±10) | 144 (±15) |
In the performance evaluation of the extracted new features, two experiments were conducted: (1) Only the four existing features were used; and (2) all the 20 features of Table 1 were input to the SVM classifier. In the 25 runs of the classification process, the same training and testing sets mentioned above were used in the two experiments. The averaged performance of each of the 25 runs of the two experiments was plotted as the fROC curves for comparison purpose. The detection sensitivity was quantitatively measured using the by-polyp sensitivity, and the FP rate was quantified by the number of FPs per scan.
RESULTS
Overall performance
Figure 16 shows the fROC curves of the overall performances from the two experiments on (1) polyps of size ≥10 mm and (2) polyps of size 5–9 mm. In the figure, the transparent rectangle at each operation point represents the 95% confidence intervals of the detection sensitivity (height of the rectangle) and FP rate (width of the rectangle).
Figure 16.
The fROC curves of the two experiments on two categories of polyps.
At the comparable sensitivity levels as indicated by the black dots on the fROC curves in Fig. 16, the performance of the two experiments is tabulated in Table 3.
Table 3.
Performance comparison of the two experiments.
| First expt. (≥10 mm) | Second expt. (≥10 mm) | First expt. (5–9 mm) | Second expt. (5–9 mm) | |
|---|---|---|---|---|
| Sensitivity | 0.931 (0.875–0.959) | 0.932 (0.905–0.981) | 0.806 (0.731–0.856) | 0.807 (0.771–0.856) |
| FP rate | 5.312 (5.110–5.540) | 1.915 (1.805–2.055) | 8.890 (8.590–9.350) | 5.231 (4.881–5.441) |
False positive analysis
The analysis on the survived FPs in the two experiments would help us understand the new features and provide clues for further improvements. In the above evaluation process, the two experiments were repeated 25 times on the two categories of polyps, respectively, i.e., the testing procedure of each experiment was repeated 50 times on 50 testing sets with about 406 sample series each. In a pair of corresponding testing procedures of the two experiments, eight sample series shared by the two testing sets were randomly selected and the FPs in the eight sample series passed the testing procedure were collected. A sample series might be selected multiple times in the selection process, and it was taken as a different sample series and the resulted detection was accounted as different detections too. Finally, 400 sample series were selected to undergo the testing procedures of the two experiments. The final FPs were reviewed to figure out their identities, such as tagged stool, haustra fold, etc., by the use of a 3D navigation together with 2D review of the Viatronix V3D-Colon Module (Stony Brook, NY). The types of FP findings are listed in Table 4, where the last column indicates the percentage of different types of FPs reduced by the use of the additional new features in the second experiment. The term “ECC artifacts” is borrowed from Ref. 42, which mainly refers to those FPs caused by the unremoved fluid surface after the electronic colon cleansing (ECC) at the interface of the three materials, i.e., the fluid, air, and colon wall.
Table 4.
Types of the FP findings after the two experiments.
| Type of FP findings | First expt. (existing features used only) | Second expt. (all the features applied) | Reduction percentage (%) | ||
|---|---|---|---|---|---|
| No. of occurrences (n=2847) | Percentage (%) | No. of occurrences (n=1312) | Percentage (%) | ||
| Prominent folds | 737 | 25.9 | 426 | 32.5 | 42.2 |
| Stool | 726 | 25.5 | 429 | 32.7 | 40.9 |
| Rectal tubes | 675 | 23.7 | 43 | 3.3 | 93.6 |
| Ileocecal valves | 157 | 5.5 | 49 | 3.7 | 68.8 |
| ECC artifacts | 361 | 12.7 | 256 | 19.5 | 29.1 |
| Motion artifacts | 117 | 4.1 | 66 | 5.0 | 43.6 |
| Others | 74 | 2.6 | 43 | 3.3 | 41.9 |
DISCUSSION AND CONCLUSION
The subtle difference of the CT density distribution inside a polyp vs that in FPs can be enhanced in the projection images. Previous studies have shown that true polyps would have distinguishing patterns on projected 2D images against those of other colonic objects such as folds, rectal tubes, and tagged stool. Based on these observations, we have proposed a LRF-based orthogonal projection procedure with two different mapping schemes to obtain the projection images. From the projected images, we have extracted several characteristic features to reduce FPs in order to increase the detection specificity of our CADpolyp pipeline.
The innovation of this work lies in the operations of (1) determining three optimal orthogonal directions (i.e., the LRF) from each IPC; (2) employing two different projection schemes to generate gray and color projection images; and (3) designing 16 new features (listed in Table 1) to reflect the characteristic and distinctive patterns of TPs and FPs in the projection images.
From the two experiments on a CTC database including 556 CTC scans with 347 OC-confirmed and VC-confirmed polyps and masses, the presented new features performed very well for both large (≥10 mm) and medium-sized polyps (5–9 mm), demonstrating their potential to remove FPs caused by various types of sources. As shown by the fROC curves in Fig. 16, the second experiment using all the features consistently outperform the first one using only four existing features at all sensitivity levels. For large polyps, the additional usage of the new features reduces the FP rate from 5.312 to 1.915 per scan at the comparable by-polyp sensitivity level of 93.1%; for medium-sized polyps, the FP rate is reduced from 8.890 to 5.231 at the sensitivity level of 80.6%. The FP reduction percentages are 63.9% and 41.2%, respectively, without sacrificing detection sensitivity (no loss of TPs). A larger reduction percentage indicates that the new features are more effective to identify the larger polyps than the differentiation of the medium-sized polyps. This is expected because more steps along the line integral are conducted in the projection process through a larger VOI of a large polyp.
After investigating all the FPs in 400 sampled series (covering most of the scans in our database) survived from the testing procedures in the first and the second experiments, the types of these FP sources were analyzed in Sec. 4B. As shown in Table 4, the number of FPs is reduced from 2540 in the first experiment (without using the new features) to 1050 in the second one (including the new features). Multiple types of FPs, especially those induced by rectal tubes and ileocecal valves, are effectively removed with reduction percentages of 93.6% and 68.8% for the two groups of polyps with different sizes. The FP findings in the IPCs due to folds, stool, and motion artifacts are removed more than 40% by the use of the additional new features.
In Table 4, we notice that there is no FP finding due to noncolonic objects, such as those in the small bowel or stomach. This is benefited from our previously reported MAP-EM soft image segmentation method combined with the noncolonic objects removal strategies.41
As a matter of fact, the features from the projected gray images, such as the highlighting ratio, the disk-likeness, and the lightness ratio, share a common point with the MTANN score in Refs. 30, 31 in such a manner: If the CT density distribution in the subvolume is closer to a 3D Gaussian distribution, then a larger value will be assigned to both a projection feature in this study and a MTANN score in Refs. 30, 31, indicating a higher probability of a detection of TP. However, the proposed line integral in this work reflects directly the CT density distribution pattern. In addition, the subtle change in CT densities due to tissue difference is further considered and reflected by the new features from the axial color image, where the usefulness of the new features were evidenced by experienced radiologists’ visual assessment.34 Based on the visual assessment of the translucency views in Ref. 34, we designed the characteristic features in the axial color image according to the distinguishing color distribution pattern of true polyps. Although the color images in the other two (i.e., sagittal and coronal) directions were not investigated in this study, we expect that useful features would be extracted from these two projected images. This is our next task along this research track.
Although the performance of the extracted new features is quite encouraging, we realize that we still have FN and FP in the CADpolyp outputs, as shown in Fig. 17. The flat lesion in row 1 shows nonpolypoid shape, and its gray and color projections disagree with the analysis on the common true polyps in Secs. 2E, 2F above. The small (5 mm) polyp in row 2 lies on a fold, and its lack of the highlighted patch and the large axis-ratio in the projected images cause a negative detection. The two hard stool balls in rows 3 and 4 have good polypoid shape and their gray projection images are essentially the same as that of a typical polyp. Furthermore, they are not tagged and have very similar CT density distribution as that of true polyps. Therefore, the red cores in the center area of the axial color images are also very obvious. As a result, they are classified as positive detections. The last row is actually a normal polypoid bump on the fold. Its subvolume has a cubic shape, resulting in a small axis-ratio measure. The conspicuous highlighted patch and red core in the axial gray and color images causes the classifier to put it into the category of positive detections. As seen in the literature of radiology, flat lesions and small polyps are the common sources of FNs43, 44, 45, 46 and nontagged stool is one of the main sources of FPs.42 To develop a reliable CADpolyp system, further refinement of the proposed features should be made to reduce the causes of these FNs and FPs. This is another task of our research in the future.
Figure 17.
Some examples of FN and FP detections. Similar to Fig. 9, one row represents one object. Rows 1 and 2 are two FNs, which are a 30 mm flat mass and a 5 mm polyp on the fold. The last three rows are three FPs, where rows 3 and 4 are two nontagged hard stool balls and the last row is a normal polypoid bump on the fold.
During the experiments, we noticed that the accuracy of the LRF (in Sec. 3B) largely depends on the geometric measures, such as the image gradients on the colon wall. Therefore, the level set-based adaptive convolution method, which was previously reported in Ref. 25, was employed to ensure that the geometric computation is adaptive to the local topology of the colon wall. However, it still remains a challenge of how to make the geometric computation adaptive to the object scale (size) on the colon wall. Further investigation is needed to improve the accuracy of the geometric measures. The normal direction of a polyp (the axial direction of LRF) in this study is essentially the same as the elevation direction in Ref. 47 and has been used to measure the local height map. In Ref. 47, the elevation direction was determined by an exhausted optimization process of maximizing the concentric index. This strategy might have the ability to improve the accuracy of the LRF.
In the evaluation, all the 20 features were directly stacked together to form 20-dimensional feature vectors and then were input into the SVM classifier. This may induce the curse of dimensionality and deteriorate the performance of the classifier.48 Selecting features has been a research topic and will be our next task to improve the CADpolyp. For example, we will employ the feature selection method of stepwise regression49 to select most useful features to reduce the dimension of feature vectors. The use of PCA-based feature selection is under progress.50, 51
As addressed by Sundaram et al.,26 it is difficult to compare the performance of our features with that of other features in previous studies, due to the lack of common data sets, gold standards and the access to prior algorithms. Therefore, we chose the four well-known and widely used features (as described in Sec. 1) to be the baseline reference. We believe that the relative performances with and without inclusion of the new projection features reflect the value or potential of the new features for CADpolyp.
ACKNOWLEDGMENTS
This work was partially supported by NIH Grant Nos. CA082402 and CA120917 of the National Cancer Institute. Professor Hongbing Lu was supported by National Nature Science Foundation of China under Grant No. 6.772020. The authors would like to acknowledge the use of the Viatronix V3D-Colon Module, the helpful discussion with Dr. Chaijie Duan, PhD and Dr. Seth Mankes, MD, and the assistance from Dr. Hongyu Lu, PhD on data processing.
References
- American Cancer Society, Cancer Facts & Figures 2008 (American Cancer Society, Atlanta, 2008). [Google Scholar]
- Eddy D., “Screening for colorectal cancer,” Ann. Intern Med. 113, 373–384 (1990). [DOI] [PubMed] [Google Scholar]
- Gluecker T., Johnson C., Harmsen W., Offord K., Harris A., Wilson L., and Ahlquist D., “Colorectal cancer screening with CT colonography, colonoscopy, and double-contrast barium enema examination: Prospective assessment of patient perceptions and preferences,” Radiology 227(2), 378–384 (2003). 10.1148/radiol.2272020293 [DOI] [PubMed] [Google Scholar]
- Levin B., Brooks D., Smith R., and Stone A., “Emerging technologies in screening for colorectal cancer: CTC, immunochemical fecal occult blood tests, stool screening using molecular markers,” Ca-Cancer J. Clin. 53(1), 44–55 (2003). 10.3322/canjclin.53.1.44 [DOI] [PubMed] [Google Scholar]
- Pickhardt P., Choi J., Hwang I., Butler J., Puckett M., Hildebrandt H., Wong R., Nugent P., Mysliwiec P., and Schindler W., “Computed tomographic virtual colonoscopy to screen for colorectal neoplasia in asymptomatic adults,” N. Engl. J. Med. 349(23), 2191–2200 (2003). 10.1056/NEJMoa031618 [DOI] [PubMed] [Google Scholar]
- Bogoni L., Cathier P., Dundar M., Jerebko A., Lakare S., Liang J., Periaswamy S., Baker M., and Macari M., “Computer-aided detection (CAD) for CT colonography: A tool to address a growing need,” Br. J. Radiol. 78, S57–S62 (2005). 10.1259/bjr/25777270 [DOI] [PubMed] [Google Scholar]
- Summers R., Yao J., Pickhardt P., Franaszek M., Bitter I., Brickman D., Krishna V., and Choi R., “Computed tomographic virtual colonoscopy computer-aided polyp detection in a screening population,” Gastroenterology 129, 1832–1844 (2005). 10.1053/j.gastro.2005.08.054 [DOI] [PMC free article] [PubMed] [Google Scholar]
- Halligan S., Taylor S., Dehmeshki J., Amin H., Ye X., Tsang J., and Roddie M., “Computer-assisted detection for CT colonography: External validation,” Clin. Radiol. 61, 758–763 (2006). 10.1016/j.crad.2006.02.015 [DOI] [PubMed] [Google Scholar]
- Taylor S., Halligan S., Burling D., Roddie M., Honeyfield L., McQuillan J., Amin H., and Dehmeshki J., “Computer-assisted reader software versus expert reviewers for polyp detection on CT colonography,” AJR, Am. J. Roentgenol. 186, 696–702 (2006). 10.2214/AJR.04.1990 [DOI] [PubMed] [Google Scholar]
- Summers R., Beaulieu C., Pusanik L., Malley J., Jeffrey R., Glazer D., and Napel S., “Automated polyp detector for CT colonography: Feasibility study,” Radiology 216, 284–290 (2000). [DOI] [PubMed] [Google Scholar]
- Summers R., Johnson C., Pusanik L., Malley J., Youssef A., and Reed J., “Automated polyp detection at CT colonography: Feasibility assessment in a human population,” Radiology 219(1), 51–59 (2001). [DOI] [PubMed] [Google Scholar]
- Summers R., Yao J., and Johnson D., “CT colonography with computer-aided detection: Automated recognition of ileocecal valve to reduce number of false-positive detections,” Radiology 233, 266–272 (2004). 10.1148/radiol.2331031326 [DOI] [PubMed] [Google Scholar]
- Yao J., Miller M., Franaszek M., and Summers R., “Colonic polyp segmentation in CT colonography-based on fuzzy clustering and deformable model,” IEEE Trans. Med. Imaging 23(11), 1344–1352 (2004). 10.1109/TMI.2004.826941 [DOI] [PubMed] [Google Scholar]
- Iordanescu G. and Summers R., “Reduction of false positives on the rectal tube in computer-aided detection for CT colonography,” Med. Phys. 31(10), 2855–2862 (2004). 10.1118/1.1790131 [DOI] [PubMed] [Google Scholar]
- Li J., Uitert R., Yao J., Petrick N., Franaszek M., Huang A., and Summers R., “Wavelet method for CT colonography computer-aided polyp detection,” Med. Phys. 35(8), 3527–3538 (2008). 10.1118/1.2938517 [DOI] [PMC free article] [PubMed] [Google Scholar]
- Yoshida H. and Nappi J., “Three-dimensional computer-aided diagnosis scheme for detection of colonic polyps,” IEEE Trans. Med. Imaging 20(12), 1261–1274 (2001). 10.1109/42.974921 [DOI] [PubMed] [Google Scholar]
- Nappi J., Dachman A., MacEneaney P., and Yoshida H., “Computer-aided detection of polyps in CT colonography: Evaluation of volumetric features in differentiating polyps from false positives,” Int. Congr. Ser. 1230, 676–681 (2001). 10.1016/S0531-5131(01)00110-8 [DOI] [Google Scholar]
- Näppi J. and Yoshida H., “Feature-guided analysis for reduction of false positives in CAD of polyps for computed tomographic colonography,” Med. Phys. 30(7), 1592–1601 (2003). 10.1118/1.1576393 [DOI] [PubMed] [Google Scholar]
- Näppi J., Frimmel H., Dachman A., and Yoshida H., “Computerized detection of colorectal masses in CT colonography based on fuzzy merging and wall-thickening analysis,” Med. Phys. 31(4), 860–872 (2004). 10.1118/1.1668591 [DOI] [PubMed] [Google Scholar]
- Göktürk S., Tomasi C., Acar B., Beaulieu C., Paik D., Jeffrey R., Yee J., and Napel S., “A statistical 3-D pattern processing method for computer-aided detection of polyps in CT colonography,” IEEE Trans. Med. Imaging 20(12), 1251–1260 (2001). 10.1109/42.974920 [DOI] [PubMed] [Google Scholar]
- Acar B., Beaulieu C., Göktürk S., Tomasi C., Paik D., Jeffrey B., Yee J., and Napel S., “Edge displacement field-based classification for improved detection of polyps in CT colonography,” IEEE Trans. Med. Imaging 21(12), 1461–1467 (2002). 10.1109/TMI.2002.806405 [DOI] [PubMed] [Google Scholar]
- Paik D., Beaulieu C., Rubin G., Acar B., Jeffrey B., Yee J., Dey J., and Napel S., “Surface normal overlap: A computer-aided detection algorithm with application to colonic polyps and lung nodules in helical CT,” IEEE Trans. Med. Imaging 23(6), 661–675 (2004). 10.1109/TMI.2004.826362 [DOI] [PubMed] [Google Scholar]
- Kiss G., Cleynenbreugel J., Thomeer M., Suetens P., and Marchal G., “Computer-aided diagnosis in virtual colonography via combination of surface normal and sphere fitting methods,” Eur. Radiol. 12(1), 77–81 (2002). 10.1007/s003300101040 [DOI] [PubMed] [Google Scholar]
- Wang Z., Liang Z., Li L., Li X., Anderson J., and Harrington D., “Reduction of false positives by internal features for polyp detection in CT-based virtual colonoscopy,” Med. Phys. 32(12), 3602–3616 (2005). 10.1118/1.2122447 [DOI] [PMC free article] [PubMed] [Google Scholar]
- Zhu H., Duan C., Pickhardt P., Wang S., and Liang Z., “Computer-aided detection of colonic polyps with level set-based adaptive convolution in volumetric mucosa to advance CT colonography toward a screening modality,” Cancer Management and Research 1(1), 1–13 (2009). [DOI] [PMC free article] [PubMed] [Google Scholar]
- Sundaram P., Zomorodian A., Beaulieu C., and Napel S., “Colon polyp detection using smoothed shape operators: Preliminary results,” Med. Image Anal. 12, 99–119 (2008). 10.1016/j.media.2007.08.001 [DOI] [PubMed] [Google Scholar]
- Bielen D. and Kiss G., “Computer-aided detection for CT colonography: Update 2007,” Abdom. Imaging 32, 571–581 (2007). 10.1007/s00261-007-9293-2 [DOI] [PubMed] [Google Scholar]
- Yoshida H. and Nappi J., “CAD in CT colonography: Past, present, and future,” in Proceedings of the 11th International Conference of MICCAI, Workshop on Computational and Visualization Challenges in the New Era of Virtual Colonoscopy, 6 September 2008, New York, NY, pp. 15–21 (unpublished).
- Lu H., Zhang G., Wang T., Jiao C., Wang J., and Liang Z., “Computer-aided polyp detection based on 3D texture analysis for virtual colonoscopy,” in Proceedings of the 11th International Conference of MICCAI, Workshop on Computational and Visualization Challenges in the New Era of Virtual Colonoscopy, 6 September 2008, New York, NY, pp. 52–57 (unpublished).
- Suzuki K., Yoshida H., Nappi J., and Dachman A., “Massive-training artificial neural network (MTANN) for reduction of false positives in computer-aided detection polyps: Suppression of rectal tubes,” Med. Phys. 33(10), 3814–3824 (2006). 10.1118/1.2349839 [DOI] [PubMed] [Google Scholar]
- Suzuki K., Yoshida H., Nappi J., Armato S., and Dachman A., “Mixture of expert 3D massive-training ANNs for reduction of multiple types of false positives in CAD for detection of polyps in CT colonography,” Med. Phys. 35(2), 694–703 (2008). 10.1118/1.2829870 [DOI] [PubMed] [Google Scholar]
- Pickhardt P., Lee A., Taylor A., Michel S., Winter T., Shadid A., Meiners R., Chase P., Hinshaw J., Williams J., Prout T., Husain S., and Kim D., “Primary 2D versus primary 3D polyp detection at screening CT colonography,” AJR, Am. J. Roentgenol. 189, 1451–1456 (2007). 10.2214/AJR.07.2291 [DOI] [PubMed] [Google Scholar]
- Wan M., Dachille F., Kreeger K., Lakare S., Sato M., Kaufman A., Wax M., and Liang Z., “Interactive electronic biopsy for 3D virtual colonoscopy,” in Proceedings of SPIE Medical Imaging, 21 February 2001, San Diego, CA, Vol. 4321, pp. 483–488 (unpublished).
- Pickhardt P., “Translucency rendering in 3D endoluminal CT colonography: A useful tool for increasing polyp specificity and decreasing interpretation time,” AJR, Am. J. Roentgenol. 183, 429–436 (2004). [DOI] [PubMed] [Google Scholar]
- Wang S., Zhu H., Lu H., and Liang Z., “Volume-based feature analysis of mucosa for automatic initial polyp detection in virtual colonoscopy,” Int. J. CARS 3(1–2), 131–142 (2008). 10.1007/s11548-008-0215-8 [DOI] [PMC free article] [PubMed] [Google Scholar]
- Zhu H., Fan Y., Lu H., and Liang Z., “Improving the initial polyp candidate extraction for CT colonography,” Phys. Med. Biol. (submitted). [DOI] [PMC free article] [PubMed] [Google Scholar]
- Chang C. and Lin C., “LIBSVM: A library for support vector machines,” software available at http://www.csie.ntu.edu.tw/~cjlin/libsvm (2001).
- Smith L., “A tutorial on principal component analysis,” paper available online at http://www.cs.otago.ac.nz/cosc453/student_tutorials/principal_components.pdf (2002).
- Gonzalez R. and Woods R., Digital Image Processing, 2nd ed. (Pearson Education, Delhi, India, 2002). [Google Scholar]
- Liang Z. and Wang S., “An EM approach to MAP solution of segmenting tissue mixtures: A numerical analysis,” IEEE Trans. Med. Imaging 28(2), 297–310 (2009). 10.1109/TMI.2008.2004670 [DOI] [PMC free article] [PubMed] [Google Scholar]
- Wang S., Li L., Cohen H., Mankes S., Chen J., and Liang Z., “An EM approach to MAP solution of segmenting tissue mixture percentages with application to CT-based virtual colonoscopy,” Med. Phys. 35(12), 5787–5798 (2008). 10.1118/1.3013591 [DOI] [PMC free article] [PubMed] [Google Scholar]
- Pickhardt P. and Choi J., “Electronic cleansing and stool tagging in CT colonography: Advantages and pitfalls with primary 3D evaluation,” AJR, Am. J. Roentgenol. 181, 799–805 (2003). [DOI] [PubMed] [Google Scholar]
- Pickhardt P., Nugent P., Choi J., and Schindler W., “Flat colorectal lesions in asymptomatic adults: Implications for screening with CT virtual colonoscopy,” AJR, Am. J. Roentgenol. 183, 1343–1347 (2004). [DOI] [PubMed] [Google Scholar]
- Doshi T., Rusinak D., Halvorsen B., Rockey D., Suzuki K., and Dachman A., “CT colonography: False-negative interpretations,” Radiology 244, 165–173 (2007). 10.1148/radiol.2441061122 [DOI] [PubMed] [Google Scholar]
- Lostumbo A., Suzuki K., and Dachman A., “Flat lesions in CT colonography,” Abdom. Imaging (unpublished). [DOI] [PubMed] [Google Scholar]
- Park S., Lee S., Choi E., Kim S., Yang S., Kim J., and Ha H., “Flat colorectal neoplasms: Definition, importance, and visualization on CT colonography,” AJR, Am. J. Roentgenol. 188, 953–959 (2007). 10.2214/AJR.06.0436 [DOI] [PubMed] [Google Scholar]
- Yao J., Li J., and Summers R., “Employing topographical height map in colonic polyp measurement and false positive reduction,” Pattern Recogn. 42, 1029–1040 (2009). 10.1016/j.patcog.2008.09.034 [DOI] [PMC free article] [PubMed] [Google Scholar]
- Powell W., Approximate Dynamic Programming: Solving the Curses of Dimensionality (Wiley, New York, 2007). 10.1002/9780470182963 [DOI] [Google Scholar]
- Yao J., Summers R., and Hara A., “Optimizing the support vector machine (SVM) committee configuration in a colonic polyp CAD system,” in Proceedings of SPIE Medical Imaging, 13 February 2005, San Diego, CA, Vol. 5746, pp. 384–392 (unpublished).
- Zhao X., Zhu H., Wang S., and Liang Z., “Reduction of false positives by machine learning for computer-aided detection of colonic polyps,” Proceedings of SPIE Medical Imaging, 18 February 2009, Orlando, FL, pp. 72602N1–72602N8 (unpublished).
- Zhu H., Wang S., Fan Y., and Liang Z., “Eigenvalue-weighting and feature selection for computer-aided polyp detection in CT colonography,” in Proceedings of SPIE Medical Imaging, San Diego, CA, 2010. (unpublished).


