Abstract
Purpose: Pulmonary arterial hypertension (PAH) is a progressive vascular disease that results in high mortality and morbidity in sickle cell disease (SCD) patients. PAH diagnosis is invasive via right heart catheterization, but manual measurements of the main pulmonary artery (PA) diameters from computed tomography (CT) have shown promise as noninvasive surrogate marker of PAH. The authors propose a semiautomated computer-assisted diagnostic (CAD) tool to quantify the main PA size from pulmonary CT angiography (CTA).
Methods: A follow-up retrospective study investigated the potential of CT and image analysis to quantify the presence of PAH secondary to SCD based on PA size. The authors segmented the main pulmonary arteries using a combination of fast marching level sets and geodesic active contours from smoothed pulmonary CTA images of 20 SCD patients with proven PAH by right heart catheterization and 20 matched negative controls. From the PA segmentation, a Euclidean distance map was calculated and an algorithm based on fast marching methods was used to compute subvoxel precise centerlines of the PA trunk (PT) and main left∕right PA (PM). Maximum distentions of PT and PM were automatically quantified using the centerline and validated with manual measurements from two observers.
Results: The pulmonary trunk and main were significantly larger (p<0.001) in PAH∕SCD patients (33.73±3.92 mm for PT and 25.17±2.90 for PM) than controls (27.03±2.94 mm for PT and 20.62±3.06 for PM). The discrepancy was qualitatively improved when vessels’ diameters were normalized by body surface area (p<0.001). The validation of the method showed high correlation (mean R=0.9 for PT and R=0.91 for PM) and Bland–Altman agreement (0.4±3.6 mm for PT and 0.5±2.9 mm for PM) between CAD and manual measurements. Quantification errors were comparable to intraobserver and interobserver variability. CAD measurements between two different users were robust and reproducible with correlations of R=0.99 for both PT and PM and Bland–Altman agreements of −0.13±1.33 mm for PT and −0.08±0.84 mm for PM.
Conclusion: Results suggest that the semiautomated quantification of pulmonary artery has sufficient accuracy and reproducibility for clinical use. CT with image processing and extraction of PA biomarkers show great potential as a surrogate indicator for diagnosis or quantification of PAH, and could be an important tool for drug discovery and noninvasive clinical surveillance.
Keywords: pulmonary artery, pulmonary hypertension, sickle cell disease, biomarkers, computer-aided diagnosis
INTRODUCTION
Sickle cell disease (SCD) is an inherited hemoglobin disorder characterized by abnormal sickle-shaped red blood cells. The disease manifests itself through a variety of pulmonary complications, such as reduced blood flow and increased risk of thromboembolism within the pulmonary vessels.1, 2 Moreover, cardiovascular findings in SCD patients often include chronically elevated pulmonary artery pressures, which result in pulmonary arterial hypertension (PAH).3 Recent studies in SCD have associated PAH with high mortality and morbidity in SCD patients; roughly 75% of SCD patients develop PAH around the time of death.4 Approximately 1∕3 of adult SCD patients present signs of PAH,5, 6 often manifested by the remodeling of the pulmonary vasculature, including pruning or tapering of the blood vessels (large arterial trunk and abrupt transition from large to small arteries), ultimately leading to heart failure.
Today, right heart catheterization is the gold standard for the diagnosis and hemodynamic assessment of PAH, but it is invasive. Previous studies have investigated the role of medical imaging for noninvasive diagnosis and assessment of PAH.7, 8, 9, 10, 11, 12, 13, 14, 15, 16 These studies showed that manual measurements of main pulmonary artery (PA) size from chest radiography and computed tomography (CT) correlate well with PA pressures. Error and reproducibility analyses were not reported in the majority of these studies.7, 9, 10, 11, 12, 13, 14, 15 Recently, Revel, et al.17 retrospectively analyzed electrocardiographic-gated CT angiography (CTA) scans and found that the distensibility of the right pulmonary artery had good predictive value for PAH. While interobserver agreement showed good reproducibility, the accuracy of their method may be limited due to dependence on slice location, as measurements were manually performed in two-dimensional (2D) projection images. In general, manual measurements of PA are costly in time and effort, particularly for large data sets, often nonreproducible, and their 2D nature does not account for the 3D morphology and orientation of PA. These limitations present in earlier work motivate the need for accurate and reproducible analysis of pulmonary vessels using computer-aided diagnostic (CAD) tools for noninvasive assessment of vascular diseases, such as PAH. Medical imaging systems for pulmonary vasculature may also facilitate surgical planning, drug discovery and delivery, prognosis, and acute management of vascular disease.1
The segmentation of PA can be challenging due to its complicated vasculature, variable shape, motion artifacts, and proximity to other blood vessels that may hamper the vessel extraction. Extensive literature for the extraction of curvilinear structures and blood vessels in medical images exists18, 19, 20, 21, 22, 23, 24, 25, 26, 27 and a wide range of segmentation techniques have been used, notably including phase congruency,18 morphological operations,20, 23 region-growing,25 model-based techniques,26 fuzzy logic,22 snakes,24 image enhancement,27 eigendecomposition,21 and an edge-radius-symmetry transform.19
Recent work has been presented toward the computer-based analysis of the pulmonary artery, but the examples that use computed tomography (CT) are not numerous.28, 29, 30, 31, 32, 33, 34, 35, 36, 37, 38, 39, 40 Within these techniques, the segmentation methodology included thresholding,30 region-growing and front-propagation methods,29, 35, 40 mathematical morphology,33 multiscale filtering,37, 38 fuzzy methods,28, 32, 36 and deformable models.40 However, many of these techniques are ad hoc in practice. Moreover, these previous attempts were limited to vessel segmentation within the lungs and focused on pulmonary emboli and nodule detection in the pulmonary vascular tree. In conjunction with clinical studies on PAH development, the region of interest in our study is the main PA outside the lungs, which includes the pulmonary trunk (PT), and main left PA and main right PA, addressed as pulmonary main (PM). Although segmental branches were sometimes segmented, they were not specifically analyzed.
Relevant work to our study was proposed by Sebbe et al.41, 42 who segmented the main PA from contrast-enhanced CT using a slice-marching algorithm based on fast marching techniques. In addition to slice-marching, an a priori anatomical knowledge model based on a set of 3D parametric curves was registered to a target image in order to preserve vessel boundaries and eliminate leakage into nearby vessels, such as the aorta and vena cava. However, because their model of three-dimensional (3D) curves and set of reference points were created from a single patient, it did not fully address the variability in PA sizes and shapes, especially important in quantification of PAH. In our study, PA sizes vary dramatically between control and SCD∕PAH patients. Indeed, a large training database may be required to establish a robust model and library that can be applied to patient images. Kitasaka et al.43 also employed an a priori model of blood vessels based on B-splines to extract the aorta and PA from noncontrast chest CT. Extraction of the PA, however, suffers from undersegmentation and low accuracy when compared to manual segmentations. Finally, Lombaert et al.44 used a multilevel banded graph cut method to segment PA from CT data. However, their results focused on the speed and efficiency of the method without addressing the accuracy of the segmentation.
In this paper, we present a semiautomated tool to analyze pulmonary CTA, which uses level sets and geodesic active contours to segment the main PA. Once the vessel is segmented, its centerline is extracted using fast marching methods to create a map of diameter size along the length of the PA. The centerline algorithm allows a subvoxel precise measurement of the maximum diameters of the pulmonary trunk and pulmonary main. The CAD tool is then employed to retrospectively investigate the link between PA distention and diagnosis of pulmonary hypertension in sickle cell disease. This application establishes a computer-aided quantification of PAH in SCD patients and could facilitate better understanding of the pathophysiology and hemodynamics of PAH in SCD, and how to better care for these patients.
METHODS
Data and materials
Forty-eight pulmonary CTA studies were analyzed: 20 from patients with sickle cell anemia and related PAH ranging from mild to severe forms (proven by right heart catheterization); 20 from randomly selected patients without SCD or PAH as negative controls; and eight from randomly selected patients used for the training of parameters and not included in the statistical analysis. Scans with marked suboptimal enhancement in the arteries specifically noted in the radiological report were excluded. Controls were matched to cases on the basis of age and gender. Controls that had a primary diagnosis of lung pathology were not included in the study.
All pulmonary CTA data were collected using GE Lightspeed Ultra (GE Healthcare, Milwaukee, WI), Philips Mx8000 IDT 16 and Brilliance 64 (Philips Medical Systems, Cleveland, OH), and Siemens Definition (Siemens Medical Solutions, Malvern, PA). CTA images were acquired at a fixed tube voltage of 120 kVp. Tube current varied between 250 and 400 mA s. ISOVUE contrast agent was delivered at a rate of 4–5 cc∕s. Image resolution ranged from 0.63 to 0.88 mm in the axial view and 1–1.25 mm in slice thickness.
To validate the segmentation algorithm, two observers manually measured the diameters of the pulmonary trunk and the right and left pulmonary main for all cases. Observers were research interns trained to perform PA measurements by a board-certified experienced radiologist. Each observer was blinded to the patient diagnosis and the other available measurements. From CTA data, the images were searched axially for the maximum distension along the pulmonary trunk and the main left∕right pulmonary arteries. Vessel geometry was accounted by taking measurements at the maximum distension, perpendicular to the long axis of the corresponding vessel (PT or PM). Since only the enhanced regions were considered, measurements reflect the distension of the arterial lumen and do not include vessel wall thickness. The measurements were repeated once more in a blinded manner after three weeks by one of the observers. For CAD measurements, two users independently placed seed points to initialize the segmentation of the pulmonary artery and measure its size. In comparing the manual measurements between the same observer and between different observers, we use the terms intraobserver and interobserver, respectively. In comparing the CAD-derived diameter measurements between both users∕observers, we use the term inter-CAD user.
Pearson correlation coefficients were calculated between matched variables and paired Student’s t-tests were used to assess significance (95% confidence level) given the normal distribution of data. Comparisons were also assessed using the method of Bland and Altman.45 Unless otherwise indicated, data are presented as mean±standard deviation.
The implementation of the technique used Visual C++ 8.0 (Microsoft Corporation, Redmond, WA), OpenGL (SGI, Freemont, CA), and the Insight Segmentation and Registration Toolkit—ITK 2.8 (National Library of Medicine, Bethesda, MD).
Segmentation
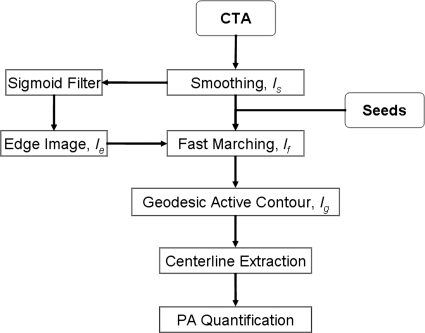
Figure 1 summarizes the main steps involved in the segmentation algorithm. The method is applied to 3D data; the term image used in the manuscript refers to a 3D volume. First, CTA data were smoothed using anisotropic diffusion to enhance the homogeneity of thoracic structures and ensure boundary preservation. The classic Perona–Malik anisotropy model was employed.46 During the diffusion process, smoother versions of the image (I) were computed iteratively. Iσ is the result of the convolution of I with a Gaussian of standard deviation σ. The resulting image (Is) provided stable edges over a large number of iterations (t) given that their gradient was larger than c.46
| (1) |
Figure 1.
Flowchart of the main steps involved in the segmentation and quantification of the main pulmonary artery.
The second stage of the method is the segmentation of pulmonary arteries, and this approach used a combination of fast marching and geodesic active contour level sets.47, 48 Level sets are surfaces that expand or contract, split or merge in the direction orthonormal to the surface. Their definition allows level sets to be adapted to the image conditions and by using knowledge of shape, curvature, and edge to segment incomplete data.
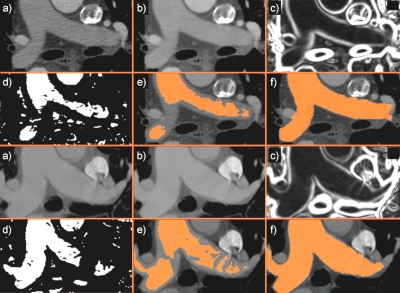
A fast marching level set was used to initialize the segmentation.47 The fast marching method assumed that the surface can only expand starting from the seed points provided by the user. Three seeds were placed in the pulmonary trunk at the level of the primary bifurcation, and in the right and left pulmonary main arteries, before the secondary bifurcation, as seen in Fig. 2a. The seed points also determined that the segmentation was bound to the area of interest that included the PA trunk and left and right main arteries. The speed of expansion from the seed points were constant and along the surface normal . The first segmentation given by the fast marching level set was If.
| (2) |
Figure 2.
The segmentation of pulmonary artery exemplified in a patient (top) and a matching control (bottom). (a) User-defined seed points placed in the trunk and pulmonary main initiate the segmentation; (b) the image was smoothed using anisotropic diffusion; (c) gradient map of smoothed image; (d) a sigmoid filter provides an edge image for (e) the fast marching level set segmentation; (f) the final 3D segmentation refined by geodesic active contours. For simplification, seed points are shown in the same axial slice, but they can be placed independently of each other.
The smoothed CT scan (Is) provided the feature image, while the sigmoid of the gradient of Is supplied an edge image (or speed function) Ie.
| (3) |
The values of α and β were estimated empirically from the training data using the 3D gradient image ∇Is. These values were calculated over the entire training set after eliminating outliers, and then used for the segmentation of patient and control images (test set). α was estimated as the minimum gradient magnitude along the vessel boundaries. β was estimated as the mean gradient magnitude inside the vessel. In practice, the value of α should be greater than β to ensure that the propagation front expands rapidly from the seeds and slows down as it arrives near the edges. Using independent training and test sets, we ensured that the parameter estimation was not overfitted to the test data.
A better-adapted level set based on geodesic active contours (GAC) was used to refine the fast marching segmentation.48 In deformable models, there are two types of forces that govern the evolution of the active contour: The internal forces within the surface, which keep the model smooth during the deformation, and the external forces from the image data, which attract the model toward edges. To initialize the model, we used the fast marching segmentation as input image (zero-level) into the geodesic active contour Ig. The weights w1 and w2 in Eq. 3 control, respectively, the speed s and attraction to edges; k represents the curvature. w1 and w2 were determined empirically from the training set. The semiautomatic estimations of the size of vessels from training data were compared to manual measurements on the same data set; the optimal combination of weights (that provided the highest correlation between measurements) was subsequently used to segment the patient and control data (test set).
| (4) |
| (5) |
Skeletonization
The method used to automatically calculate the arterial distention consisted of two steps: (i) Calculate the Euclidean distance map for the arteries, and (ii) compute the centerline of the vessels.49 From the level set segmentation, the subvoxel accurate Euclidean distance transform was computed in multiple passes using linear interpolation at the boundary voxels to determine the distance to the boundary followed by an algorithm similar to the Saito–Toriwaki distance transform method.50 The first pass was along the x-axis of the segmentation data set, where the voxels were traversed in scanline order. All subsequent voxels inside the artery were assigned values that incremented the previous scanline voxel value by the x-spacing. Upon completion, the scanline was again traversed in the opposite direction, now incrementally computing distance from the opposite boundary’s zero-crossing. The minimum of the forward and backward scanline passes was assigned to each voxel. Next, the data set was traversed in y-axis scanline order. For each voxel in the scanline, the true Euclidean distance cannot be larger than the distance recorded in the x-axis pass. For each buffer entry in the range ±(x-distance), the distance between the boundary intersection point and the circle center was computed using the Pythagorean theorem. The value assigned in the distance data set at the current voxel was the minimum of all of these computed distances and the previously assigned x-distance at the current voxel. The arteries were processed in the same way by repeating this procedure with the minimum distance from the xy-plane (xy-distance) and the distances assigned at the voxels within the sphere of radius ±(xy-distance).
To compute the 3D centerline, a subvoxel accurate skeletonization was used.49 The calculated Euclidean distance transform was used as a speed image in the fast marching propagation. The fast marching method is an efficient way to numerically evaluate the solution to the Eikonal equation
| (6) |
where T is the arrival function, F is the speed of evolution function, and Γ is the initial isosurface at time zero. The algorithm processed the voxels in a sorted order based on increasing values of T, while maintaining the candidates in a heap. This causes the algorithm to require a computation time of O(n log(n)). The implementation used in this paper is a discretization of the Eikonal equation
| (7) |
where and are values resulting from backward and forward difference calculations at point (i,j,k), respectively.
By solving the minimum-cost path problem, the path C(t):[0,∞)→Rn that minimizes the cumulative cost, from the start point S to the end point E in Rn was calculated. When the cost was solely a function of the position in the object domain, the minimum cumulative cost was defined as
| (8) |
where Csx is the set of all paths from S to , L is the distance from E to S along C, and H is the cost function. The solution for T also satisfied the Eikonal equation with . By using the distance field, a new cost function was calculated such that a minimum cost path exists between two points on the centerline,
| (9) |
where is the distance value at position and D is the maximum value in the distance field data set.
The resulting cost function was used as a speed image in the fast marching method propagation starting at the point with the largest distance from the boundary of the arteries, the global maximum point of the distance field. The fast marching method propagation had been augmented to calculate the geodesic distance from the starting point in addition to the time that was required for the propagation front to pass each point in the arteries’ segmentation, the time crossing map. The furthest geodesic point resulting from this fast marching method propagation was used as a start point of the centerline. The gradient descent method was used on the time crossing map.51 The remaining points of the centerline were determined by taking subvoxel steps along the path of the gradient descent. This process was repeated for each branch of the skeleton, but rather than using the single point of the global maximum distance from the object’s boundary as the start point for the augmented fast marching method, all points in the previously calculated branches were used as start points along with the original distance field. The method results in separate centerlines for the pulmonary trunk and pulmonary main vessels. From the centerline and distance transform, the maximum distension of the arteries at each step in the subvoxel accurate centerline was determined from the values stored at the skeleton locations in the distance transform field. The measurements are perpendicular to the centerline and do not depend on the location of the PA bifurcation.
RESULTS
Segmentation and quantification
Figure 2 shows an example of the segmentation steps employed by the algorithm, from the smoothed CTA image and seed-selection, computation of image features, and continuing with a first estimate of PA by fast marching level sets and the final segmentation of PA by geodesic active contours. As shown in the images, other vessel structures with similar intensities, such as the aorta and vena cava, were avoided in the segmentation.
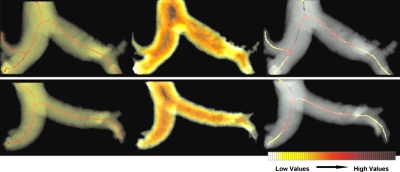
The segmentation parameters were estimated using training data. To compute the sigmoid, values of α=9 and β=7 were used. For GAC, w1 and w2 were 20 and 10, respectively. The skeletonization is exemplified in Fig. 3, along with the quantification of PA distension using Euclidean distance maps and centerlines of subvoxel precision. A distance heat map is shown alongside the centerline extraction.
Figure 3.
Centerline extraction in (a) patient and (b) matched control: (left) The 3D skeletons for the segmented PA; (center) the distance maps of the segmented arteries; (right) the map of vessel distensions along the centerline.
Observer and CAD performances
Tables 1, 2 present comparative statistical analyses for the measurements of the maximum diameters of PT and PM: Intraobserver, interobserver, manual (observer) vs CAD measurements, and inter-CAD user variability.
Table 1.
Statistical analysis for the segmentation of the pulmonary trunk comparing manual observer and CAD measurements. Pearson correlation coefficients, absolute differences between measurements, and p-values of the paired t-tests are shown. Data were normally distributed.
| Pulmonary trunk | p-value | ||
|---|---|---|---|
| Correlation | Difference (mm) | ||
| Intraobserver 1 | 0.94 | 1.29±1.12 | 0.02 |
| Intraobserver 2 | 0.88 | 2.11±1.53 | 0.05 |
| Interobserver | 0.92 | 1.53±1.4 | 0.2 |
| Observer 1-CAD | 0.93 | 1.48±1.09 | 0.1 |
| Observer 2-CAD | 0.88 | 2.17±1.49 | 0.05 |
| Inter-CAD user | 0.99 | 0.38±0.57 | 0.9 |
Table 2.
Statistical analysis for the segmentation of the pulmonary main comparing manual observer and CAD measurements. Pearson correlation coefficients, absolute differences between measurements, and p-values of the paired t-tests are shown. Data were normally distributed.
| Pulmonary main | p-value | ||
|---|---|---|---|
| Correlation | Difference (mm) | ||
| Intraobserver 1 | 0.93 | 1.06±0.88 | 0.6 |
| Intraobserver 2 | 0.87 | 1.56±1.47 | 0.02 |
| Interobserver | 0.92 | 1.25±0.86 | 0.8 |
| Observer 1-CAD | 0.92 | 1.13±1.05 | 0.06 |
| Observer 2-CAD | 0.91 | 1.26±0.91 | 0.9 |
| Inter-CAD user | 0.99 | 0.19±0.39 | 0.2 |
Manual intraobserver and interobserver agreement
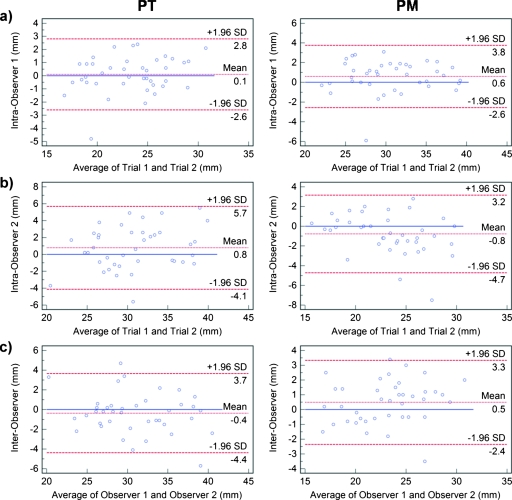
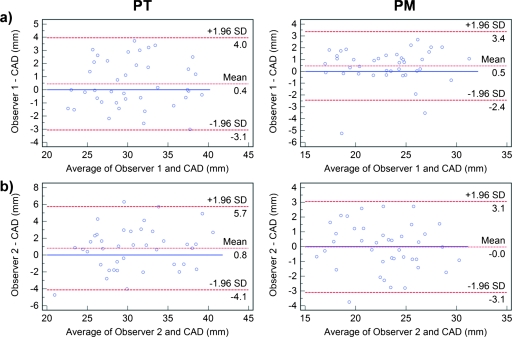
Correlations for intraobserver measurements of PT and PM showed high association between repeated manual measurements. However, there was significant difference (p=0.02) between the first and second measurements of PT for observer 1 and in repeated measurements of both PT (p=0.05) and PM (p=0.02) for observer 2. Bland–Altman plots for intraobserver and interobserver measurements are shown in Fig. 4 with submillimeter mean agreements for both PT and PM. However, the 95% limits of agreement varied between comparisons. For observer 1 measurements, they were approximately 6.4 mm for PT and 5.4 mm for PM. Intravariability for observer 2 showed wider limits of agreement of approximately 9.8 mm for PT and 7.9 mm for PM.
Figure 4.
Bland–Altman plots comparing intraobserver for (a) observer 1 and (b) observer 2, and (c) interobserver variability in measuring the pulmonary trunk (left) and pulmonary main (right). In each plot, the differences (in mm) are plotted against average measurements (in mm) of the corresponding two methods. Dashed lines represent the mean difference of the two methods, and the 95% limits of agreement (±1.96 SD). The solid line is the zero baseline.
There were no significant interobserver variability in measuring both PT and PM. Bland–Altman analysis (Fig. 4) showed the 95% limits of agreement spanning 8.1 mm for PT and 5.7 mm for PM.
Observer-CAD agreement
There were no significant differences between observer 1 and CAD measurements for PT and PM, or observer 2 and CAD PM measurements. The only significant difference occurred in the estimations of PT by observer 2 and CAD (p=0.05). Bland–Altman analysis (Fig. 5) showed for both observers that mean differences between the two methods were below 1 mm. There was a slight tendency of the CAD system to undersegment the vessels. The 95% limits of agreements for PT were 7.1 mm for observer 1 and CAD and 9.8 mm observer 2 and CAD. For PM, the limits of agreements were 5.8 mm for observer 1 and CAD and 6.2 mm observer 2 and CAD. Observer-CAD variability was comparable to the interobserver and intraobserver performances with no significant difference (p>0.1).
Figure 5.
Bland–Altman plots comparing (a) observer 1 vs CAD and (b) observer 2 vs CAD variability in measurement of the pulmonary trunk (left) and pulmonary main (right). In each plot, the differences (in mm) are plotted against average measurements (in mm) of the corresponding two methods. Dashed lines represent the mean difference of the two methods, and the 95% limits of agreement (±1.96 SD). The solid line is the zero baseline.
The locations of the manual and CAD measurements were compared. The mean differences in the slice locations for PT and PM were 1.16±1 and 1.34±1.31 mm, respectively, with a slice thickness varying between 1 and 1.25 mm. These differences were not significant (p=0.15 for PT and p=0.11 for PM).
Semiautomated inter-CAD user agreement
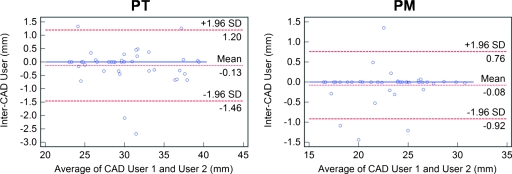
Inter-CAD measurements of PT and PM (Fig. 6) showed mean and 95% limits of agreement of −0.13±1.33 and −0.08±0.84, respectively. Compared to the intraobserver and interobserver differences, inter-CAD variability was significantly smaller (p<0.001).
Figure 6.
Bland–Altman plots comparing inter-CAD user variability in measurement of the pulmonary trunk (left) and pulmonary main (right). In each plot, the differences (in mm) are plotted against average measurements (in mm) of the corresponding two methods. Dashed lines represent the mean difference of the two methods, and the 95% limits of agreement (±1.96 SD). The solid line is the zero baseline.
PA size and PAH
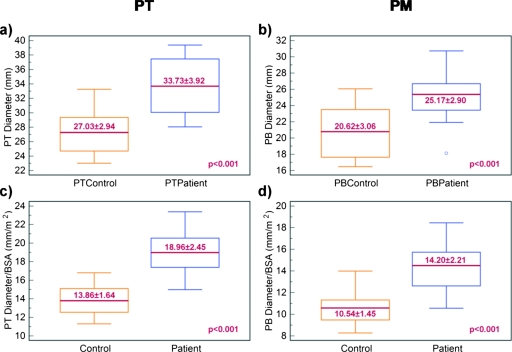
Box plots in Fig. 7 show size comparisons of PT and PM in controls and patients. PT and PM were significantly larger (p<0.001) in diameter in SCD patients with PAH as compared to controls. The maximum distension of PT of SCD patients was 33.73±3.92 mm, while that of controls was 27.03±2.94 mm. The maximum diameter along the PM of SCD patients was 25.17±2.90 mm, while that of controls was 20.62±3.06 mm.
Figure 7.
Box plots for control vs patient data. (a) The maximum diameter of the pulmonary trunk was significantly larger in the patient population compared to controls. (b) The largest diameter of the pulmonary main vessels was significantly larger in the patient population compared to controls. A significant separation between patients and controls was also remarked after normalization to BSA for both (c) PT and (d) PM.
To address the variation in body vascularization and PA size with patient size, the PA diameters were normalized to the value of the body surface area (BSA) which was calculated using the formula of DuBois and DuBois.52 The box plots in Figs. 7c, 7d show that PA diameters normalized by BSA were significantly different in controls and SCD patients (p<0.001 for both PT and PM). A qualitative analysis of Fig. 7 suggests that BSA normalization improves the separation between SCD patients and controls.
DISCUSSION
In recent years, pulmonary CTA has become the imaging stethoscope and window into pulmonary diseases. The procedure is minimally invasive and results in high spatial resolution images of pulmonary vasculature. CTA may be particularly attractive to investigate PAH, given that the diagnosis of PAH currently relies on invasive right heart catheterization. Image processing has the potential to support and extend the interpretation of CTA data and offer a standardized, semiautomated, robust, and reproducible analysis.
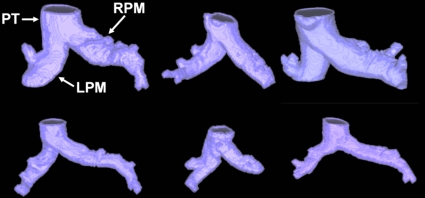
In this study, a semiautomated CAD tool was developed to segment the main PA from CTA images. The segmentation of the artery allowed extracting a subvoxel precise centerline to quantify the PA size. The use of an implicit representation of object boundaries by the segmentation and skeletonization methods allowed active contours to cover the complex structure of PA, without making topological assumptions. Figure 8 exemplifies the heterogeneity of vessel morphology in six cases.
Figure 8.
Reconstructed pulmonary arteries from six cases show the variability in structure among patients (top row) and controls (bottom row). All images are presented at the same scale. PT indicates the pulmonary trunk, while RPM and LPM the right and left pulmonary main.
Results of the CAD tool were accurate and robust on a database of normal and pathological pulmonary cases acquired using different CT scanners, at different resolutions. Similar variability between CAD-observers and interobservers and intraobservers (p>0.1) suggests that the semiautomated quantifications of PA are clinically relevant. Moreover, there was a significant improvement in measurement reproducibility (p<0.001) when two users performed CAD measurements of PA compared to manual interobserver and intraobserver performances, suggesting potential for enhanced standardization and uniformity.
Bland–Altman analyses with data from manual segmentations showed that the CAD tool accurately measured maximum distension in the pulmonary trunk and pulmonary main with little systematic bias. In general, CAD-derived diameters slightly underestimated (mean<0.8 mm) manual measurements of PT, while CAD measurements of PM showed no single relationship with manual measurements from two observers (mean<0.5 mm). The 95% limits of agreement between CAD and manual measurements were comparable to the standard deviation of PA diameters. In a clinical context, deviations of this magnitude are comparable to interobserver and intraobserver performances and unlikely to affect the diagnosis of PAH in SCD patients.
To examine the possible causes of clinically important variations in manual observer and CAD performances, the radiological reports and CTA scans of the outliers on the Bland–Altman plots were analyzed. In the majority of cases, discrepancies were due to reduced image quality from patient obesity (with poor definition of PT boundaries) or motion and imaging artifacts. Motion artifacts mainly affected the trunk manual measurements, while beam hardening originating from the vena cava interfered with manual measurements of the right PM diameter. An additional cause for interobserver variability was the fact that observers did not measure maximum PA distension at the same slice∕location or orientation. Factors that promoted outliers included unusual twisting and bending of the arteries. Outliers in the inter-CAD user analyses were attributed mainly to variations in user-input seed placements, particularly in the trunk. However, maximum inter-CAD user errors were 2.7 mm for PT and 1.5 mm for PM.
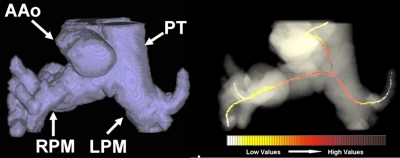
The PA skeletonization was robust to atypical errors in the vessel segmentation, which can suffer from leakage due to suboptimal enhancement, motion artifacts, or poor vessel edge definition. The computation of the centerline allowed it to follow the longest vasculature in the region defined by the user-placed seeds, in this case the main pulmonary artery. Figure 9 exemplifies a poorly segmented artery with a correctly estimated centerline.
Figure 9.
Example of an atypical segmentation error in a patient pulmonary artery (left). Portions of nearby vessels (e.g., ascending aorta) were captured. However, the centerline skeletonization around the PA junction was not affected by the segmentation leakage and correctly computed the maximum distension in the trunk and pulmonary main (right). PT indicates the pulmonary trunk, while RPM and LPM the right and left pulmonary main.
In this retrospective study of secondary PAH in SCD patients, we investigated the role of CAD measurements of PA sizes at the pulmonary trunk and pulmonary main for the assessment of PAH. SCD patients had significantly larger PA diameters compared to matched controls (p<0.001). The separation between patients and controls was qualitatively improved when PA diameters were adjusted for body surface area (p<0.001).
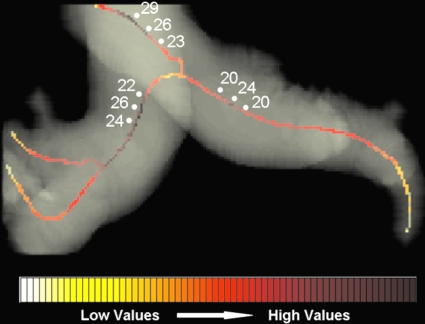
CAD-measured mean diameters of PT∕PM were 27∕20.6 and 33.7∕25.1 for normal and hypertensive patients, respectively, and in agreement with PA lumen diameters observed in previous reports using CT images.8, 9, 10, 11, 12, 16, 17 Table 3 presents comparative measurements of PA distensions between our study and previous reports for normal and PAH patients. However, these studies on CT-based PA assessment in PAH relied exclusively on manual measurements, which are often unreliable and irreproducible. Manual measurements of artery size are subjective, based on slice location and vessel orientation, and typically do not fully account for the 3D structure of the artery, as they use 2D projection views. Figure 10 illustrates that a small shift along the centerline can induce errors larger than 20% in quantifying PT and PM.
Table 3.
Comparative measurements of pulmonary artery distensions at the trunk and pulmonary main between our semiautomated study and previous manual reports (Refs. 8, 9, 10, 11, 12, 14, 15, 16, 53).
| Pulmonary trunk | Pulmonary main | |||
|---|---|---|---|---|
| Normal (mm) | PAH (mm) | Normal (mm) | PAH (mm) | |
| Our study | 27 | 33.7 | 20.6 | 25.1 |
| Edwards, et al.a | 27.2 | 33.2 | ⋯ | ⋯ |
| Grubstein, et al.b | ⋯ | 35.5 | ⋯ | 26.3 |
| Heinrich, et al.c | ⋯ | 39 | ⋯ | ⋯ |
| Karazincir, et al.d | 26.6 | ⋯ | ⋯ | ⋯ |
| Kuriyama, et al.e | 24.2 | 33.2 | 20.9 | 28.8 |
| Sanal, et al.f | ⋯ | >28.6 | ⋯ | ⋯ |
| Tan, et al.g | 27.2 | 35 | 19 | 25 |
| Haimovici, et al.h | 28 | 33 | 21 | 25 |
| Guthaner, et al.i | 27.2 | ⋯ | 15–25 | 25–38 |
Figure 10.
Heat map along the centerline demonstrates how diameter measurements can vary around the regions of maximum distension. The variations can be as large as 20%–25% of the vessel size.
We proposed an objective, robust, and reproducible method to measure PA diameters to minimize measuring variability and clinical subjectivity in PAH. The technique has several advantages over previous computer-assisted methods of PA segmentation.41, 42, 43, 44 Adding a subvoxel precise centerline extraction to the segmentation, we were able to accurately quantify the PA distension. The initialization of the method is simple, robust to user-input variation, and the use of multiple seed points sped up the segmentation. Our technique generally avoided leakage into similar-intensity vessels, such as encountered in Ref. 41 prior to the addition of model-driven active contours.42 Furthermore, the centerline computation was not hampered by leakage, in the few cases where segmentation errors occurred.
Our method was validated on 40 cases, whereas Refs. 43, 42 constructed their models from only three and six CT images, respectively. Error analysis of our CAD tool also showed accurate and reproducible segmentations with maximum errors in the measurement of diameters of 6 mm for PT and 4 mm for PM. This is in contrast to Ref. 43 where the PA was undersegmented, and the maxima of the minimum distances between manual and automated methods ranged from 8.2 voxels at a resolution of 0.625×0.625×2.0 mm3 to as high as 23.3 voxels at a resolution of 0.625×0.625×1.0 mm3. Finally, no prior assumptions to blood vessel morphology were made in our work, which suggests that this method would be applicable beyond our immediate patient data set.
Possible sources of error in our analysis could be related to the abnormal control population, due to the lack of CTA scans of healthy volunteers. Our control cases were selected from patients with CTA data without pulmonary pathology as a primary diagnosis, but the exact incidence of pulmonary pathology in these control patients undergoing CTA is undefined. Nevertheless, statistical analysis showed significant difference between our patient and control populations.
The change in blood flow patterns and pruning of the pulmonary artery will also be analyzed for further discrimination between SCD patients and controls for a more comprehensive analysis of the relationships of imaging biomarkers to the degree of PAH. Porcine models are currently being studied for prospective validation of the relationship between PA size, pulsatility, and pulmonary hemodynamics. The use of cardiac-gated CT-pulmonary angiography in the porcine models could help study heart function during onset of PAH. These studies may also be useful in analyzing multiple theoretical imaging features which could have hemodynamic correlates, such as vessel elasticity or quantification of vascular pruning.
CONCLUSION
A semiautomatic tool is presented using CT angiography for the CAD of PAH in SCD. Level sets were adopted for the segmentation and skeletonization of the main PA. Error analysis between manual and automated measurements showed in qualitative and quantitative fashion that our method resulted in robust, accurate, and reproducible measurements of maximum distension in the pulmonary trunk and main left and right pulmonary arteries. The CAD findings indicated a link between measurements of PA size and SCD-associated PAH, with SCD patients having significantly larger trunk and main diameters than controls. In conclusion, CT with image processing shows great potential as a surrogate indicator of pulmonary arterial hypertension in sickle cell disease and could be an important tool for noninvasive clinical surveillance.
ACKNOWLEDGMENTS
This work was supported in part by the Intramural Research Program of the National Institutes of Health, Clinical Center and National Heart, Lung and Blood Institute. The authors would like to thank Babak J. Orandi for helping to collect data.
References
- Gladwin M. T. et al. , “Pulmonary hypertension as a risk factor for death in patients with sickle cell disease,” N. Engl. J. Med. 350(9), 886–895 (2004). 10.1056/NEJMoa035477 [DOI] [PubMed] [Google Scholar]
- Gladwin M. T. and Vichinsky E., “Pulmonary complications of sickle cell disease,” N. Engl. J. Med. 359(21), 2254–2265 (2008). 10.1056/NEJMra0804411 [DOI] [PubMed] [Google Scholar]
- Haywood L. J., “Cardiovascular function and dysfunction in sickle cell anemia,” J. Natl. Med. Assoc. 101(1), 24–30 (2009). [DOI] [PubMed] [Google Scholar]
- Anthi A. et al. , “Hemodynamic and functional assessment of patients with sickle cell disease and pulmonary hypertension,” Am. J. Respir. Crit. Care Med. 175(12), 1272–1279 (2007). 10.1164/rccm.200610-1498OC [DOI] [PMC free article] [PubMed] [Google Scholar]
- Sachdev V. et al. , “Diastolic dysfunction is an independent risk factor for death in patients with sickle cell disease,” J. Am. Coll. Cardiol. 49(4), 472–479 (2007). 10.1016/j.jacc.2006.09.038 [DOI] [PMC free article] [PubMed] [Google Scholar]
- Machado R. F. et al. , “N-terminal pro-brain natriuretic peptide levels and risk of death in sickle cell disease,” JAMA, J. Am. Med. Assoc. 296(3), 310–318 (2006). 10.1001/jama.296.3.310 [DOI] [PubMed] [Google Scholar]
- Bush A., Gray H., and Denison D. M., “Diagnosis of pulmonary hypertension from radiographic estimates of pulmonary arterial size,” Thorax 43(2), 127–131 (1988). 10.1136/thx.43.2.127 [DOI] [PMC free article] [PubMed] [Google Scholar]
- Edwards P. D., Bull R. K., and Coulden R., “CT measurement of main pulmonary artery diameter,” Br. J. Radiol. 71(850), 1018–1020 (1998). [DOI] [PubMed] [Google Scholar]
- Grubstein A. et al. , “Computed tomography angiography and high resolution computed tomography signs of pulmonary hypertension: Correlation with clinical and hemodynamic parameters,” Israel Medical Association Journal 10(2), 117–120 (2008). [PubMed] [Google Scholar]
- Heinrich M. et al. , “CT scan findings in chronic thromboembolic pulmonary hypertension: Predictors of hemodynamic improvement after pulmonary thromboendarterectomy,” Chest 127(5), 1606–1613 (2005). 10.1378/chest.127.5.1606 [DOI] [PubMed] [Google Scholar]
- Karazincir S. et al. , “CT assessment of main pulmonary artery diameter,” Diagnostic and Interventional Radiology 14(2), 72–74 (2008). [PubMed] [Google Scholar]
- Kuriyama K., Gamsu G., and Stern R. G., “CT-determined pulmonary artery diameters in predicting pulmonary hypertension,” Invest. Radiol. 19(1), 16–22 (1984). 10.1097/00004424-198401000-00005 [DOI] [PubMed] [Google Scholar]
- Matthay R. A., Schwarz M. I., and J. H.Ellis, Jr., “Pulmonary artery hypertension in chronic obstructive pulmonary disease: Determination by chest radiography,” Invest. Radiol. 16(2), 95–100 (1981). 10.1097/00004424-198103000-00003 [DOI] [PubMed] [Google Scholar]
- Sanal S. et al. , “Prediction of moderate or severe pulmonary hypertension by main pulmonary artery diameter and main pulmonary artery diameter∕ascending aorta diameter in pulmonary embolism,” Cardiology 14(5), 213–214 (2006). 10.1097/01.crd.0000181619.87084.8b [DOI] [PubMed] [Google Scholar]
- Tan R. T. et al. , “Utility of CT scan evaluation for predicting pulmonary hypertension in patients with parenchymal lung disease,” Chest 113(5), 1250–1256 (1998). 10.1378/chest.113.5.1250 [DOI] [PubMed] [Google Scholar]
- Ackman Haimovici J. B. et al. , “Relationship between pulmonary artery diameter at computed tomography and pulmonary artery pressures at right-sided heart catheterization,” Acad. Radiol. 4(5), 327–334 (1997). 10.1016/S1076-6332(97)80111-0 [DOI] [PubMed] [Google Scholar]
- Revel M. P. et al. , “Pulmonary hypertension: ECG-gated 64-section CT angiographic evaluation of new functional parameters as diagnostic criteria,” Radiology 250(2), 558–566 (2009). 10.1148/radiol.2502080315 [DOI] [PubMed] [Google Scholar]
- Linguraru M. G. et al. , “A biologically inspired algorithm for microcalcification cluster detection,” Med. Image Anal. 10(6), 850–862 (2006). 10.1016/j.media.2006.07.004 [DOI] [PubMed] [Google Scholar]
- Chabat F. et al. , “ERS transform for the automated detection of bronchial abnormalities on CT of the lungs,” IEEE Trans. Med. Imaging 20(9), 942–952 (2001). 10.1109/42.952731 [DOI] [PubMed] [Google Scholar]
- Aykac D. et al. , “Segmentation and analysis of the human airway tree from three-dimensional x-ray CT images,” IEEE Trans. Med. Imaging 22(8), 940–950 (2003). 10.1109/TMI.2003.815905 [DOI] [PubMed] [Google Scholar]
- Sato Y. et al. , “Three-dimensional multi-scale line filter for segmentation and visualization of curvilinear structures in medical images,” Med. Image Anal. 2(2), 143–168 (1998). 10.1016/S1361-8415(98)80009-1 [DOI] [PubMed] [Google Scholar]
- Yan C., Hirano S., and Hata Y., “Extraction of blood vessel in CT angiography image aided by fuzzy logic,” in Proceedings of ICSP, 2000, Vol. 2, pp. 926–929.
- Zana F. and Klein J. C., “Segmentation of vessel-like patterns using mathematical morphology and curvature evaluation,” IEEE Trans. Image Process. 10(7), 1010–1019 (2001). 10.1109/83.931095 [DOI] [PubMed] [Google Scholar]
- Toledo R.et al. , “Tracking elongated structures using statistical snakes,” in Proceedings of the IEEE Computer Society Conference on Computer Vision and Pattern Recognition, 2000, Vol. 1, pp. 157–162.
- Yim P. J., Choyke P. L., and Summers R. M., “Gray-scale skeletonization of small vessels in magnetic resonance angiography,” IEEE Trans. Med. Imaging 19(6), 568–576 (2000). 10.1109/42.870662 [DOI] [PubMed] [Google Scholar]
- Krissian K. et al. , “Model-based detection of tubular structures in 3D images,” Comput. Vis. Image Underst. 80(2), 130–171 (2000). 10.1006/cviu.2000.0866 [DOI] [Google Scholar]
- Li Q., Sone S., and Doi K., “Selective enhancement filters for nodules, vessels, and airway walls in two- and three-dimensional CT scans,” Med. Phys. 30(8), 2040–2051 (2003). 10.1118/1.1581411 [DOI] [PubMed] [Google Scholar]
- Masutani Y., MacMahon H., and Doi K., “Computerized detection of pulmonary embolism in spiral CT angiography based on volumetric image analysis,” IEEE Trans. Med. Imaging 21(12), 1517–1523 (2002). 10.1109/TMI.2002.806586 [DOI] [PubMed] [Google Scholar]
- Bülow T.et al. , “Automatic extraction of the pulmonary artery tree from multi-slice CT data,” in Progress in Biomedical Optics and Imaging—Proceedings of SPIE, San Diego, CA, 2005, Vol. 5746, 730.
- Pichon E.et al. , “A novel method for pulmonary emboli visualization from high-resolution CT images,” in Proceedings of SPIE—The International Society for Optical Engineering, San Diego, CA, 2004, Vol. 5367, 161.
- Williams J. and Wolff L., “Analysis of the pulmonary vascular tree using differential geometry based vector fields,” Comput. Vis. Image Underst. 65(2), 226–236 (1997). 10.1006/cviu.1996.0571 [DOI] [Google Scholar]
- Agam G., Armato S. G., and Wu C. H., “Vessel tree reconstruction in thoracic CT scans with application to nodule detection,” IEEE Trans. Med. Imaging 24(4), 486–499 (2005). 10.1109/TMI.2005.844167 [DOI] [PubMed] [Google Scholar]
- Pisupati C.et al. , “Tracking 3-D pulmonary tree structures,” in Proceedings of the IEEE Workshop on Mathematical Methods in Biomedical Image Analysis, San Francisco, CA, 1996, 160–169.
- Zhou C. et al. , “Automatic multiscale enhancement and segmentation of pulmonary vessels in CT pulmonary angiography images for CAD applications,” Med. Phys. 34(12), 4567–4577 (2007). 10.1118/1.2804558 [DOI] [PMC free article] [PubMed] [Google Scholar]
- Yi J. and Ra J. B., “A locally adaptive region growing algorithm for vascular segmentation,” Int. J. Imaging Syst. Technol. 13(4), 208–214 (2003). 10.1002/ima.10059 [DOI] [Google Scholar]
- Kaftan J. N.et al. , “Fuzzy pulmonary vessel segmentation in contrast enhanced CT data,” in Progress in Biomedical Optics and Imaging—Proceedings of SPIE, San Diego, CA, 2008, Vol. 6914, 69141Q.
- Shikata H., Hoffman E. A., and Sonka M., “Automated segmentation of pulmonary vascular tree from 3D CT images,” in Proceedings of the SPIE International Symposium on Medical Imaging, 2004, Vol. 5369, 107.
- Zhou C. et al. , “Computer-aided detection of pulmonary embolism in computed tomographic pulmonary angiography (CTPA): Performance evaluation with independent data sets,” Med. Phys. 36(8), 3385–3396 (2009). 10.1118/1.3157102 [DOI] [PMC free article] [PubMed] [Google Scholar]
- Raghupathi L. and Lakare S., “A hybrid lung and vessel segmentation algorithm for computer aided detection of pulmonary embolism,” in Progress in Biomedical Optics and Imaging-Proceedings of SPIE, Lake Buena Vista, FL, 2009, Vol. 7260, 726033.
- Peters J.et al. , “Segmentation of the heart and major vascular structures in cardiovascular CT images,” in Progress in Biomedical Optics and Imaging—Proceedings of SPIE, San Diego, CA, 2008, Vol. 6914, 691417.
- Sebbe R.et al. , “Pulmonary arteries segmentation and feature extraction through slice marching,” in Proceedings of the 14th PRORISC Workshop on Circuits Systems and Signal Processing, 2003.
- Sebbe R.et al. , “Segmentation of opacified thorax vessels using model-driven active contour,” in Annual International Conference of the IEEE Engineering in Medicine and Biology-Proceedings, Shanghai, China, 2005, 2535–2538. [DOI] [PubMed]
- Kitasaka T.et al. , “Automated extraction of aorta and pulmonary artery in mediastinum from 3d chest x-ray CT images without contrast medium,” in Proceedings of SPIE Medical Imaging, 2002, Vol. 4684, 1496.
- Lombaert H.et al. , “A multilevel banded graph cuts method for fast image segmentation,” in Proceedings of the IEEE International Conference on Computer Vision, Beijing, China, 2005, 259–265.
- Bland J. M. and Altman D. G., “Statistical methods for assessing agreement between two methods of clinical measurement,” Lancet 1(8476), 307–310 (1986). [PubMed] [Google Scholar]
- Perona P. and Malik J., “Scale-space and edge detection using anisotropic diffusion,” IEEE Trans. Pattern Anal. Mach. Intell. 12(7), 629–639 (1990). 10.1109/34.56205 [DOI] [Google Scholar]
- J. A., Sethian, Level Set Methods and Fast Marching Methods (Cambridge University Press, Cambridge, UK, 1999). [Google Scholar]
- Caselles V., Kimmel R., and Sapiro G., “Geodesic active contours,” Int. J. Comput. Vis. 22(1), 61–79 (1997). 10.1023/A:1007979827043 [DOI] [Google Scholar]
- Van Uitert R. and Bitter I., “Subvoxel precise skeletons of volumetric data based on fast marching methods,” Med. Phys. 34(2), 627–638 (2007). 10.1118/1.2409238 [DOI] [PubMed] [Google Scholar]
- Saito T. and Toriwaki J. I., “New algorithms for Euclidean distance transformation of an n-dimensional digitized picture with applications,” Pattern Recogn. 27(11), 1551–1565 (1994). 10.1016/0031-3203(94)90133-3 [DOI] [Google Scholar]
- Deschamps T. and Cohen L. D., “Fast extraction of minimal paths in 3D images and applications to virtual endoscopy,” Med. Image Anal. 5(4), 281–299 (2001). 10.1016/S1361-8415(01)00046-9 [DOI] [PubMed] [Google Scholar]
- DuBois D. and DuBois E. F., “A formula to estimate the approximate surface area if height and weights be known,” Arch. Intern. Med. 17, 863–871 (1916). [Google Scholar]
- Guthaner D. F., Wexler L., and Harell G., “CT demonstration of cardiac structures,” AJR, Am. J. Roentgenol. 133(1), 75–81 (1979). [DOI] [PubMed] [Google Scholar]


