

Abstract
Background and purpose:
δ-Aminolevulinic acid (ALA) is used in cancer patients for photodynamic diagnosis or therapy. Oral administration of ALA has been used in patients with prostate and bladder cancer. The present aim was to investigate the mechanism of intestinal absorption of ALA and its transport via the amino acid transporter SLC36A1.
Experimental approach:
In vitro investigations of ALA affinity for and uptake via SLC36A1 and SLC15A1 were performed in Caco-2 cell monolayers. Interaction of ALA with SLC15A1 was investigated in MDCK/SLC15A1 cells, whereas interactions with SLC36A1 were investigated in COS-7 cells transiently expressing SLC36A1.
Key results:
ALA inhibited SLC36A1-mediated l-[3H]Pro and SLC15A1-mediated [14C]Gly-Sar uptake in Caco-2 cell monolayers with IC50 values of 11.3 and 2.1 mM respectively. In SLC36A1-expressing COS-7 cells, the uptake of [14C]ALA was saturable with a Km value of 6.8 ± 3.0 mM and a Vmax of 96 ± 13 pmol·cm−2·min−1. Uptake of [14C]ALA was pH and concentration dependent, and could be inhibited by glycine, proline and GABA. In a membrane potential assay, translocation of ALA via SLC36A1 was concentration dependent, with a Km value of 3.8 ± 1.0 mM. ALA is thus a substrate for SLC36A1. In Caco-2 cells, apical [14C]ALA uptake was pH dependent, but Na+ independent, and completely inhibited by 5-hydroxy-l-tryptophan and l-4,4′-biphenylalanyl-l-proline.
Conclusions and implications
ALA was a substrate for SLC36A1, and the apical absorption in Caco-2 cell was only mediated by SLC36A1 and SLC15A1. This advances our understanding of intestinal absorption mechanisms of ALA, as well as its potential for drug interactions.
Keywords: δ-aminolevulinic acid, hPAT1 (SLC36A1), hPEPT1 (SLC15A1), Gly-Sar, intestinal absorption, drug delivery
Introduction
Intestinal absorption of dietary nitrogen across the luminal membrane occurs by the concerted action of amino acid and di/tri-peptide transporters. The proton-coupled di/tri-peptide transporter, SLC15A1, seems to be the only intestinal carrier for di/tri-peptides (Nielsen et al., 2002, 2005). Several amino acid transporters for α-amino acids exist, but in intestinal cells, SLC36A1 is the only proton-coupled amino acid transporter (Broer, 2008; Thwaites and Anderson, 2006, 2007). SLC36A1 is an absorptive intestinal transporter for small zwitterionic α-amino acids such as proline (Pro), glycine (Gly) and alanine (Ala) (Chen et al., 2003; Thwaites et al., 1995b), whereas SLC15A1 is a proton-coupled absorptive intestinal transporter for di/tri-peptides (Ganapathy and Leibach, 1983). SLC36A1 mRNA expression has been detected in most parts of the human gastrointestinal tract with maximal expression in tissues from the small intestine (Chen et al., 2003; Anderson et al., 2004). Likewise, SLC15A1 mRNA expression peaks in the human small intestine with only limited expression in the colon (Hilgendorf et al., 2007; Meier et al., 2007). Beside the role as nutrient transporters, SlC36A1 and SLC15A1 have been shown to have pharmacological relevance as drug carriers. Drug substances such as vigabatrin, d-cycloserine, GABA and gaboxadol are transported via SLC36A1 in various in vitro models (Thwaites et al., 1995a, 2000; Abbot et al., 2006; Larsen et al., 2008). In vivo, we have recently suggested that the high oral bioavailability observed for gaboxadol in dogs is mediated by intestinal absorption via SLC36A1 (Larsen et al., 2009). SLC15A1 has also been established as an important carrier in pharmacology, because it transports β-lactam antibiotics such as penicillins and cephalosporins (Bretschneider et al., 1999), bestatin (Inui et al., 1992) and amino acid prodrugs of acyclovir and ganciclovir (Beauchamp et al., 1992; de Vrueh et al., 1998; Sugawara et al., 2000).
Recently, Van Zeebroeck et al. (2009) identified di/tri-peptides as inhibitors of substrate transport via the general amino acid permease, Gap1, found in yeast. Gap1 is also a transporter for GABA (Andre et al., 1993). This stimulated us to investigate if dipeptidomimetics, such as δ-aminolevulinic acid (ALA), or dipeptides could inhibit substrate transport via SLC36A1, and if there is a substrate overlap between SLC36A1 and SLC15A1 (see Table 1 for an overview of substrates). ALA is a δ-amino acid, but because it is a substrate for SLC15A1, it is also a dipeptidomimetic, and hence of special interest (Doring et al., 1998a). Loss of the carbonyl group (C=O) from the structure of ALA (Table 1) results in GABA, which has been identified as a substrate for SLC36A1 (Thwaites et al., 2000), but not for SLC15A1 (Doring et al., 1998a). The minimal structural requirement for substrate recognition by SLC15A1 has been suggested to be compounds with a four CH2 unit separation of the charged amino group and the carboxylic acid (Doring et al., 1998b), whereas Boll et al. (2003) suggested that for a murine slc36a1 substrate, the maximal separation tolerated between the charged amino and carboxyl groups is only two CH2 units, as in GABA.
Table 1.
Structures of the test compounds used in the present study along with affinities reported for SLC36A1 and SLC15A1
| Name | Structure | Affinity (mM) | |
|---|---|---|---|
| SLC36A1 | SLC15A1 | ||
| Gly | 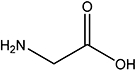 |
9.9 | NA |
| Sar | 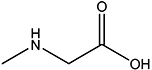 |
1.8 | NA |
| l-Pro | 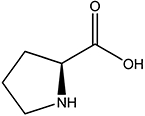 |
2.0 | NA |
| GABA | 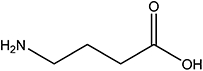 |
3.1 | NA |
| ALA | 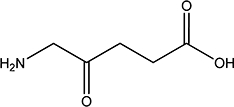 |
NI | 0.4 |
| Gly-Sar | 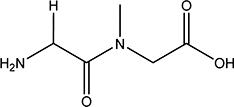 |
NI | 0.7 |
| Gly-Sar-Sar | 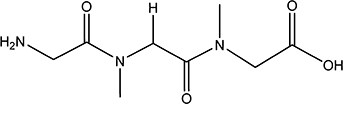 |
NI | 1.6 |
Values were taken from Fei et al., 1994; Doring et al., 1998a; Nielsen et al., 2001a; Andersen et al., 2006; Larsen et al., 2008.
NA, no affinity; NI, not investigated.
Based on these structural considerations and the pharmacological relevance of SLC36A1 and SLC15A1, the present aim was to investigate the mechanism of intestinal absorption of ALA and its transport via SLC36A1. ALA was shown to inhibit apical substrate uptake via SLC36A1, as well as SLC15A1, in Caco-2 cells. ALA was not only an inhibitor of uptake, but was also translocated via SLC36A1 in transfected cells. We thus identified ALA as a novel substrate for SLC36A1. Furthermore, we show that in Caco-2 cells, only SLC36A1 and SLC15A1 are involved in ALA uptake.
Methods
In this paper, drug and molecular target nomenclature follows Alexander et al., (2008).
Compound selection
The basis for selecting the test compounds (Gly, Sar, Pro, GABA, ALA, Gly-Sar and Gly-Sar-Sar) used in the present study is briefly mentioned here (see also Table 1). We used Pro as a prototypic substrate of SLC36A1 (Thwaites et al., 1993; Chen et al., 2003; Metzner et al., 2004). Similarly, we used Gly-Sar as a standard substrate for SLC15A1 (Addison et al., 1972). ALA (a non-hydrolyzable dipeptidomimetic of Gly-Gly), Gly-Sar and Gly-Sar-Sar were selected as they have unequivocally been identified as substrates for SLC15A1 (Fei et al., 1994; Doring et al., 1998a; Andersen et al., 2006). Furthermore, Gly-Sar and Gly-Sar-Sar are enzymatically stable in the presence of Caco-2 cells (Addison et al., 1972; Andersen et al., 2006). This prevents artefacts arising from compound degradation, as the constituent amino acids (i.e. Gly and Sar) are substrates for SLC36A1. Gly, Sar, Pro and GABA were selected as substrates for SLC36A1 (Chen et al., 2003). The investigated compounds provide a progressive separation of the positively charged amino group from the negatively charged carboxylate group (i.e. from Gly to Gly-Sar-Sar) (Table 1). The affinity of a SLC15A1 substrate is suggested to be of high affinity if Km < 0.5 mM (Brandsch et al., 2004), whereas SLC36A1 substrates generally have lower affinities (Km values around 2–15 mM). Therefore, the concentration of test compounds used in the experiments was generally 10 mM for SLC15A1 investigations, and 30 mM for SLC36A1 investigations. To investigate the relative contribution of SLC36A1 and SLC15A1 of the total ALA uptake in Caco-2 cells, inhibition studies were performed. The inhibitor for SLC36A1-mediated ALA uptake chosen was 5-hydroxy-l-tryptophan (5-HTP), and the competitive inhibitor for SLC15A1-mediated transport was l-4,4′-biphenylalanyl-l-proline (Bip-Pro) (Metzner et al., 2005; Knutter et al., 2007).
Cell culture
Protocols for culturing of Caco-2 cells were as previously described (Nielsen et al., 2001a; Larsen et al., 2008). Caco-2 cells of passages 23 through 31 were seeded onto Transwell inserts (1.12 cm2, 0.4 µm pore size, 105 cells per insert), and experiments were conducted at days 21–28 after seeding. Before initiation of experiments, the barrier properties of the Caco-2 monolayers were assessed by transepithelial electrical resistance (TEER) measured at room temperature (20°C) in a tissue resistance measurement chamber (EndOhm) with a voltmeter (EVOM), both of which were from World Precision Instruments (Sarasota, FL, USA). TEER values were always above 290 Ω·cm2. MDCK cells stably expressing SLC15A1 or the empty transfection vector (pcDNA3.1) were seeded in culture flasks and passaged in Dulbecco's modified Eagle's medium (DMEM) supplemented with 10% fetal bovine serum, 100 U·mL−1 penicillin, 100 µg·mL−1 streptomycin, 1% l-glutamine, 1% non-essential amino acids and 0.3 mg·mL−1 geneticin. MDCK/SCL15A1 or /pcDNA3.1 cells were seeded on Falcon Black 96-well plates with clear bottoms at a density of 2.104 cells per well, and used in the FLIPR membrane potential assay 3–4 days after seeding. COS-7 cells were seeded in culture flasks, and passaged in DMEM supplemented with 10% fetal bovine serum, 100 U·mL−1 penicillin, 100 µg·mL−1 streptomycin, 1% l-glutamine and 1 mM sodium pyruvate. All cell cultures were grown in a 5% CO2–95% O2 atmosphere at 37°C, and the culture media were replaced every second or third day.
SLC36A1 subcloning and transfection
In order to transfect SLC36A1 into the mammalian cell line COS-7, SLC36A1 was subcloned from pSPORT1-hPAT1 into the pcDNA3.1 vector. The coding sequence of SLC36A1 including a large 3′ untranslated region, was cut from the pSPORT1 vector using SalI followed by a Klenow treatment, and then NotI. pcDNA3.1 was digested with EcoRV and NotI, and SLC36A1 was ligated into the vector. The entire insert was sequenced in order to verify the orientation, and the open reading frame was identical to SLC36A1 (NCBI accession no. NM_078483). COS-7 cells were transfected using TransIT-COS Transfection Kit following the protocol supplied by the manufacturer. Prior to transfections, confluent cells growing in monolayers were suspended in culture media at a concentration of 2.75 × 10⁵ cells·mL−1. For experiments in either 24- or 96-well plate format, 300 or 50 ng per well DNA (pcDNA3.1 or pcDNA3.1/SLC36A1), and 1 or 0.15 µL per well transfection reagent was mixed with 30 or 5 µL per well of serum-free DMEM, and incubated for 15 min at 20°C. Subsequently, this mixture was added to the cell suspension, and immediately afterwards the cells were dispensed into 24- or 96-well plates, 500 or 80 µL per well respectively. Cells were used for experiments 40–48 h after transfection.
Inhibition of apical uptake of SLC36A1 and SLC15A1 substrates in Caco-2 cells
The ability of the test compounds to inhibit the apical uptake of the SLC36A1 substrate l-[3H]Pro and the SLC15A1 substrate [14C]Gly-Sar in Caco-2 cell monolayers was measured as previously described (Nielsen et al., 2001b; Larsen et al., 2008). In all experiments, Hanks's balanced salt solution (HBSS) buffer (in mM: CaCl2, 1.3; MgCl, 0.49; MgSO4, 0.41; KCl, 5.3; KH2PO4, 0.44; NaCl, 138; Na2HPO4, 0.34; NaHCO3, 4.5) supplemented with 0.05% BSA (hereafter denoted HBSS+) applied to the basolateral side was buffered with 10 mM HEPES, and adjusted to pH 7.4. HBSS+ applied to the apical side was buffered with 10 mM MES, and adjusted to pH 6.0 after the addition of the test compound. The osmolarity of the solutions was 0.286–0.350 osmol·L−1, which we have previously shown will not affect the uptake rate of Pro (Larsen et al., 2008).
Apical uptake experiments were initiated by adding fresh apical HBSS+ containing 13 nM (1 µCi·mL−1) l-[3H]Pro and 30 mM test compound, or 18 µM (1 µCi·mL−1) [14C]Gly-Sar and 10 mM test compound. The uptake was measured for 5 min, and terminated by washing the monolayers three times with ice-cold HBSS. The polycarbonate filters were cut from the Transwell supports; 2 mL Ultima Gold scintillation liquid was added, and the radioactivity was quantified by scintillation counting on a Packard TriCard liquid scintillation counter (Meriden, CT, USA). The ability of 30 mM ALA to inhibit the apical uptake of the SLC36A1 substrate [3H]GABA (14 nM, 0.5 µCi·mL−1), [14C]MeAIB (9 µM, 0.5 µCi·mL−1) or [14C]Gly (6 µM, 0.5 µCi·mL−1) was also determined by a similar method. The concentration-dependent inhibition of the apical uptake of l-[3H]Pro and [14C]Gly-Sar caused by ALA, as well as the ability of ALA to inhibit 50% of the apical uptake (the IC50 value) was measured as described earlier using increasing concentrations of ALA (0.01–300 mM).
The FLIPR membrane potential assay for investigating translocation via SLC36A1 and SLC15A1
The ability of SLC36A1 and SLC15A1 to translocate the test compounds was investigated using the FLIPR membrane potential assay, as described by Faria et al. (2004). This is a fluorescence-based assay, where the distribution of the fluorescence probe across the plasma membrane is dependent on the potential of the cell. Upon translocation via the proton-coupled transporters SLC36A1 and SLC15A1, the membrane potential decreases and more probe enters the cell. In the cell, the probe will bind to intracellular proteins and lipids, and cause an increase in the fluorescence signal. An increase in fluorescence is thus used as a surrogate marker of electrogenic substrate translocation via SLC36A1 and SLC15A1, where the change in fluorescence is proportional to the translocation rate. We have verified that the probe signal is non-saturable at the conditions reported here (see Supporting Information).
MDCK/SLC15A1, MDCK/pcDNA3.1 or COS-7 cells transfected with either pcDNA3.1 or SLC36A1 were seeded on Falcon Black 96-well plates with clear bottoms as described earlier. On the day of the experiment, the culture media were aspirated, and the cells were incubated with 50 µL blue membrane potential loading buffer for 30 min at 37°C to allow probe loading. The loading buffer was prepared by dissolving 0.55 mg·mL−1 blue membrane potential probe in either HBSS+ buffer containing 10 mM MES, pH adjusted to 6.0 (for experiments on MDCK cells), or Na+-free HBSS+ buffer (in mM: CaCl2, 1.3; KCl, 5.4; KH2PO4, 0.4; MgCl2, 0.5; MgSO4, 0.4; C5H14ClNO, 137.5; K2HPO4, 0.34; d-glucose, 5.56; containing 0.05% BSA) containing 10 mM MES with pH adjusted to 6.0 (for experiments in COS-7 cells). Na+-free HBSS+ was used in order to avoid involvement of any sodium-coupled transporters endogenously expressed in COS-7 cells. The cells were placed in a NOVOstar microplate reader (BMG Laboratory Technologies, Offenburg, Germany) at 37°C. The emission at 590 nm, caused by excitation at 544 nm, was measured every 0.2 s before and up to 80 s after the addition of 50 µL test compounds (compounds were dissolved in the appropriate loading buffer to a concentration twice the assay concentration). For representative curves showing change in fluorescence measured for Pro and ALA, see Supporting Information. In order to estimate the SLC15A1- or SCL36A1-specific translocation, the corrected change in fluorescence was calculated by subtracting the average maximal change in fluorescence measured in mock-transfected cells (ΔFav,mock) from the maximal change in fluorescence measured in MDCK/SLC15A1 or COS-7/SLC36A1 (ΔF; see Eqn 1). Furthermore, the corrected change in fluorescence was related to a positive control (i.e. the change in fluorescence measured by the addition of 20 mM Pro in case of COS-7/SLC36A1, or 20 mM Gly-Sar in case of MDCK/SLC15A1), giving a relative change in fluorescence (ΔF*) as shown in Eqn 1.
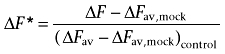 |
(1) |
[14C]ALA uptake in COS-7/SLC36A1 cells
COS-7 cells were transfected with SLC36A1 or the empty transfection vector (pcDNA3.1, mock), and then seeded on 24-well plates as described earlier. Then, 40–48 h after transfection, the culture media were aspirated, and cells were equilibrated for 10 min in pre-warmed Na+-free HBSS+ buffer containing 10 mM HEPES, with pH adjusted to 7.4. The uptake study was initiated by adding fresh Na+-free HBSS+ supplemented with 10 mM MES, with pH adjusted to 6.0, containing increasing concentrations of ALA (1–30 mM), as well as 9 µM (0.5 µCi·mL−1) [14C]ALA. Preliminary experiments showed that the uptake of l-[3H]Pro in SLC36A1-transfected COS-7 cells was linear for at least 30 min, thus uptake of [14C]ALA was measured for 20 min and terminated by washing the cells twice with ice-cold HBSS. The cells were detached by adding 150 µL 0.2% Triton-X to the wells, and incubating for 20 min at 37°C. Following detachment of the cell layers, the cell suspension was transferred to scintillation vials containing 2 mL Ultima Gold scintillation liquid. The amount of radioactivity was quantified by scintillation counting on a Packard TriCard liquid scintillation counter. In order to analyse the SCL36A1-specific uptake, the DPM obtained in pcDNA3.1-transfected cells was subtracted from the DPM obtained in the SLC36A1-transfected cells prior to uptake rate analysis.
[14C]ALA uptake at pH 7.4 or in the presence of test compounds was measured as described earlier using Na+-free HBSS+ buffer containing 10 mM HEPES, with pH adjusted to 7.4, or Na+-free HBSS+ supplemented with 10 mM MES, with pH adjusted to 6.0, containing 30 mM test compound instead of increasing concentrations of ALA.
Apical [14C]ALA uptake in Caco-2 cells
The apical uptake of [14C]ALA (9 µM, 0.5 µCi·mL−1) in Caco-2 cells was measured essentially as described earlier. The pH and sodium dependency was determined by measuring the apical uptake in HBSS+ or Na+-free HBSS+ containing either 10 mM MES, with pH adjusted to 6.0, or 10 mM HEPES, with pH adjusted to 7.4. The basolateral side was buffered with HBSS+ or Na+-free HBSS+ containing 10 mM HEPES, with pH adjusted to 7.4. The apical uptake of either 0.5 mM ALA (containing 9 µM [14C]ALA, 0.5 µCi·mL−1) or 25 mM ALA (containing 9 µM [14C]ALA, 0.5 µCi·mL−1) was measured in HBSS+ containing 10 mM MES, with pH adjusted to 6.0, in the absence or presence of 10 mM 5-HTP, 0.5 mM Bip-Pro or 10 mM 5-HTP and 0.5 mM Bip-Pro. The uptake of [14C]ALA at a total concentration of 0.5 or 25 mM was corrected for the amount of ALA present in the extracellular fluid, using [3H]mannitol (0.5 µCi·mL−1) as a marker of the extracellular volume.
Data analysis
The IC50 value of ALA was the concentration at which the apical uptake of Pro or Gly-Sar, U, was reduced to 50% of the control value. The IC50 value was determined by fitting the data to Eqn 2, giving a sigmoidal dose–inhibition curve:
| (2) |
U is the specific cellular uptake of Pro or Gly-Sar (0–100%) at concentration [I] of the inhibitor, in this case ALA. Umin is the minimal uptake of Pro or Gly-Sar (at the highest value of [I]), and Umax is the control uptake ([I]= 0), both given as % values.
The relative change in fluorescence (ΔF*, see Eqn 1), caused by Gly-Sar, Pro or ALA as a function of substrate concentration, was fitted to a Michaelis–Menten type equation:
 |
(3) |
where ΔF* is the SLC15A1- or SLC36A1-specific change in fluorescence recorded after the addition of a compound relative to the SLC15A1- or SLC36A1-specific change in fluorescence recorded after the addition of 20 mM Pro in case of COS-7/SLC36A1, or 20 mM Gly-Sar in case of MDCK/SLC15A1 (dimensionless), ΔF*max is the maximal relative change in fluorescence (dimensionless), Km is the Michaelis–Menten constant (mM) and S is the concentration of Gly-Sar, Pro or ALA (mM).
The uptake rate of ALA as a function of the substrate concentration was fitted to a Michaelis–Menten type equation:
 |
(4) |
where V is the uptake rate (pmol·cm−2·min−1), Vmax is the maximal uptake rate (pmol·cm−2·min−1), Km is the Michaelis–Menten constant (mM), and S is the concentration of ALA (mM). All data fitting was done using GraphPad Prism (version 4.03; San Diego, CA, USA).
In order to estimate the relative contribution of SLC36A1 and SLC15A1 to the total uptake of ALA in Caco-2 cells, the following assumptions were made. The apical uptake of ALA is only mediated by SLC36A1 and SLC15A1, and 5-HTP and Bip-Pro can, under our experimental conditions, be considered as an inhibitor and a competitive inhibitor of only SLC36A1 and SLC15A1 (Metzner et al., 2005; Knutter et al., 2007) respectively. The total uptake rate of ALA is thus given by the following expression:
 |
(5) |
As there are no Km or Vmax values available for the separate transport of ALA via SLC36A1 and SLC15A1 in Caco-2 cells, the IC50 values for ALA obtained in Caco-2 cells in the present study are used as estimates of the Km values. The maximal transport capacity of ALA via SLC36A1 and SLC15A1 is estimated to be 5.0 and 1.9 nmol·min−1·cm−2, respectively, similar to the Vmax values obtained for Pro and Gly-Sar uptake in Caco-2 cells grown under similar conditions (Nielsen et al., 2003; Larsen et al., 2008).
Using these assumptions, the relative contribution of SLC36A1 and SLC15A1 to the total apical uptake of ALA is 37% via SLC36A1, and 63% via SLC15A1 at a concentration of 0.5 mM ALA at the apical chamber, and 66% via SLC36A1 and 34% via SLC15A1 at a concentration of 25 mM ALA at the apical chamber. At 100 mM ALA, SLC36A1 would thus account for approximately 71% of the total apical uptake in Caco-2 cell monolayers.
Statistical analysis
Isotope uptake experiments were performed in triplicate (N= 3) in each cell passage using at least three different passages (n= 3). FLIPR membrane potential experiments were performed in quadruplicate (N= 4) for each cell passage using at least three different passages (n= 3). Values are given as mean ± SEM. Statistical analysis was performed in GraphPad Prism software, version 4.03. Differences between means were analysed using the one-way anova followed by Dunnett's multiple comparison test in case of comparing mean versus control, and Bonferroni's multiple comparison test in case of comparing pairs of means. Difference between mean and zero was analysed using a one sample t-test. The following levels of significance were assigned: P < 0.05, P < 0.01 or P < 0.001.
Materials
The chemicals were from Sigma-Aldrich (St Louis, MO, USA) unless otherwise stated. Gly-Sar (G3127) from Sigma-Aldrich is according to the supplier's ‘certificate of analysis’ 100% pure based on thin layer chromatography. When we validated the Gly-Sar from Sigma, we did not find any detectable Gly or Sar impurities using thin layer chromatography with Sar, Gly and Gly-Sar standards, and by using a Biochrom 30 Amino Acid Analyser (Biochrom Ltd, Cambridge, UK), we found 0.1% Gly with no detectable amounts of Sar. l-Glutamine, geneticin, penicillin and streptomycin were obtained from Invitrogen (Taastrup, Denmark), while fetal bovine serum was from Biotech Line (Slangerup, Denmark). Potassium chloride, potassium dihydrogen phosphate and d-glucose were purchased from Merck KGaA (Darmstadt, Germany). HBSS with calcium and magnesium was from Gibco, Invitrogen (Paisley, UK), and H-Gly-Sar-Sar-OH was purchased from BaChem AG (Budebdorf, Germany). Bip-Pro was a generous gift from Dr Matthias Brandsch (Biozentrum of the Martin-Luther-University Halle-Wittenberg, Saxony-Anhalt, Germany) (Knutter et al., 2007). DMEM was obtained from Sigma-Aldrich (Broenby, Denmark). Caco-2 and COS-7 cells were obtained from American Type Culture Collection (Manassas, VA, USA), and MDCK cell lines stably expressing SLC15A1 or empty vector were a generous gift from Doris A. Wall (Biopharmaceutics R&D, Bristol-Myers Squibb Pharmaceutical Research Institute, New Brunswick, NJ, USA) (Herrera-Ruiz et al., 2004). pSPORT1-hPAT1 was a generous gift from Dr Vadivel Ganapathy (Medical College of Georgia, Augusta, GA, USA) (Chen et al., 2003). Cell culture plastic ware was obtained from Corning Life Sciences (Wilkes Barre, PA, USA) except from Falcon Black 96-well plates with clear bottoms that were obtained from BD Biosciences (Franklin Lakes, NJ, USA). l-[2,3,4,5-3H]-proline (Pro; 75 Ci·mmol−1), α-[1-14C]-methylaminoisobutyric acid (MeAIB; 58.8 mCi·mmol−1, γ-[2,3-3H(N)]-aminobutyric acid (GABA; 35 Ci·mmol−1) and d-[1-3H(N)]-mannitol (11.7 Ci·mmol−1) were purchased from PerkinElmer (Boston, MA, USA). [Glycine-1-14C]-glycylsarcosine (Gly-Sar; 56 mCi·mmol−1, 98% pure, contains 2.2 ± 0.01% of the total radioactivity as [14C]Gly) was from GE-Healthcare (Freiburg, Germany), [14C(U)]-glycine (Gly; 87 mCi·mL−1) was from Larodan Fine Chemicals AB (Malmö, Sweden) and [4-14C]-5-ALA hydrochloride (55 mCi·mmol−1) was purchased from American Radiolabeled Chemicals (St Louis, MO, USA). TransIT-COS Transfection Kit was purchased from Mirus Bio Corporation (Madison, WI, USA). Ultima Gold scintillation liquid was from PerkinElmer. Blue membrane potential probe was purchased from Molecular Devices (Sunnydale, CA, USA).
Results
Characterization of apical uptake of the SLC36A1 substrate l -[3H]Pro and the SLC15A1 substrate [14C]Gly-Sar in Caco-2 cell monolayers in the presence of test compounds
The apical uptake of the SLC36A1 substrate l-[3H]Pro in Caco-2 cell monolayers was investigated in the presence of 30 mM test compound. The apical l-[3H]Pro uptake was significantly decreased in the presence of Gly, Sar, Pro and GABA (Figure 1A). Surprisingly, 30 mM ALA was also able to inhibit the SLC36A1-mediated apical uptake of l-[3H]Pro in Caco-2 cell monolayers, whereas 30 mM Gly-Sar-Sar did not (Figure 1A). The apical uptake of l-[3H]Pro was significantly reduced to 67% of the control uptake in the presence of 30 mM Gly-Sar (n= 5, P < 0.01). The apical uptake of the SLC15A1 substrate [14C]Gly-Sar was not significantly inhibited by 10 mM of Gly, Sar, Pro or GABA (Figure 1B). As expected, the apical uptake of [14C]Gly-Sar was inhibited by 10 mM of ALA, Gly-Sar and Gly-Sar-Sar to approximately 10–20% of the uptake in the absence of inhibitor (Figure 1B). Thus, ALA is capable of inhibiting substrate transport via SLC36A1 and SLC15A1.
Figure 1.
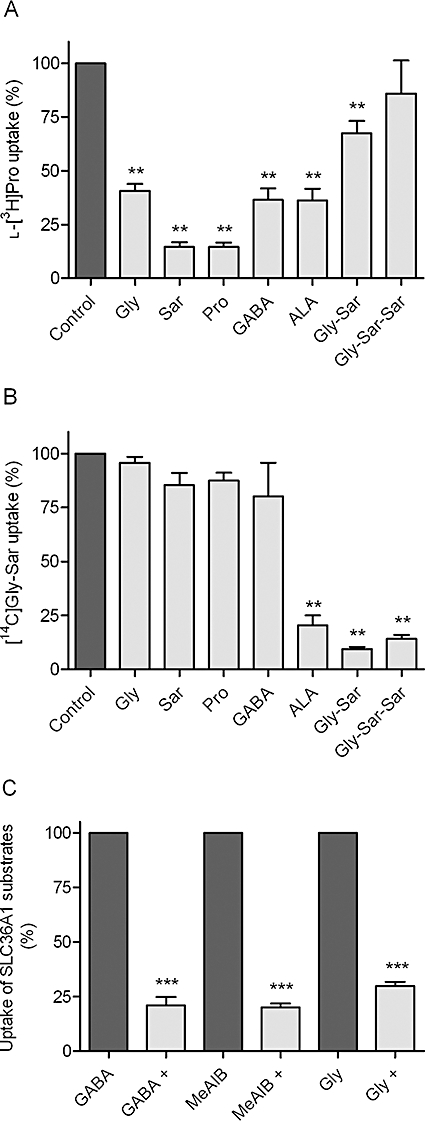
Inhibition of apical uptake of SLC15A1 or SLC36A1 substrates in Caco-2 cells. All compounds were dissolved in HBSS+ containing 10 mM MES; pH adjusted to 6.0 and added to the apical side; HBSS+ at the basolateral side contained 10 mM HEPES, and pH was adjusted to 7.4. Apical uptake was measured for 5 min. (A) The apical uptake of the SLC36A1 substrate l-[3H]Pro (13 nM) was measured in the absence or presence of 30 mM test compound. The uptake measured in the absence of inhibitor was taken as 100% (control). Each bar represents the mean ± SEM of three to five different passages (n= 3–5). One-way anova showed significant (P < 0.0001) differences between the means. **P < 0.01 significantly different from control. (B) The apical uptake of the SLC15A1 substrate [14C]Gly-Sar (18 µM) was measured in the absence or presence of 10 mM test compound. The uptake measured in the absence of inhibitor was taken as 100% (control). Each bar represents the mean ± SEM of three different passages (n= 3). One-way anova showed significant (P < 0.0001) differences between the means **P < 0.01 significantly different from control. (C) The apical uptake of the SLC36A1 substrate [3H]GABA (GABA, 14 nM), [14C]MeAIB (MeAIB, 9 µM) or [14C]Gly (Gly, 6 µM) was measured in the absence or presence of 30 mM ALA (denoted by +). The uptake measured in the absence of ALA was taken as 100%. Each bar represents the mean ± SEM of three different passages (n= 3). One-way anova showed significant (P < 0.0001) differences between the means. ***P < 0.001 significantly different from the uptake measured in the absence of ALA.
ALA inhibits the apical uptake of SLC36A1 substrates in Caco-2 cells
In order to further investigate the ability of ALA to inhibit SLC36A1-mediated substrate transport, the apical uptake of SLC36A1 substrates [3H]GABA, [14C]MeAIB and [14C]Gly was investigated in Caco-2 cells in the absence and presence of 30 mM ALA. ALA was able to inhibit the apical uptake of these SLC36A1 substrates by 70–80% (Figure 1C). This indicates that ALA interacts with the substrate binding site of SLC36A1.
ALA inhibits the apical uptake of l -[3H]Pro and [14C]Gly-Sar in Caco-2 cell monolayers in a concentration-dependent manner
In a subsequent series of experiments, the ability of ALA to inhibit, concentration dependently, the apical uptake of l-[3H]Pro or [14C]Gly-Sar was investigated. ALA inhibited the apical uptake of l-[3H]Pro in a concentration-dependent manner with an IC50 value of 11.3 mM (logIC50 of 1.05 ± 0.128) (Figure 2A). The apical uptake of [14C]Gly-Sar was also concentration dependently inhibited by ALA with an IC50 value of 2.1 mM (logIC50 of 0.327 ± 0.078) (Figure 2B). This strongly indicates that ALA is competing with both l-[3H]Pro and [14C]Gly-Sar on the exterior binding site of the transporters.
Figure 2.
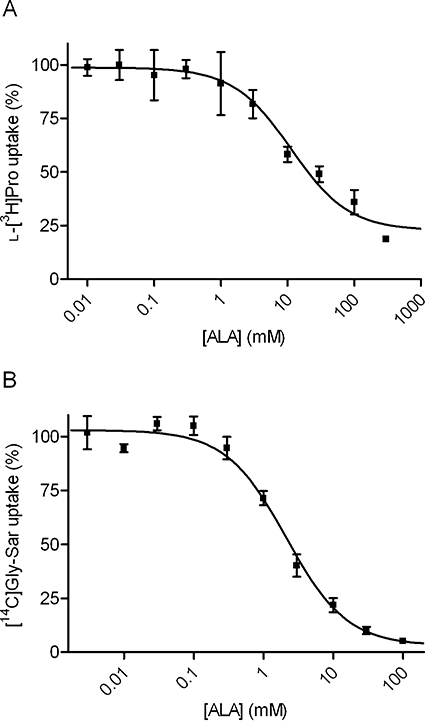
Inhibition of apical l-[3H]Pro or [14C]Gly-Sar uptake by ALA in Caco-2 cells. All compounds were dissolved in HBSS+ containing 10 mM MES; pH adjusted to 6.0 and added to the apical side; HBSS+ at the basolateral side contained 10 mM HEPES, and pH was adjusted to 7.4. Apical uptake was measured for 5 min. (A) The apical uptake of l-[3H]Pro (13 nM) was measured in the absence or presence of increasing concentrations of ALA. The uptake measured in the absence of ALA was taken as 100%. The IC50 value was estimated using Eqn 2 to 11.3 mM (logIC50 of 1.05 ± 0.128). Each data point represents the mean ± SEM of three different passages (n= 3). (B) The apical uptake of [14C]Gly-Sar (18 µM) was measured in the absence or presence of increasing concentrations of ALA. The uptake measured in the absence of ALA was taken as 100%. The IC50 value was estimated using Eqn 2 to 2.1 mM (logIC50 of 0.327 ± 0.078). Each data point represents the mean ± SEM of three different passages (n= 3).
ALA was translocated via SLC15A1 in MDCK cells stably transfected with SLC15A1
To further characterize transport of the test compounds and ALA via SLC15A1, investigations were performed in MDCK cells stably transfected with SLC15A1. The ability of a compound to cause a membrane depolarization following the symport of protons and substrate was used as a surrogate marker of electrogenic substrate influx. This was measured as changes in membrane potential using a microplate reader, as described in Methods. An increase in fluorescence emitted is proportional to a decrease in membrane potential, which is indicative of proton-coupled transport via SLC15A1. In Figure 3A, the concentration-dependent relative change in fluorescence (ΔF*) caused by Gly-Sar is shown. The Gly-Sar transport was saturable with a Km value of 2.3 ± 0.56 mM and a ΔF*max of 1.1 ± 0.07 of the response recorded with 20 mM Gly-Sar. In Figure 3B, the ability of the test compounds to be translocated via SLC15A1 is shown as the SLC15A1-specific change in fluorescence relative to the change in fluorescence caused by 20 mM Gly-Sar. As an example, the relative change in fluorescence recorded with ALA is 1.2 (i.e. the SLC15A1-specific change in fluorescence caused by 30 mM ALA is 1.2 times the fluorescence emitted after the addition of 20 mM Gly-Sar). It is evident that 30 mM of Gly, Sar, Pro and GABA was not able to induce changes in fluorescence significantly different from zero, indicating that Gly, Sar, Pro and GABA are not translocated via SLC15A1. As expected, 30 mM of ALA, Gly-Sar and Gly-Sar-Sar was able to generate a decrease in membrane potential similar to the one recorded for 20 mM Gly-Sar (Figure 3B). The concentration-dependent relative change in fluorescence caused by ALA was then investigated (Figure 3C). The SLC15A1-mediated transport of ALA was saturable with a Km of 6.4 ± 1.5 mM and a ΔF*max of 1.7 ± 0.14. Collectively, this confirms earlier studies showing that ALA, Gly-Sar and Gly-Sar-Sar are substrates for SLC15A1, whereas Gly, Sar, Pro and GABA are not substrates.
Figure 3.
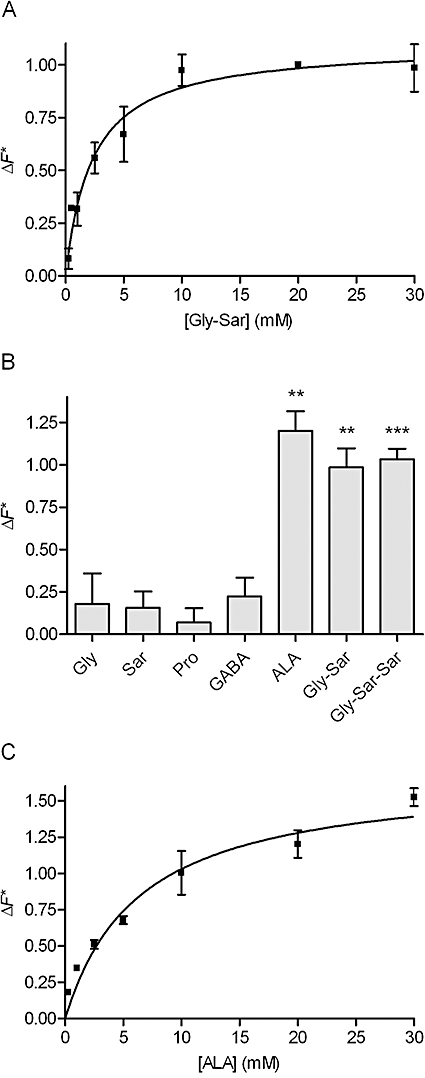
Translocation via SLC15A1 in MDCK cells stably transfected with SLC15A1. The experimental data were generated using the fluorescence-based FLIPR membrane potential assay (see Methods). The relative change in fluorescence (ΔF*, see Eqn 1) is the SLC15A1-specific change in fluorescence recorded after electrogenic transport of a compound relative to the SLC15A1-specific change in fluorescence recorded after the addition of 20 mM Gly-Sar. The changes in fluorescence are thus normalized to the changes in fluorescence measured with 20 mM Gly-Sar. All recordings were done in HBSS+ buffer containing 10 mM MES, pH adjusted to 6.0. (A) Concentration-dependent relative change in fluorescence caused by Gly-Sar via SLC15A1. The relative change in fluorescence (ΔF*) was analysed using Eqn 3, giving a Km value of 2.3 ± 0.56 mM, and a ΔF*max of 1.1 ± 0.07 of the response given by 20 mM Gly-Sar. Each data point represents the mean ± SEM of four different passages (n= 4). (B) Relative change in fluorescence caused by the test compounds via SLC15A1. The SLC15A1-specific change in fluorescence recorded in the presence of 30 mM compound was related to the SLC15A1-specific change in fluorescence measured in the presence of 20 mM Gly-Sar. Each bar represents the mean ± SEM of four different passages (n= 4). ***P < 0.001 and **P < 0.01 significantly different from zero. (C) Concentration-dependent relative change in fluorescence caused by ALA via SLC15A1. The relative change in fluorescence (ΔF*) was analysed using Eqn 3, giving a Km value of 6.4 ± 1.5 mM, and a ΔF*max of 1.7 ± 0.14 of the response given by 20 mM Gly-Sar. Each data point represents the mean ± SEM for three different passages (n= 3).
ALA was translocated via SLC36A1 in COS-7 cells transiently transfected with SLC36A1
In order to investigate whether ALA and the other test compounds were translocated via SLC36A1, or merely inhibitors of SLC36A1 substrate transport, a series of experiments were performed in COS-7 cells transiently transfected with SLC36A1. Initially, the concentration-dependent SLC36A1-specific relative change in fluorescence (ΔF*) caused by Pro was investigated (Figure 4A). The relative change in fluorescence was saturable with a Km value of 4.7 ± 0.8 mM and a ΔF*max of 1.1 ± 0.06 of the response recorded with 20 mM Pro. For the test compounds, 30 mM of Gly, Sar, Pro, GABA and ALA induced changes in fluorescence similar to 20 mM Pro (Figure 4B), indicating that they all were substrates for electrogenic transport via SLC36A1 (Figure 4B). Moreover, 30 mM of Gly-Sar was able to produce approximately 50% of the response given by 20 mM Pro. Gly-Sar-Sar was not able to induce changes in the fluorescence response significantly different from zero. The concentration-dependent transport of ALA was then investigated. The SLC36A1-mediated relative change in fluorescence caused by ALA in transfected COS-7 cells was saturable with a Km value of 3.8 ± 1.0 mM and a ΔF*max of 0.98 ± 0.08 of the response given by 20 mM Pro (Figure 4C).
Figure 4.
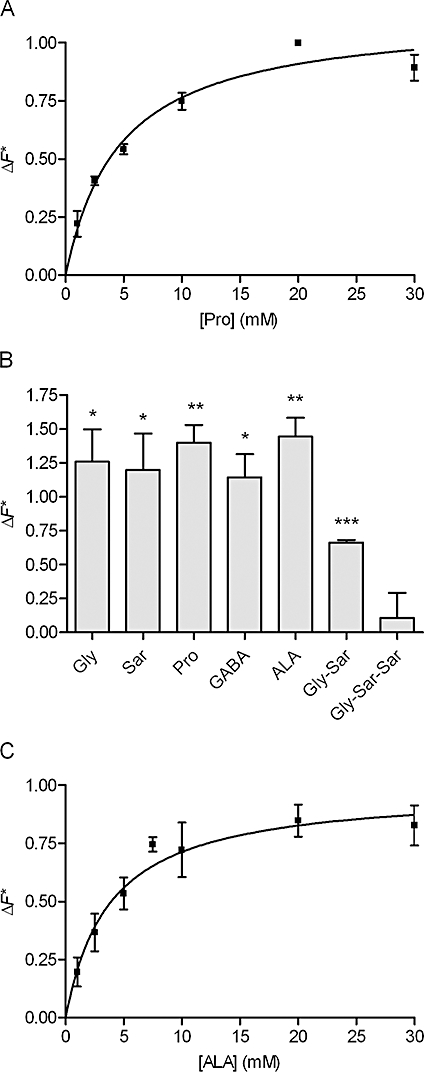
Translocation via SLC36A1 in COS-7 cells transiently transfected with SLC36A1. The experimental data were generated using the fluorescence-based FLIPR membrane potential assay (see Methods). The relative change in fluorescence (ΔF*, see Eqn 1) is the SLC36A1-specific change in fluorescence recorded after electrogenic transport of a compound relative to the SLC36A1-specific change in fluorescence recorded after the addition of 20 mM Pro. The changes in fluorescence are thus normalized to the changes in fluorescence measured with 20 mM Pro. All recordings were done in Na+-free HBSS+ buffer containing 10 mM MES, pH adjusted to 6.0. (A) Concentration-dependent relative change in fluorescence caused by Pro via SLC36A1. The relative change in fluorescence (ΔF*) was analysed using Eqn 3, giving a Km value of 4.7 ± 0.8 mM, and a ΔF*max of 1.1 ± 0.06 of the response given by 20 mM Pro. Each data point represents the mean ± SEM of three different passages (n= 3). (B) Relative change in fluorescence caused by the test compounds via SLC36A1. The SLC36A1-specific change in fluorescence recorded in the presence of 30 mM compound was related to the SLC36A1-specific change in fluorescence measured in the presence of 20 mM Pro. Each bar represents the mean ± SEM of three different passages (n= 3). ***P < 0.001, **P < 0.01 and *P < 0.05 significantly different from zero. (C) Concentration-dependent relative change in fluorescence caused by ALA via SLC36A1. The relative change in fluorescence (ΔF*) was analysed using Eqn 3, giving a Km value of 3.8 ± 1.0 mM, and a ΔF*max of 0.98 ± 0.08 of the response given by 20 mM Pro. Each data point represents the mean ± SEM for three different passages (n= 3).
To further verify that ALA is a substrate for SLC36A1, [14C]ALA uptake in transfected COS-7 cells was measured with and without a pH gradient, in the presence of the test compounds and as a function of increasing ALA concentrations (Figure 5). In Figure 5A, the uptake of [14C]ALA is approximately 200% higher in SLC36A1-transfected then in mock-transfected COS-7 cells. In the presence of 50 mM ALA, the uptake of [14C]ALA is reduced to a level comparable to the uptake in COS-7 cells transfected with the empty transfection vector (pcDNA3.1). Changing the pH of the incubation medium from 6.0 to 7.4 significantly reduces the uptake of [14C]ALA in SLC36A1 expressing COS-7 cells (Figure 5A). The uptake of [14C]ALA in the presence of the test compounds confirms that Gly, Pro, GABA and ALA, but not Gly-Sar-Sar, are able to significantly reduce the substrate uptake via SLC36A1. Gly-Sar is able to inhibit the uptake of [14C]ALA, although to a lesser extent than the other SLC36A1 substrates (Figure 5B). The concentration-dependent uptake of ALA was then investigated (Figure 5C). The SLC36A1-mediated transport of ALA was saturable with a Km of 6.8 ± 3.0 mM and a Vmax of 96 ± 13 pmol·cm−2·min−1. Collectively, this confirms earlier studies showing that Gly, Sar, Pro and GABA are substrates for SLC36A1, and additionally shows that ALA is a substrate for SLC36A1, whereas Gly-Sar-Sar is not a substrate. Gly-Sar also seems to bind to SLC36A1, although with a much lower affinity than ALA. ALA is thus a substrate for both SLC36A1 and SLC15A1, which illustrates a novel substrate overlap between the two transporters.
Figure 5.
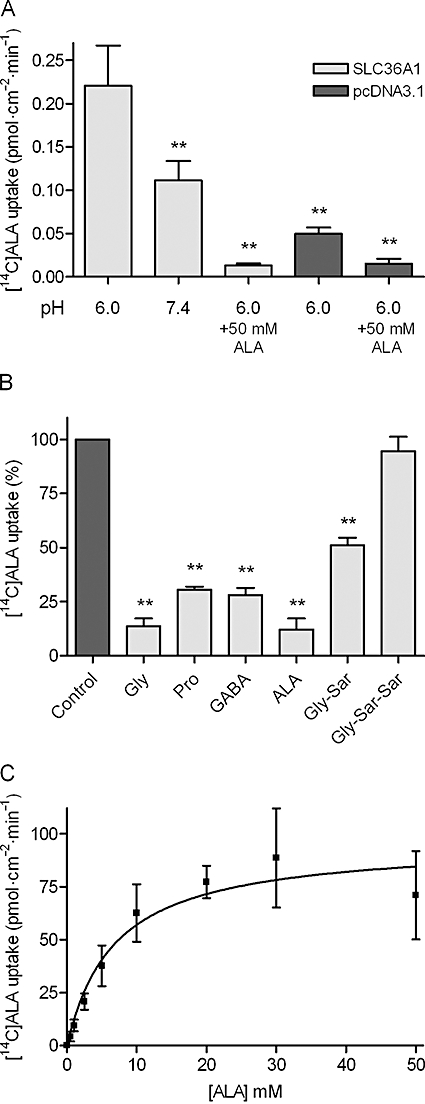
[14C]ALA uptake via SLC36A1 in COS-7 cells transiently transfected with SLC36A1. The uptake of [14C]ALA (9 µM) in COS-7 cells transiently transfected with SLC36A1 or pcDNA3.1. Uptake was measured for 20 min in Na+-free HBSS+ containing 10 mM MES, pH adjusted to 6.0, unless otherwise stated. (A) [14C]ALA uptake (pmol·cm−2·min−1) in SLC36A1 or pcDNA3.1-transfected COS-7 cells. Uptake was measured in Na+-free HBSS+ containing 10 mM MES, pH adjusted to 6.0, or Na+-free HBSS+ containing 10 mM HEPES, pH adjusted to pH 7.4 with or without 50 mM ALA. Each bar represents the mean ± SEM for four different passages (n= 4). One-way anova showed significant (P < 0.0001) differences between the means. **P < 0.01 significantly different from the uptake at pH 6.0 in SLC36A1-transfected COS-7 cells. (B) The SLC36A1-specific uptake of [14C]ALA (9 µM) in the presence of 30 mM test compound. The uptake measured in the absence of inhibitor was taken as 100%. Each bar represents the mean ± SEM for three different passages (n= 3). One-way anova showed significant (P < 0.0001) differences between the means. **P < 0.01 significantly different from the control. (C) Concentration-dependent uptake of [14C]ALA (pmol·cm−2·min−1) via SLC36A1. The uptake rate was analysed using Eqn 4, giving a Km value of 6.8 ± 3.0 mM, and a Vmax of 96 ± 13 pmol·cm−2·min−1. Each data point represents the mean ± SEM of three different passages (n= 3).
SLC36A1 and SLC15A1 are the only transporters for ALA in Caco-2 cells
We have shown that SLC36A1 and SLC15A1 are both transporters of ALA in transfected cell systems. To investigate if other transporters are involved in intestinal absorption, we investigated the apical ALA uptake in Caco-2 cell monolayers in the presence and absence of sodium and inhibitors of SLC36A1 and SLC15A1. The apical uptake of [14C]ALA in Caco-2 cell monolayers showed no sodium dependency at pH 6.0 or 7.4, whereas the pH dependency of ALA uptake was confirmed (Figure 6A). To estimate the relative contribution of the SLC36A1- and SLC15A1-mediated transport of the total transport of ALA, we investigated transport at two different apical concentrations of ALA (i.e. 0.5 and 25 mM). Investigation of the apical ALA uptake with a donor concentration of 0.5 mM showed that 10 mM 5-HTP significantly inhibited the uptake of ALA to 73% of the uptake in the absence of inhibitor. Likewise, 0.5 mM Bip-Pro inhibited the uptake of ALA to 36% of the control uptake. The uptake of ALA in the presence of both 5-HTP and Bip-Pro was negligible (4%) (Figure 6B). Performing uptake experiments with a higher ALA concentration (25 mM) showed that 10 mM 5-HTP significantly inhibited the uptake of ALA to 51% of the uptake in the absence of inhibitor. Likewise, 0.5 mM Bip-Pro inhibited the uptake of ALA to 72% of the control uptake. The uptake of ALA in the presence of both 5-HTP and Bip-Pro was 16% (Figure 6C). The uptake of ALA at an apical concentration of 0.5 mM was thus mostly inhibited by an inhibitor for SLC15A1 and to a minor degree by an inhibitor of SLC36A1, whereas this pattern was reversed at a higher apical ALA concentration of 25 mM. This indicates that only SLC36A1 and SLC15A1 are relevant transporters of apical ALA transport at the pH values and ALA concentrations investigated, and that SLC36A1 is the major determinant of ALA uptake at high ALA concentrations.
Figure 6.
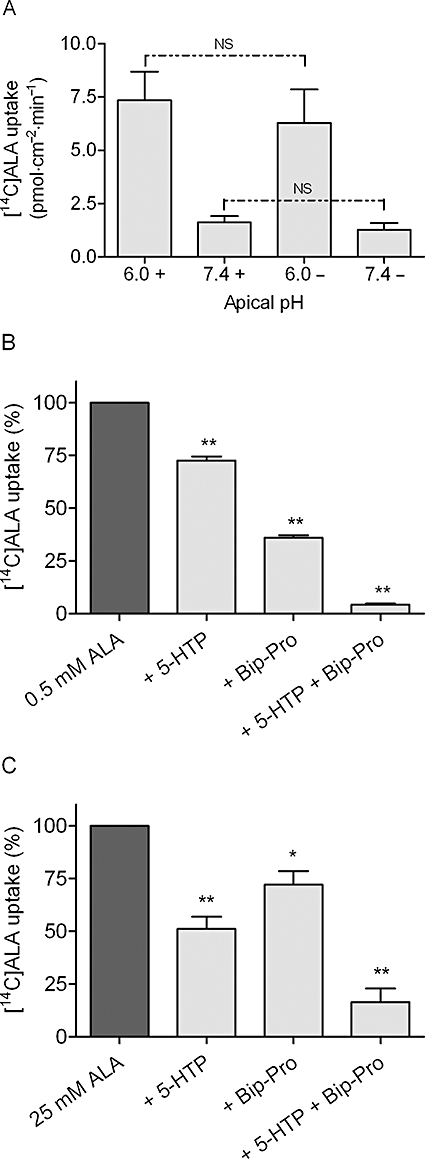
Apical [14C]ALA uptake in Caco-2 cells. The apical uptake of [14C]ALA (9 µM) was measured for 5 min in HBSS+ containing 10 mM MES, pH adjusted to 6.0 at the apical side, and HBSS+ containing 10 mM HEPES, pH adjusted to 7.4 at the basolateral side, unless otherwise stated. (A) The pH and sodium dependency of apical [14C]ALA uptake. Uptake was measured at apical pH 6.0 or 7.4 in the absence (shown as –) or presence (shown as +) of sodium. The apical side was buffered with HBSS+ or Na+-free HBSS+ containing either 10 mM MES, pH adjusted to 6.0, or 10 mM HEPES, pH adjusted to 7.4. The basolateral side was buffered with HBSS+ or Na+-free HBSS+ containing 10 mM HEPES, pH adjusted to 7.4. Each bar represents the mean ± SEM of three different passages (n= 3). NS denotes no significant difference between uptake measured in the presence or absence of sodium. (B) Inhibition of apical uptake of 0.5 mM [14C]ALA. Uptake was measured in the absence or presence of 10 mM 5-HTP (+ 5-HTP), 0.5 mM Bip-Pro (+ Bip-Pro) or 10 mM 5-HTP and 0.5 mM Bip-Pro (+ 5-HTP + Bip-Pro). The uptake measured in the absence of inhibitor was taken as 100%. Each bar represents the mean ± SEM of three different passages (n= 3). One-way anova showed significant (P < 0.0001) differences between the means. **P < 0.01 significantly different from the uptake measured in the absence of inhibitor. (C) Inhibition of apical uptake of 25 mM [14C]ALA. Uptake was measured in the absence or presence of 10 mM 5-HTP (+ 5-HTP), 0.5 mM Bip-Pro (+ Bip-Pro) or 10 mM 5-HTP and 0.5 mM Bip-Pro (+ 5-HTP + Bip-Pro). The uptake measured in the absence of inhibitor was taken as 100%. Each bar represents the mean ± SEM of three different passages (n= 3). One-way anova showed significant (P < 0.0001) differences between the means. **P < 0.01 significantly different from the uptake measured in the absence of inhibitor.
Discussion and conclusions
The present study shows for the first time that ALA is a substrate for the proton-coupled amino acid transporter SLC36A1 (hPAT1). In Caco-2 cell monolayers, only SLC36A1 and SLC15A1 are involved in apical uptake of ALA, which suggests that the intestinal absorption of ALA is likely to be mediated by both SLC15A1 and SLC36A1. Furthermore, the present work shows a substrate overlap for ALA between two proton-coupled transporters for distinct exogenous substrates (i.e. amino acids and di/tri-peptides).
ALA is a substrate for the proton-coupled amino acid transporter SLC36A1
In the present study, ALA was able to inhibit the apical uptake of SLC36A1 substrates l-[3H]Pro, [3H]GABA, [14C]MeAIB and [14C]Gly in Caco-2 cells. Furthermore, ALA inhibited the apical uptake of l-[3H]Pro in a concentration-dependent manner, with an IC50 value of 11.3 mM (logIC50 of 1.05 ± 0.128). The affinity of ALA is thus comparable to the affinity of Gly (Ki= 9.9 mM), which is a natural substrate for SLC36A1 (Chen et al., 2003; Larsen et al., 2008). Pro is a substrate for several amino acid transporters, but in Caco-2 cell monolayers only SLC36A1 has so far been identified as being involved in apical Pro uptake (Thwaites et al., 1993; Metzner et al., 2004; Larsen et al., 2008). ALA inhibits apical l-[3H]Pro uptake in Caco-2 cells is indicative of ALA binding to SLC36A1, and ALA could therefore be either an inhibitor or a substrate. Binding to the external binding pocket of a transporter does not necessarily implicate that the bound ligand is translocated and released to the cytosolic side, as is seen with 5-HTP, which is a non-translocated ligand of SLC36A1 (Metzner et al., 2005). Translocation of ALA via SLC36A1 was therefore investigated in transiently transfected COS-7 cells following two different experimental approaches. To avoid the involvement of any sodium-coupled transporter endogenously expressed in COS-7 cells, experiments were performed in the absence of sodium. The transport of ALA via SLC36A1 in COS-7 cells was investigated using the FLIPR membrane potential assay. The translocation of ALA was concentration dependent with a Km value of 3.8 ± 1.0 mM. Because the ΔF*max was 0.98 ± 0.08, the maximal change in fluorescence induced by ALA was similar to the change in fluorescence caused by 20 mM Pro. To further verify that ALA is a substrate for SLC36A1, we confirmed, using uptake studies with [14C]ALA in transfected COS-7 cells, that the transport of ALA via SLC36A1 is concentration dependent; dependent on extracellular pH; and can be inhibited by Gly, Pro and GABA. Collectively, we identified ALA as a novel substrate for SLC36A1.
Substrate overlap between SLC36A1 and SLC15A1
The findings of the present study add to the current understanding of the structure–activity relationship for SLC36A1. Murine slc36a1 has been shown to bind Gly, β-alanine and GABA with high affinity, and δ-aminopentanoic acid with a low affinity (Boll et al., 2003). These authors suggested that, for a slc36a1 substrate, the maximal separation tolerated between the amino and carboxyl groups is only two CH2 units, as in GABA (Boll et al., 2003). Here, we show that a separation of two CH2 units and a C=O unit is well tolerated, as the chemical difference between ALA and GABA is that ALA contains an additional carbonyl group (C=O) (see Table 1). The existence of a carbonyl group in ALA introduces a planar bond in the molecule, thus positioning the charged N- and C-termini differently and closer to each other, as compared to the flexible δ-aminopentanoic acid molecule. This could be the reason for the observed affinity of ALA relative to δ-aminopentanoic acid. Besides the finding that ALA is a substrate for both SLC36A1 and SLC15A1, the present study also indicates that Gly-Sar binds to SLC36A1, although with a very low affinity. The uptake of l-[3H]Pro in Caco-2 cells is slightly inhibited by Gly-Sar, and in SLC36A1 expressing COS-7 cells, the uptake of [14C]ALA was approximately 50% of the control value in the presence of 30 mM Gly-Sar. Moreover, Gly-Sar is able to change the membrane potential in SLC36A1 expressing COS-7 cells. However, the signals induced by Gly-Sar are smaller than those observed for the other substrates for SLC36A1. That Gly-Sar inhibits the uptake of Pro and ALA could be due to amino acid impurities (i.e. Gly or Sar) present in the batch. However, the certificate of analysis for Gly-Sar from Sigma-Aldrich states that Gly-Sar is 100% pure. Moreover, we found no detectable amounts of Sar and only 0.1% free Gly in the Gly-Sar batch used (see Methods). Thus, free amino acids in the Gly-Sar batch are not the cause for the observed results. In comparison with ALA, Gly-Sar has an amide bond, which also reduces the flexibility of the molecule compared to δ-aminopentanoic acid. Neither ALA nor Gly-Sar has side chain residues other than –H in what would be the side chains of a dipeptide. As l-serine and other amino acids with branched side chains are not substrates for SLC36A1 (Chen et al., 2003), it does not seem likely that dipeptides or dipeptidomimetics in general should be substrates for SLC36A1. However, as illustrated here, substrates could include other dipeptides with –H or –CH3 containing amino acid side chains (e.g. Gly-Gly or Ala-Ala). In fact, preliminary experiments in our laboratory suggest that Gly-Pro and Ala-Gly also inhibit uptake of SLC36A1 substrates in Caco-2 cell, although with a low affinity. Thus, further studies are needed in order to classify Gly-Sar as a substrate for SLC36A1. ALA has previously been shown to be a substrate for SLC15A1. Doring et al., (1998b) showed that ALA as opposed to GABA is transported via SLC15A1, and concluded that the minimal structural requirement for recognition by SLC15A1 was a separation of the amino group and the carboxylic acid of four methylene groups. The present study confirms these basic structural requirements for SLC15A1, and suggests that for SLC36A1 both separation and positioning of the charged N- and C-termini may be important for substrate binding.
Pharmacological implications of the interaction of ALA with transporters
ALA has been used for both photodynamic diagnosis and therapy. Recently, ALA was used in photodynamic diagnosis for the evaluation of the surgical margins during radical prostatectomy in patients with prostate cancer (Zaak et al., 2008). The 16 patients in this study received 20 mg ALA per kilogram body weight as a 200 mL oral solution. This corresponds approximately to an initial intestinal ALA concentration of 53 mM for a 70 kg person. In another study with patients having bladder cancer, a 40 mg·kg−1 oral solution was given (Waidelich et al., 2001), which corresponds to an initial intestinal ALA concentration of 107 mM. In a pharmacokinetic study of ALA in healthy human volunteers, a lower oral ALA concentration of approximately 6 mM was used (Dalton et al., 2002). The doses used for oral administration of ALA thus result in mM concentrations in the intestine. ALA is well absorbed, as the oral absorption fraction is 56% in healthy human volunteers and 42% in beagle dogs (Dalton et al., 1999, 2002). The affinity of SLC15A1 substrates is high if Km < 0.5 mM (Brandsch et al., 2004), whereas SLC36A1 substrates generally have lower affinities (Km values around 2–15 mM). The transport capacity of SLC36A1 appears to be larger than of SLC15A1. In Caco-2 cells grown under similar conditions, the maximal transport capacity across the apical membrane, Vmax, is 5.0 and 1.9 nmol·min−1·cm−2 for Pro and Gly-Sar, respectively (Nielsen et al., 2003; Larsen et al., 2008). Thus, as oral ALA administration results in intestinal mM concentrations notably higher than the SLC15A1 ALA Km value (Table 1), SLC36A1, based on our findings in Caco-2 cell monolayers, may be the major determinant for the transporter-mediated intestinal uptake of ALA. In Figure 6, we show that at 0.5 mM the majority of ALA uptake is inhibited by a SLC15A1 substrate, whereas at 25 mM the majority of the ALA uptake is inhibited by a SLC36A1 substrate. Our findings are in agreement with our calculations, which together with the lack of sodium dependency of the uptake of ALA point to the fact that only SLC36A1 and SLC15A1, at the conditions studied, are relevant absorptive transporters for ALA.
A few papers have previously reported that there is an interaction between GABA and ALA at the level of cellular uptake in mammalian cells (Rud et al., 2000; Irie et al., 2001; Bermudez et al., 2002; Rodriguez et al., 2006). However, the molecular nature of some of the transporters involved has not been unequivocally shown. In Caco-2 cell monolayers, Irie et al. (2001) found that the apical uptake of ALA could be inhibited by Gly-Sar, and concluded that SLC15A1 was the major transporter for ALA in Caco-2 cells. However, these authors also found that Gly and GABA could inhibit apical uptake of ALA, and furthermore that Gly-Sar was only able to inhibit a minor fraction of the total apical ALA uptake (Irie et al., 2001). This actually supports our findings, as it indicates that SLC36A1 could account for the majority of the apical uptake of ALA in Caco-2 cells. In the murine mammary adenocarcinoma LM3 cell line, GABA inhibited uptake of ALA, but the SLC36A1 substrate l-alanine at a concentration of 2 mM was unable to inhibit the uptake of either ALA or GABA (Rodriguez et al., 2006), thus pointing to an interaction with a transporter different from SLC36A1 or SLC15A1. In another study, it was postulated that ALA interacts with a transporter of the ‘BETA-transporter family’ such as mGAT2 (Bermudez et al., 2002). The murine GAT2 is the orthologue of the human BGT-1 (SLC6A12), and hGAT-1, hBGT-1, hGAT-2 and hGAT-3 have affinities for GABA in 10–26 µM range (Kvist et al., 2009). Furthermore, BGT-1 is likely to be expressed in the basolateral membrane of epithelial cells (Yamauchi et al., 1992), and therefore some of these transporters could be candidates for mediating the cellular exit of ALA from intestinal cells. Other transporters, such as an unspecified organic anion transporter, and SLC15A1 and SLC15A2 have been suggested to be involved in cellular ALA uptake in tissues other than the intestine (Novotny et al., 2000; Neumann and Brandsch, 2003). ALA is thus capable of interacting with several different transporters in the body. In the gastrointestinal tract, SLC36A1 and SLC15A1 are both expressed in the luminal membrane of cells from the small intestine, and it seems evident that these two transporters will determine the intestinal absorption across the luminal membrane due to the large capacity and low-affinity nature of these transporters. However, the expression of SLC15A1 and SLC36A1 has also been shown in a number of other tissues, indicating that the findings of the present study that ALA is a substrate for SLC36A1, may also help in the understanding of ALA disposition in tissues other than the intestine.
In conclusion, the present study shows for the first time that ALA is a substrate for SLC36A1. A substrate overlap between SLC36A1 and SLC15A1 was identified for ALA. Furthermore, SLC36A1 may be the transporter determining the majority of the intestinal absorption of ALA at intestinal concentrations resulting from common oral dosing regiments.
Acknowledgments
The authors wish to acknowledge the work of the following technicians: Bettina Dinitzen, Maria Læssøe Pedersen and Birgitte Eltong from the Faculty of Pharmaceutical Sciences, University of Copenhagen. The Carlsberg Foundation is acknowledged for supporting the purchase of the NOVOstar Microplate Reader. The Predictive Drug Absorption consortium provided financial support for purchasing chemicals. MDCK/SLC15A1 cells were kindly donated by Bristol-Myers Squibb Company. Dr V. Ganapathy from the Medical College of Georgia is acknowledged for providing hPAT1 in pSPORT1. Ulla Bekker Poulsen and Torben Osterlund from Bioneer are acknowledged for their help with the subcloning of SLC36A1 into pcDNA3.1, and Jacob Andersen and Anders Skov Kristensen from the Faculty of Pharmaceutical Sciences, University of Copenhagen for their help with establishing the transfection system. We are very grateful for the help with the analysis of the purity of Gly-Sar we got from senior advisor Jens Hansen-Møller from the University of Aarhus (Foulum, Denmark).
Glossary
Abbreviations:
- ALA
δ-aminolevulinic acid
- Bip-Pro
l-4,4′-biphenylalanyl-l-proline
- DMEM
Dulbecco's modified Eagle's medium
- Gly
glycine
- Gly-Sar
glycyl-sarcosine
- Gly-Sar-Sar
glycyl-sarcosyl-sarcosine
- HBSS
Hanks's balanced salt solution
- HEPES
4-(2-hydroxyethyl)-1-piperazine ethanesulphonic acid
- 5-HTP
5-hydroxy-l-tryptophan
- LYAAT1
lysosomal amino acid transporter 1
- MeAIB
α-methylaminoisobutyric acid
- MES
2-(N-morpholino)ethanesulphonic acid
- Pro
proline
- Sar
sarcosine
- SLC15A1 (hPEPT1)
human di/tri-peptide transporter 1
- SLC36A1 (hPAT1)
human proton-coupled amino acid transporter 1
- TEER
transepithelial electrical resistance
Conflict of interest
The authors state no conflict of interest.
Note added in proof: After the submission of this manuscript, a paper by Anderson et al. appeared that also identifies ALA as a substrate for hPAT1 (Anderson et al., 2010).
Supporting information
Additional Supporting Information may be found in the online version of this article:
Figure S1 Fluorescence emitted in response to proline. Representative curves showing the time resolution of the change in fluorescence emitted in response to increasing concentrations of praline on SLC36A1 or mock transfected COS-7 cells. Each data point represents the average change in fluorescence measured in four independent wells in a single experiment (n = 4). '1 P' denotes 1 mM proline and so forth.
Figure S2 Fluorescence emitted in response to ALA. Representative curves showing the time resolution of the change in fluorescence emitted in response to increasing concentrations of ALA on SLC36A1 or mock transfected COS-7 cells. Each data point represents the average change in fluorescence measured in four independent wells in a single experiment (n = 4). '1 A' denotes 1 mM ALA and so forth.
Figure S3 Change in fluorescence emitted as response to increasing concentrations of extracellular potassium. The maximal change in fluorescence ΔF, measured via the FLIPR® membrane potential assay on MDCK/SLC15A1 cells, in response to increasing concentrations of extracellular potassium [K+]o, after preincubation with valinomycin. The cells where incubated with 1 µM valinomycin dissolved in loading buffer for 30 min at 37°C. The concentration of potassium in the loading buffer was 5.8 mM. Each data point represents the mean ± standard error of the mean of four different wells (n = 4).
Figure S4 Linearity between change in fluorescence and change in membrane potential. The maximal change in fluorescence ΔF, measured via the FLIPR® membrane potential assay on MDCK/SLC15A1 cells, is shown as a function of the change in membrane potential (depolarization) caused by addition of increasing concentrations of extracellular potassium (5.8–144 mM). The change in membrane potential, ΔVm, is calculated from Nernst equation, Eq. (1). Each data point represents the mean ± standard error of the mean of four different wells (n = 4).
Figure S5 Non-saturation of the redistribution of the Blue Membrane Potential probe. The maximal change in fluorescence ΔF measured in the FLIPR® membrane potential assay on MDCK/SLC15A1, in response to either 1 mM or 30 mM Gly-Sar (GS) as a function of the concentration of the Blue Membrane Potential probe (MP probe) in the loading buffer. The dashed line represents the concentration used in the present study (0.55 mg·mL−1). Each data point represents the mean ± standard error of the mean of four different wells (N = 4) in two different experiments (n = 2).
Please note: Wiley-Blackwell are not responsible for the content or functionality of any supporting materials supplied by the authors. Any queries (other than missing material) should be directed to the corresponding author for the article.
References
- Abbot EL, Grenade DS, Kennedy DJ, Gatfield KM, Thwaites DT. Vigabatrin transport across the human intestinal epithelial (Caco-2) brush-border membrane is via the H+-coupled amino-acid transporter hPAT1. Br J Pharmacol. 2006;147:298–306. doi: 10.1038/sj.bjp.0706557. [DOI] [PMC free article] [PubMed] [Google Scholar]
- Addison JM, Burston D, Matthews DM. Evidence for active transport of the dipeptide glycylsarcosine by hamster jejunum in vitro. Clin Sci. 1972;43:907–911. doi: 10.1042/cs0430907. [DOI] [PubMed] [Google Scholar]
- Alexander SP, Mathie A, Peters JA. Guide to Receptors and Channels (GRAC), 3rd edn. Br J Pharmacol. 2008;153(Suppl. 2):S1–209. doi: 10.1038/sj.bjp.0707746. [DOI] [PMC free article] [PubMed] [Google Scholar]
- Andersen R, Nielsen CU, Begtrup M, Jorgensen FS, Brodin B, Frokjaer S, et al. In vitro evaluation of N-methyl amide tripeptidomimetics as substrates for the human intestinal di-/tri-peptide transporter hPEPT1. Eur J Pharm Sci. 2006;28:325–335. doi: 10.1016/j.ejps.2006.03.007. [DOI] [PubMed] [Google Scholar]
- Anderson CM, Grenade DS, Boll M, Foltz M, Wake KA, Kennedy DJ, et al. H+/amino acid transporter 1 (PAT1) is the imino acid carrier: an intestinal nutrient/drug transporter in human and rat. Gastroenterology. 2004;127:1410–1422. doi: 10.1053/j.gastro.2004.08.017. [DOI] [PubMed] [Google Scholar]
- Anderson CM, Jevons M, Thangaraju M, Edwards N, Conlon NJ, Woods S, et al. Transport of the photodynamic therapy agent 5-aminolevulinic acid by distinct H+-coupled nutrient carriers coexpressed in the small intestine. J Pharmacol Exp Ther. 2010;332:220–228. doi: 10.1124/jpet.109.159822. [DOI] [PMC free article] [PubMed] [Google Scholar]
- Andre B, Hein C, Grenson M, Jauniaux JC. Cloning and expression of the UGA4 gene coding for the inducible GABA-specific transport protein of Saccharomyces cerevisiae. Mol Gen Genet. 1993;237:17–25. doi: 10.1007/BF00282779. [DOI] [PubMed] [Google Scholar]
- Beauchamp LM, Orr GF, Demiranda P, Burnette T, Krenitsky TA. Amino-acid ester prodrugs of acyclovir. Antimicrob Agents Chemother. 1992;3:157–164. [Google Scholar]
- Bermudez MM, Correa GS, Perotti C, Batlle A, Casas A. Delta-aminolevulinic acid transport in murine mammary adenocarcinoma cells is mediated by beta transporters. Br J Cancer. 2002;87:471–474. doi: 10.1038/sj.bjc.6600481. [DOI] [PMC free article] [PubMed] [Google Scholar]
- Boll M, Foltz M, Anderson CM, Oechsler C, Kottra G, Thwaites DT, et al. Substrate recognition by the mammalian proton-dependent amino acid transporter PAT1. Mol Membr Biol. 2003;20:261–269. doi: 10.1080/0968768031000100759. [DOI] [PubMed] [Google Scholar]
- Brandsch M, Knutter I, Leibach FH. The intestinal H+/peptide symporter PEPT1: structure–affinity relationships. Eur J Pharm Sci. 2004;21:53–60. doi: 10.1016/s0928-0987(03)00142-8. [DOI] [PubMed] [Google Scholar]
- Bretschneider B, Brandsch M, Neubert R. Intestinal transport of beta-lactam antibiotics: analysis of the affinity at the H+/peptide symporter (PEPT1), the uptake into Caco-2 cell monolayers and the transepithelial flux. Pharm Res. 1999;16:55–61. doi: 10.1023/a:1018814627484. [DOI] [PubMed] [Google Scholar]
- Broer S. Amino acid transport across mammalian intestinal and renal epithelia. Physiol Rev. 2008;88:249–286. doi: 10.1152/physrev.00018.2006. [DOI] [PubMed] [Google Scholar]
- Chen Z, Fei YJ, Anderson CM, Wake KA, Miyauchi S, Huang W, et al. Structure, function and immunolocalization of a proton-coupled amino acid transporter (hPAT1) in the human intestinal cell line Caco-2. J Physiol. 2003;546:349–361. doi: 10.1113/jphysiol.2002.026500. [DOI] [PMC free article] [PubMed] [Google Scholar]
- Dalton JT, Meyer MC, Golub AL. Pharmacokinetics of aminolevulinic acid after oral and intravenous administration in dogs. Drug Metab Dispos. 1999;27:432–435. [PubMed] [Google Scholar]
- Dalton JT, Yates CR, Yin D, Straughn A, Marcus SL, Golub AL, et al. Clinical pharmacokinetics of 5-aminolevulinic acid in healthy volunteers and patients at high risk for recurrent bladder cancer. J Pharmacol Exp Ther. 2002;301:507–512. doi: 10.1124/jpet.301.2.507. [DOI] [PubMed] [Google Scholar]
- Doring F, Walter J, Will J, Focking M, Boll M, Amasheh S, et al. Delta-aminolevulinic acid transport by intestinal and renal peptide transporters and its physiological and clinical implications. J Clin Invest. 1998a;101:2761–2767. doi: 10.1172/JCI1909. [DOI] [PMC free article] [PubMed] [Google Scholar]
- Doring F, Will J, Amasheh S, Clauss W, Ahlbrecht H, Daniel H. Minimal molecular determinants of substrates for recognition by the intestinal peptide transporter. J Biol Chem. 1998b;273:23211–23218. doi: 10.1074/jbc.273.36.23211. [DOI] [PubMed] [Google Scholar]
- Faria TN, Timoszyk JK, Stouch TR, Vig BS, Landowski CP, Amidon GL, et al. A novel high-throughput pepT1 transporter assay differentiates between substrates and antagonists. Mol Pharm. 2004;1:67–76. doi: 10.1021/mp034001k. [DOI] [PubMed] [Google Scholar]
- Fei YJ, Kanai Y, Nussberger S, Ganapathy V, Leibach FH, Romero MF, et al. Expression cloning of a mammalian proton-coupled oligopeptide transporter. Nature. 1994;368:563–566. doi: 10.1038/368563a0. [DOI] [PubMed] [Google Scholar]
- Ganapathy V, Leibach FH. Role of pH gradient and membrane potential in dipeptide transport in intestinal and renal brush-border membrane vesicles from the rabbit. Studies with l-carnosine and glycyl-l-proline. J Biol Chem. 1983;258:14189–14192. [PubMed] [Google Scholar]
- Herrera-Ruiz D, Faria TN, Bhardwaj RK, Timoszyk J, Gudmundsson OS, Moench P, et al. A novel hPepT1 stably transfected cell line: establishing a correlation between expression and function. Mol Pharm. 2004;1:136–144. doi: 10.1021/mp034011l. [DOI] [PubMed] [Google Scholar]
- Hilgendorf C, Ahlin G, Seithel A, Artursson P, Ungell AL, Karlsson J. Expression of thirty-six drug transporter genes in human intestine, liver, kidney, and organotypic cell lines. Drug Metab Dispos. 2007;35:1333–1340. doi: 10.1124/dmd.107.014902. [DOI] [PubMed] [Google Scholar]
- Inui K, Tomita Y, Katsura T, Okano T, Takano M, Hori R. H+ coupled active transport of bestatin via the dipeptide transport system in rabbit intestinal brush-border membranes. J Pharmacol Exp Ther. 1992;260:482–486. [PubMed] [Google Scholar]
- Irie M, Terada T, Sawada K, Saito H, Inui K. Recognition and transport characteristics of nonpeptidic compounds by basolateral peptide transporter in Caco-2 cells. J Pharmacol Exp Ther. 2001;298:711–717. [PubMed] [Google Scholar]
- Knutter I, Hartrodt B, Toth G, Keresztes A, Kottra G, Mrestani-Klaus C, et al. Synthesis and characterization of a new and radiolabeled high-affinity substrate for H+/peptide cotransporters. FEBS J. 2007;274:5905–5914. doi: 10.1111/j.1742-4658.2007.06113.x. [DOI] [PubMed] [Google Scholar]
- Kvist T, Christiansen B, Jensen AA, Brauner-Osborne H. The four human gamma-aminobutyric acid (GABA) transporters: pharmacological characterization and validation of a highly efficient screening assay. Comb Chem High Throughput Screen. 2009;12:241–249. doi: 10.2174/138620709787581684. [DOI] [PubMed] [Google Scholar]
- Larsen M, Larsen BB, Frolund B, Nielsen CU. Transport of amino acids and GABA analogues via the human proton-coupled amino acid transporter, hPAT1: characterization of conditions for affinity and transport experiments in Caco-2 cells. Eur J Pharm Sci. 2008;35:86–95. doi: 10.1016/j.ejps.2008.06.007. [DOI] [PubMed] [Google Scholar]
- Larsen M, Holm R, Jensen KG, Brodin B, Nielsen CU. Intestinal gaboxadol absorption via PAT1(SLC36A1): modified absorption in vivo following co-administration of l-tryptophan. Br J Pharmacol. 2009;157:1380–1389. doi: 10.1111/j.1476-5381.2009.00253.x. [DOI] [PMC free article] [PubMed] [Google Scholar]
- Meier Y, Eloranta JJ, Darimont J, Ismair MG, Hiller C, Fried M, et al. Regional distribution of solute carrier mRNA expression along the human intestinal tract. Drug Metab Dispos. 2007;35:590–594. doi: 10.1124/dmd.106.013342. [DOI] [PubMed] [Google Scholar]
- Metzner L, Kalbitz J, Brandsch M. Transport of pharmacologically active proline derivatives by the human proton-coupled amino acid transporter hPAT1. J Pharmacol Exp Ther. 2004;309:28–35. doi: 10.1124/jpet.103.059014. [DOI] [PubMed] [Google Scholar]
- Metzner L, Kottra G, Neubert K, Daniel H, Brandsch M. Serotonin, l-tryptophan, and tryptamine are effective inhibitors of the amino acid transport system PAT1. FASEB J. 2005;19:1468–1473. doi: 10.1096/fj.05-3683com. [DOI] [PubMed] [Google Scholar]
- Neumann J, Brandsch M. Delta-aminolevulinic acid transport in cancer cells of the human extrahepatic biliary duct. J Pharmacol Exp Ther. 2003;305:219–224. doi: 10.1124/jpet.102.046573. [DOI] [PubMed] [Google Scholar]
- Nielsen CU, Amstrup J, Steffansen B, Frokjaer S, Brodin B. Epidermal growth factor inhibits glycylsarcosine transport and hPepT1 expression in a human intestinal cell line. Am J Physiol Gastrointest Liver Physiol. 2001a;281:G191–G199. doi: 10.1152/ajpgi.2001.281.1.G191. [DOI] [PubMed] [Google Scholar]
- Nielsen CU, Andersen R, Brodin B, Frokjaer S, Taub ME, Steffansen B. Dipeptide model prodrugs for the intestinal oligopeptide transporter. Affinity to and transport via hPepT1 in the human intestinal Caco-2 cell line. J Control Release. 2001b;76:129–138. doi: 10.1016/s0168-3659(01)00427-8. [DOI] [PubMed] [Google Scholar]
- Nielsen CU, Brodin B, Jorgensen FS, Frokjaer S, Steffansen B. Human peptide transporters: therapeutic applications. Expert Opin Ther Pat. 2002;12:1329–1350. [Google Scholar]
- Nielsen CU, Amstrup J, Steffansen B, Frokjaer S, Brodin B. Epidermal growth factor and insulin short-term increase hPepT1-mediated glycylsarcosine uptake in Caco-2 cells. Acta Physiol Scand. 2003;178:139–148. doi: 10.1046/j.1365-201X.2003.01113.x. [DOI] [PubMed] [Google Scholar]
- Nielsen CU, Vabeno J, Andersen R, Brodin B, Steffansen B. Recent advances in therapeutic applications of human peptide transporters. Expert Opin Ther Pat. 2005;15:153–166. [Google Scholar]
- Novotny A, Xiang J, Stummer W, Teuscher NS, Smith DE, Keep RF. Mechanisms of 5-aminolevulinic acid uptake at the choroid plexus. J Neurochem. 2000;75:321–328. doi: 10.1046/j.1471-4159.2000.0750321.x. [DOI] [PubMed] [Google Scholar]
- Rodriguez L, Batlle A, Di VG, Battah S, Dobbin P, MacRobert AJ, et al. Mechanisms of 5-aminolevulinic acid ester uptake in mammalian cells. Br J Pharmacol. 2006;147:825–833. doi: 10.1038/sj.bjp.0706668. [DOI] [PMC free article] [PubMed] [Google Scholar]
- Rud E, Gederaas O, Hogset A, Berg K. 5-Aminolevulinic acid, but not 5-aminolevulinic acid esters, is transported into adenocarcinoma cells by system BETA transporters. Photochem Photobiol. 2000;71:640–647. doi: 10.1562/0031-8655(2000)071<0640:aabnaa>2.0.co;2. [DOI] [PubMed] [Google Scholar]
- Sugawara M, Huang W, Fei YJ, Leibach FH, Ganapathy V, Ganapathy ME. Transport of valganciclovir, a ganciclovir prodrug, via peptide transporters PEPT1 and PEPT2. J Pharm Sci. 2000;89:781–789. doi: 10.1002/(SICI)1520-6017(200006)89:6<781::AID-JPS10>3.0.CO;2-7. [DOI] [PubMed] [Google Scholar]
- Thwaites DT, Anderson CM. Deciphering the mechanisms of intestinal imino (and amino) acid transport: the redemption of SLC36A1. Biochim Biophys Acta. 2006;1768:179–197. doi: 10.1016/j.bbamem.2006.10.001. [DOI] [PubMed] [Google Scholar]
- Thwaites DT, Anderson CM. H+-coupled nutrient, micronutrient and drug transporters in the mammalian small intestine. Exp Physiol. 2007;92:603–619. doi: 10.1113/expphysiol.2005.029959. [DOI] [PMC free article] [PubMed] [Google Scholar]
- Thwaites DT, McEwan GT, Cook MJ, Hirst BH, Simmons NL. H(+)-coupled (Na(+)-independent) proline transport in human intestinal (Caco-2) epithelial cell monolayers. FEBS Lett. 1993;333:78–82. doi: 10.1016/0014-5793(93)80378-8. [DOI] [PubMed] [Google Scholar]
- Thwaites DT, Armstrong G, Hirst BH, Simmons NL. d-Cycloserine transport in human intestinal epithelial (Caco-2) cells: mediation by a H(+)-coupled amino acid transporter. Br J Pharmacol. 1995a;115:761–766. doi: 10.1111/j.1476-5381.1995.tb14998.x. [DOI] [PMC free article] [PubMed] [Google Scholar]
- Thwaites DT, McEwan GT, Simmons NL. The role of the proton electrochemical gradient in the transepithelial absorption of amino acids by human intestinal Caco-2 cell monolayers. J Membr Biol. 1995b;145:245–256. doi: 10.1007/BF00232716. [DOI] [PubMed] [Google Scholar]
- Thwaites DT, Basterfield L, McCleave PM, Carter SM, Simmons NL. Gamma-aminobutyric acid (GABA) transport across human intestinal epithelial (Caco-2) cell monolayers. Br J Pharmacol. 2000;129:457–464. doi: 10.1038/sj.bjp.0703069. [DOI] [PMC free article] [PubMed] [Google Scholar]
- Van Zeebroeck G, Bonini BM, Versele M, Thevelein JM. Transport and signaling via the amino acid binding site of the yeast Gap1 amino acid transceptor. Nat Chem Biol. 2009;5:45–52. doi: 10.1038/nchembio.132. [DOI] [PubMed] [Google Scholar]
- de Vrueh RL, Smith PL, Lee CP. Transport of l-valine-acyclovir via the oligopeptide transporter in the human intestinal cell line, Caco-2. J Pharmacol Exp Ther. 1998;286:1166–1170. [PubMed] [Google Scholar]
- Waidelich R, Stepp H, Baumgartner R, Weninger E, Hofstetter A, Kriegmair M. Clinical experience with 5-aminolevulinic acid and photodynamic therapy for refractory superficial bladder cancer. J Urol. 2001;165:1904–1907. doi: 10.1097/00005392-200106000-00015. [DOI] [PubMed] [Google Scholar]
- Yamauchi A, Uchida S, Kwon HM, Preston AS, Robey RB, Garcia-Perez A, et al. Cloning of a Na(+)- and Cl(–)-dependent betaine transporter that is regulated by hypertonicity. J Biol Chem. 1992;267:649–652. [PubMed] [Google Scholar]
- Zaak D, Sroka R, Khoder W, Adam C, Tritschler S, Karl A, et al. Photodynamic diagnosis of prostate cancer using 5-aminolevulinic acid – first clinical experiences. Urology. 2008;72:345–348. doi: 10.1016/j.urology.2007.12.086. [DOI] [PubMed] [Google Scholar]
Associated Data
This section collects any data citations, data availability statements, or supplementary materials included in this article.