

Abstract
The sliding and hopping models encapsulate the essential protein-DNA binding process for binary complex formation and dissociation. However, the effects of a cofactor protein on the protein-DNA binding process that leads to the formation of a ternary complex remain largely unknown. Here we investigate the effect of the cofactor Sox2 on the binding and unbinding of Oct1 with the Hoxb1 control element. We simulate the association of Oct1 with Sox2-Hoxb1 using molecular dynamics simulations, and the dissociation of Oct1 from Sox2-Hoxb1 using steered molecular dynamics simulations, in analogy to a hopping event of Oct1. We compare the kinetic and thermodynamic properties of three model complexes (the wild-type and two mutants) in which the Oct1-DNA base-specific interactions or the Sox2-Oct1 protein-protein interactions are largely abolished. We find that Oct1-DNA base-specific interactions contribute significantly to the total interaction energy of the ternary complex, and that nonspecific Oct1-DNA interactions are sufficient for driving the formation of the protein-DNA interface. The Sox2-Oct1 protein-protein binding interface is largely hydrophobic, with remarkable shape complementarity. This interface promotes the formation of the ternary complex and slows the dissociation of Oct1 from its DNA-binding site. We propose a simple two-step reaction model of protein-DNA binding, called the tethered-hopping model, that explains the importance of the cofactor Sox2 and may apply to similar ternary protein-DNA complexes.
Introduction
Protein-DNA binding is a highly selective, dynamic, and reversible process. Based on the results of experimental and theoretical studies, investigators have proposed two prevalent binding reaction pathways: the sliding model and the hopping model (1–7).
In the sliding model, the transcription factor usually binds to the DNA at a nonspecific site by random collision and slides along the DNA until it finds its specific binding sequence. A large number of dissociation and reassociation reactions take place during this process. This model is also known as the random-walk model. Proteins have been observed to move along stretched DNA in vitro or DNA inside prokaryotic cells in single-molecule experiments, confirming the validity of the sliding model (5). However, sliding alone could not achieve the fast and efficient protein-DNA binding that was observed in experimental studies. An important theoretical model established by Slutsky and Mirny (8) combined a one-dimensional sliding motion along DNA with three-dimensional diffusion in solution that led to fast protein-DNA binding close to the experimental rates. To improve efficiency in protein-DNA recognition and binding, a two-state structural representation of proteins (a partially unfolded state and a compact folded state) was adopted. The model proposed by Slutsky and Mirny was verified by Hu et al. (9) and found to be adequate for describing the protein-DNA binding of bacterial transcription factors.
In eukaryotic cell nuclei, however, the DNA is packaged into chromosomes; thus, the hopping model is a more probable course of action for DNA-binding proteins in these organisms. In the hopping model, after the transcription factor binds to the DNA at a nonspecific site, it dissociates from this site and reassociates (after diffusion in solution) with the base-specific binding site. The hopping may be facilitated by either the looping or supercoiling of DNA that puts these two DNA-binding sites close together in space. Both of these pathways (sliding and hopping) may play an important role in enabling DNA-binding proteins to achieve fast and specific binding (5).
Recently, another important but less studied pathway, called intersegmental exchange, was observed in the Oct1-Hoxb1 binary complex by Doucleff and Clore (10). Intersegmental exchange is different from the hopping model in that dissociation and association occur simultaneously without releasing the protein to the solution. Of importance, the authors found that the rate of intersegmental exchange was significantly diminished by the presence of a cofactor, Sox2, possibly due to the tight binding of the Sox2 HMG domain with the POUS domain of Oct1. (A brief overview of Sox and Oct proteins and their importance in combinatorial gene regulation is provided in the Supporting Material.) These results indicate that the binding pathway for ternary complexes may be quite different from the simple sliding and hopping models, as protein-protein interactions are not included or utilized in these binary complex models.
During the formation of ternary or higher-order protein-DNA complexes, the transcription factor partners may bind to each other before they simultaneously or consecutively bind to their DNA-binding sites. Alternatively, one transcription factor, especially a minor-groove binding transcription factor such as the TATA-box protein, may bind to its specific DNA site first; it may then unwind the DNA duplex and help expose the DNA-binding surface to facilitate the binding of other partner proteins (11). The order of these binding events in complex formation may be dependent on the nature of each participating transcription factor, the packaging and conformation of the DNA, and the DNA sequences at the binding site.
Rudnick and Bruinsma (12) investigated the cooperative binding of two proteins to DNA to form ternary complexes. In that work, the proteins did not necessarily interact with each other, and the driving force of ternary complex formation was due entirely to tension in the DNA. In the study presented here, we focused on investigating the effects of the cofactor Sox2 on Oct1-Hoxb1 binding and unbinding, such as in a hopping event, with a relatively tension-free DNA duplex. We modeled the dynamics of association and dissociation of the Oct1 protein with respect to the Sox2-Hoxb1 binary complex by molecular dynamics (MD) simulations (13,14) and steered molecular dynamics (SMD) simulations (15–17), respectively. We believe that DNA binding of Sox2 precedes that of Oct1, for the following reasons: First of all, Sox2 is a minor-groove binding transcription factor. DNA binding of Sox2 unwinds the double helix to facilitate additional transcription factor binding. Second, experimental work on embryonic stem cells has revealed that Sox2 protein is typically localized in the cell nucleus, whereas Oct3/4 protein (a close family member of Oct1 that binds to Sox2 similarly) is localized in both the cytoplasm and the nucleus (18). These observations suggest that Sox2 protein is probably already bound to the DNA before Oct3/4 protein is transported into the nucleus.
To delineate the importance of protein-protein interactions and protein-DNA interactions in ternary complex formation, we studied and compared the kinetic and thermodynamic properties for the association and dissociation of three model complexes of Sox2-Oct1-Hoxb1: the wild-type (WT) and two mutants in which the Oct1-DNA base-specific interactions or Sox2-Oct1 protein-protein interactions were largely abolished. Our results show that Oct1-DNA base-specific interactions are the major contributor to the binding affinity of the ternary complex. Nonspecific Oct1-DNA interactions were found to be the main driving force for protein-DNA binding, which is consistent with the existing sliding and hopping models of binary complex formation. Furthermore, our simulation revealed a hydrophobic Sox2-Oct1 binding interface with remarkable shape complementarity between the third α-helix of the HMG domain of Sox2 and the first α-helix of the POUS domain of Oct1. The association simulations showed that the HMG-POUS protein-protein interface has a crucial role in driving the formation of the ternary complex. This shape complementarity also helps keep the ternary complex intact and effectively slows the dissociation of Oct1 protein from the Sox2-DNA complex, which is consistent with the diminished intersegmental exchange rate observed by Doucleff and Clore (10). We propose a simple two-step reaction model of protein-DNA binding, called the tethered-hopping model, that explains the important roles of the cofactor Sox2. In this model, the tether (i.e., the favorable protein-protein interactions) between the two transcription factors (Sox2 and Oct1) promotes efficient protein-DNA binding of the second factor (Oct1 protein) and helps maintain the stability of the ternary protein-DNA complex by slowing the dissociation of the second factor from its DNA-binding site. This tethered-hopping model may be applicable to other similar ternary protein-DNA complexes.
Materials and Methods
Modeling systems
Starting from the Sox2-Oct1-Hoxb1 NMR structure (19) (PDB accession number 1O4X; shown in Fig. S1), the Sox2 HMG domain, the Oct1 POUS domain, and a 16 basepair DNA fragment representing their binding sites were selected as the model system. The sequences of the protein and DNA chains in this truncated system are shown in Fig. S2 together with the rationale for removing the POUHD domain from the system. We denote this starting ternary complex as HMG-POUS-DNA. The WT and two mutant ternary complexes were built and compared. The first mutant complex is denoted as HMG-POUSM···DNA, where the base-specific POUS-DNA binding interface (in boldface and with interaction indicated by the dots) was mutated on the POUS domain (indicated by the superscript M). The second mutant complex is denoted as HMGM···POUS-DNA, where the protein-protein interface (in boldface and interaction represented by dots) was mutated on the HMG domain (indicated by superscript M).
Association simulations
The MD simulation package NAMD 2.6 (20) was used for all simulations in this work. The charmm27 force field (21), which has demonstrated accuracy for both proteins and DNA molecules (22), was also used. Periodic boundary conditions were applied throughout all simulations. The SHAKE algorithm with a tolerance of 10−6 Å was applied to constrain all bonds involving hydrogen atoms. All other degrees of freedom were allowed, except for the constraints specified in each simulation. The time steps were 2 fs and 1 fs for the MD and SMD simulations, respectively. Each MD or SMD simulation experiment was repeated five times using different initial velocity assignments to promote efficient sampling of the energy surfaces, and we present the final averaged results.
The truncated HMG-POUS-DNA WT structure was put into a solvent box with neutralizing ions at a biological salt concentration and equilibrated. We then applied SMD using the constant velocity pulling method (PCV mode; k = 7 kcal · mol−1 · Å−2, v = 0.5 Å · ps−1, t = 200 ps) to pull the POUS domain apart from its native binding position from the HMG-DNA binary complex and create a partially dissociated complex. These partially dissociated complex structures were then subjected to a 3 ns MD simulation in the NPT ensemble (1 atm, 300 K). The trajectories were saved every 1000 time steps (i.e., 2 ps). During the 3 ns simulations, the POUS domain in all three partially dissociated complexes successfully reformed the protein-protein and protein-DNA interfaces and rebound to the HMG-DNA complex in forming the ternary complex. The root mean-square deviation (RMSD) values for atoms in the reformed complexes with respect to the NMR structure (19) were calculated to evaluate the degree of structural similarity.
Dissociation simulations
We applied SMD to simulate the dissociation of the POUS domain from the HMG-DNA complex by employing the same protocol used to generate the partially dissociated WT complex, except that this time the simulation time was 300 ps. The starting point of the dissociation was a random conformation selected at a time when the model complexes became reformed and the trajectories were equilibrated during the association simulation. For all three model systems, the dissociation simulations resulted in the formation of a free HMG-DNA binary complex and a free POUS domain. The distance of the POUS domain from its native position in the NMR structure was at least 15 Å after the dissociation reaction.
The interaction energy between POUS and HMG-DNA during the association and dissociation reactions was evaluated using the following formula (23):
| (1) |
where Eint(POUS·X, t), Eelec(POUS − X, t), and Evdw(POUS − X, t) are the time-dependent interaction energy, electrostatic energy, and van der Waals energy between POUS and X, respectively. Here X may be HMG, DNA, or the HMG-DNA binary complex.
Results and Discussion
Creation of the mutant model complexes
We were interested in finding out whether selective amino acid mutations in POUS of Oct1 and in HMG of Sox2 would cause significant changes in the stability and dynamics of the HMG-POUS-DNA ternary complex by perturbing the protein-DNA or the protein-protein binding interface. Therefore, we made two mutant ternary complexes with amino acid mutations that largely abolish the existent base-specific protein-DNA interactions and protein-protein interactions in the WT structure while maintaining the secondary structures and overall binding conformation.
The base-specific protein-DNA interactions were absent in the HMG-POUSM···DNA mutant complex. Of importance, the binding of POUS to DNA in this mutant would be similar to binding with nonspecific sites in both the sliding and hopping models, as only nonspecific protein-DNA interactions are present. Therefore, this model complex may be considered a nonspecific ternary complex.
The protein-protein interactions were largely missing in the HMGM···POUS-DNA mutant complex. It is noteworthy that the binding of POUS to DNA in this third mutant would be similar to the existing hopping model in binary complexes, as the effect of the cofactor Sox2 is largely removed by abolishing the protein-protein interactions. Therefore, this third model complex may be considered a pseudo-binary complex.
Association of the POUS domain with the HMG-DNA binary complex
Structural analysis of the three model complexes
At the beginning of the association reaction, the POUS domain was situated away from the HMG-DNA complex, its distance from its native position in the NMR structure was ∼3.2 Å, and there were no hydrogen bonds between the POUS domain and the binary complex. After a 3 ns MD simulation of the association reaction, the POUS domain in all three model systems was rebound to HMG-DNA to form the HMG-POUS-DNA ternary complex. The RMSD values for all backbone atoms in the three model complexes over the simulation period increased monotonically for the first 1 ns and then plateaud for the last 2 ns around 4 Å with respect to the same starting partially dissociated conformation, suggesting that the structures were equilibrated (Fig. S3).
The instantaneous distance of the POUS domain from its native bound position in the NMR structure (19) is plotted in Fig. 1. This distance decreased from 3.2 Å to ∼0.8 Å for all three model complexes over the course of the association simulation. For the WT complex and the HMG-POUSM···DNA mutant, the distances leveled off after ∼500 ps of simulation, whereas it took the HMGM···POUS-DNA mutant ∼2 ns to reach the plateau. The distance changes can be converted into translational speeds of 0.48 m/s for the POUS domain in the first two model complexes and 0.12 m/s in the third model complex.
Figure 1.
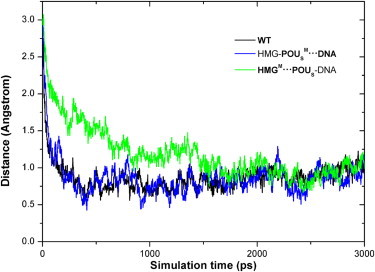
Distance of the POUS domain from its DNA-binding position in the NMR structure as a function of simulation time for the three model complexes during the association. The distance values were obtained by first calculating the distances between the center of mass of the POUS domain and that of the DNA-binding site, and then subtracting those distances by 18 Å, which is the mass centers' distance in the NMR structure. The black, blue, and green curves (color online) represent the WT complex, the HMG-POUSM···DNA mutant, and the HMGM···POUS-DNA mutant, respectively.
It is interesting that the direct mutation of base-specific contacts between the POUS domain and the DNA in the HMG-POUSM···DNA mutant did not affect the association speed. This result is consistent with the existing sliding and hopping models in that nonspecific protein-DNA interactions are the primary driving force for protein-DNA binding. On the other hand, mutation of the protein-protein interface between HMG and POUS in the HMGM···POUS-DNA mutant decreased the binding speed to one-fourth that of the former two complexes. This result suggests that POUS binds to DNA much more rapidly in the nonspecific ternary complex than in the pseudo-binary complex, and reveals the importance of the protein-protein interface in driving protein-DNA binding of the transcription factor partner. Existing protein-DNA binding models (8,9) have achieved binding rates that are about one magnitude slower than the experimental values. Our results suggest that the existence of a cofactor may help increase the binding rates of these models to match the in vivo measurements. The role of the protein-protein interface is further demonstrated in the following sections.
On the basis of Fig. 1, we refer to the complex structures during the last 1 ns MD association simulations as the rebound ternary complex. Structural analyses for the three model complexes were carried out during this simulation period. The final average distances and standard deviations of the POUS domain from its native bound position were 1.01 ± 0.08 Å for the WT complex, 0.9 ± 0.1 Å for the HMG-POUSM···DNA mutant, and 1.04 ± 0.07 Å for the HMGM···POUS-DNA mutant. The average distances are greater than zero, indicating that although the POUS domain is rebound to the HMG-DNA complex, it is situated slightly farther away from the DNA-binding site than in the NMR structure. This result also suggests that POUS-DNA binding is probably similar in the three rebound model complexes. Indeed, more-detailed RMSD analyses (Table S1) on each α-helix of the HMG and POUS domains in the rebound complexes demonstrated that all three model complexes were similar to the NMR structure, and the mutations we applied did not affect the overall conformation of the complexes.
Protein-protein and protein-DNA binding interface comparisons among the three model complexes
Fig. 2 summarizes the protein-protein and protein-DNA interfaces in the WT HMG-POUS-DNA structure. The HMG-DNA binding interface is colored blue in Fig. 2 A (HMG domain) and B (HMG's DNA-binding site) (color image is online). The HMG-POUS binding interface is colored yellow in Fig. 2 A (HMG domain) and C (POUS domain). The POUS-DNA binding interface is shown in Fig. 2 C (POUS domain) and D (POUS's DNA-binding site).
Figure 2.
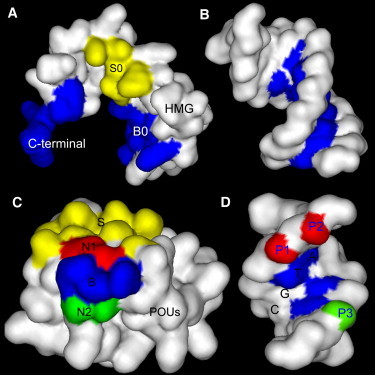
Protein-protein and protein-DNA binding surfaces in the HMG-POUS-DNA ternary complex. Panel A shows the binding surfaces of the HMG domain. The B0 and C-terminal regions (blue; color image is online) form base-specific contacts with its binding site CTTTGTC and bends the DNA. The S0 region (yellow) forms the protein-protein interface with the POUS domain. Panel B shows the corresponding DNA-binding site of the HMG domain for sequence-specific binding. Panel C shows the binding surfaces of the POUS domain. The S region (yellow) forms the protein-protein binding interface with the HMG domain. The B region (blue) consists of key amino acids and forms base-specific contacts with its DNA-binding site. Regions N1 (red) and N2 (green) consist of non-key amino acids and interact with the phosphate groups of DNA. Panel D shows the DNA-binding surfaces for the B, N1, and N2 regions of POUS using matching colors. The specific sequence ATGC that the B region recognizes is labeled. The phosphate groups P1 and P2 (red) forms at least four hydrogen bonds with the N1 region of the POUS domain. Phosphate group P3 (green) forms at least two hydrogen bonds with the N2 region of the POUS domain. This image was rendered by Discovery Studio Visualizer 1.7, Accelrys Inc. (http://accelrys.com/products/discovery-studio/visualization/discovery-studio-visualizer.html).
We specifically compared the POUS-DNA and HMG-POUS interfaces in the three rebound model complexes to see the effects of the mutations on these two interfaces. First, the electrostatic interactions (mostly hydrogen bonds) at the POUS-DNA interface were examined. We used a 3.0 Å distance cutoff between the donor hydrogen and the acceptor atom, with no angle cutoff for the determination of the existence of a hydrogen bond. In the NMR structure, the amino acids in the POUS domain that bind DNA can be classified into two groups based on their interaction partners on the DNA. We refer to those that form base-specific contacts with the ATGC basepairs in the DNA (blue region in Fig. 2 D), such as Gln-44, Thr-45, and Arg-49, as key amino acids (the blue B region in Fig. 2 C). For instance, Gln-44 forms two hydrogen bonds with the adenine of the first basepair in the ATGC sequence. Thr-45 forms one hydrogen bond with the cytosine of the third basepair on the complementary strand of ATGC. Arg-49 forms two hydrogen bonds with the guanine of the fourth basepair on the complementary strand. These sequence-specific interactions are present in the WT and HMGM···POUS-DNA mutant complexes, but are missing in the HMG-POUSM···DNA mutant simulation. We use the term “non-key amino acids” to refer to those that make contact with the DNA backbone and are present in all three rebound model complexes. Fig. 2 C shows two such regions, N1 (red) and N2 (green), on the surface of the POUS domain. The N1 region consists of three amino acids (Arg-20, Gln-27, and Ser-48) that form at least four hydrogen bonds with the two phosphate groups P1 and P2 (Fig. 2 D, red). (In the NMR structure and the average structures of the rebound complexes for the three model systems, four hydrogen bonds were found between the N1 region of the POUS domain and the P1 and P2 groups on the DNA. However, when the simulation trajectories were examined frame by frame, occasionally more than four hydrogen bonds were seen; therefore, we describe it as “at least four”.) These phosphate groups belong to the bases TC in the CTTTGTC motif to which the HMG domain binds. The N2 region consists of Ser-43 and Thr-46, which form at least two hydrogen bonds with the phosphate group P3 (Fig. 2 D, green). This phosphate group belongs to the first base A in the complementary strand of the TAAT motif to which the POUHD domain binds. These nonspecific hydrogen bonds were all absent at the start of the association simulations, but were reformed in the rebound ternary complexes (Fig. S4).
Whereas the POUS-DNA interface is dominated by electrostatic interactions in a hydrogen-bonding network, the HMG-POUS interface mostly employs shape complementarity and hydrophobic interactions. The amino acids at this protein-protein interface in both the HMG (S0 region) and POUS (S region) domains are colored yellow in Fig. 2, A and C, respectively. In the NMR structure (19), amino acids Lys-59, Arg-62, and Met-66 of the third α-helix of the HMG domain form a small concave (Fig. S5 A). The inner binding surface of the concave is hydrophobic and the edge is hydrophilic. On the surface of the POUS domain, Ile-21 of the first α-helix together with the loop region between the first and second α-helices form a hydrophobic convex and fit snugly into the HMG concave. This shape complementarity between HMG and POUS is similar to the lock-and-key or induced-fit recognition mechanism that operates between an enzyme and its substrates.
When we examined the simulation trajectories of the association processes for the three model complexes, we found that establishment of the HMG-POUS interactions played a critical role in driving the formation of the ternary complex. During the association simulation for the WT complex and the HMG-POUSM···DNA mutant, the POUS domain was bound to its DNA-binding site ATGC within the first 500 ps of simulation. In the HMGM···POUS-DNA mutant, Lys-59, Arg-62, and Met-66 of the HMG domain were replaced by Gly (Fig. S5, B and C), which abolished the shape complementarity between HMG and POUS. The association of the POUS domain with the mutant HMGM···POUS-DNA binary complex occurred four times more slowly, and the POUS binding surface swept along the mutant HMG binding surface in a back-and-forth motion for ∼1 ns until POUS was finally bound to the DNA-binding site of ATGC (Fig. S5, B and C). This observation is consistent with the association distance plot of Fig. 1 and the α-helical RMSD results (in Table S1), which suggests that the binding of POUS with HMG is a critical factor in positioning POUS correctly at its DNA-binding site to form the ternary complex. This result further demonstrates that without the assistance of a protein partner in the sliding or hopping model, protein-DNA binding occurs much more slowly (as in the HMGM···POUS-DNA mutant). In conjunction with DNA packaging, it is reasonable to believe that the DNA binding of proteins in vivo is probably assisted by partner proteins or protein-DNA complexes.
Interaction energies between the POUS domain and the HMG-DNA binary complex
The time-dependent total interaction energy between the POUS domain and the HMG-DNA binary complex, Eint(POUS·HMG-DNA, t), steadily decreased during the association reaction for all three model complexes, indicating the formation of ternary complexes (Fig. S6). The average interaction energies between the POUS domain and the HMG-DNA binary complex during the last 1 ns simulation in the rebound complexes are summarized in Table 1. Table 1 shows that the interaction energy between the POUS domain and DNA, Eint(POUS·DNA, t), is much larger in magnitude than that between POUS and HMG, Eint(POUS·HMG, t). The former interaction energy is dominated by electrostatic energy (>90%), with only a small contribution from van der Waals energy for all three model complexes. However, van der Waals energy plays a more significant role (∼20–30% contribution) in the latter interaction energy. The total interaction energy, Eint(POUS·HMG-DNA, t), is mostly dominated by the interaction energy between the POUS domain and DNA.
Table 1.
Average interaction energies between POUs and HMG-DNA complex
| Model complex | With DNA |
With HMG |
With HMG-DNA |
||||||
|---|---|---|---|---|---|---|---|---|---|
| elec | vdw | IE | elec | vdw | IE | elec | vdw | IE | |
| WT | −570 (20) | −36 (2) | −600 (20) | −80 (10) | −25 (1) | −100 (10) | −640 (20) | −61 (2) | −700 (20) |
| HMG-POUSM···DNA | −180 (20) | −23 (2) | −200 (20) | −70 (10) | −32 (1) | −100 (10) | −250 (30) | −56 (2) | −306 (30) |
| HMGM···POUS-DNA | −540 (20) | −37 (2) | −580 (20) | −70 (8) | −17 (1) | −86 (8) | −610 (20) | −54 (2) | −670 (20) |
Average interaction energies and standard deviations (in parentheses) between the POUS domain and the HMG-DNA complex over the last 1 ns MD simulation of the association reaction. The energies are in unit kcal/mol. The columns list the electrostatic energy (elec), van der Waals energy (vdw), and interaction energy (IE) between the POUS domain with DNA, HMG domain, and the HMG-DNA binary complex. The columns from left to right correspond to panels A, D, G, B, E, H, C, F, and I of Fig. S6.
As expected, the mutations we introduced in the mutant complexes caused an increase in the interaction energy (i.e., made it more positive), which made the mutants less stable. This increase for the HMG-POUSM···DNA mutant is due entirely to the increase in interaction energy between the POUS domain and the DNA, Eint(POUS·DNA, t) (Table 1, second row). In contrast, the increase in interaction energy for the HMGM···POUS-DNA mutant is more or less equally partitioned between Eint(POUS·DNA, t) and Eint(POUS·HMG, t) (Table 1, third row). These results indicate that the perturbation of the protein-DNA interface of the POUS domain does not affect the binding strength between POUS and HMG. However, the abolishment of the shape complementarity between POUS and HMG affects the binding strength of the POUS domain with both the HMG domain and DNA. This latter result is noteworthy because it supports the previous findings that the formation of a protein-protein interface may help POUS bind more effectively to its DNA site.
Both the interaction energy between POUS and DNA, Eint(POUS·DNA, t), and the interaction energy between POUS and the HMG-DNA binary complex, Eint(POUS·HMG-DNA, t), are on the order of WT < HMGM···POUS-DNA < HMG-POUSM···DNA, as shown in Table 1 (columns 3 and 9). This result indicates that although both mutants become less stable by perturbing either the protein-protein or the protein-DNA binding interfaces, the extent of this destabilization is much greater in the HMG-POUSM···DNA mutant, as the total interaction energy is dominated by electrostatic interactions. For the interaction energy between the POUS domain and the HMG domain, Eint(POUS·HMG, t), the order is HMG-POUSM···DNA ≈ WT < HMGM···POUS-DNA, which is as expected because the protein-protein interaction is intact in the first two complexes.
Of interest, the order for the van der Waals energy between the POUS domain and the HMG domain, Evdw(POUS-HMG, t), is HMG-POUSM···DNA < WT < HMGM···POUS-DNA (column 5 in Table 1). The more negative van der Waals energy (more stable binding) between POUS and HMG in the HMG-POUSM···DNA mutant compared to the other two complexes indicates that the hydrophobic HMG-POUS protein-protein binding interface is flexible and can increase its binding affinity when the POUS-DNA binding is weakened by the mutations in POUS. This result thus supports the induced-fit model for the shape-complementary protein-protein binding interface between HMG and POUS. It further suggests that the flexible HMG domain is tolerant of different strengths of protein-protein binding in the formation of ternary protein-DNA complexes, which may explain the fact that HMG domain proteins have a wide range of binding partners with different structures and binding interfaces.
SMD dissociation simulation of the POUS domain from the HMG-DNA binary complex
Figs. 3 and 4 respectively show the changes in force and interaction energy that occur as the POUS domain dissociates from the HMG-DNA binary complex. The time-dependent change in the external force exerted on the atoms of POUS is plotted in Fig. 3. The interaction energy between POUS and the HMG-DNA binary complex, Eint(POUS·HMG-DNA, t), is shown in Fig. 4 for the entire duration of the dissociation process (The rationale for showing a shorter simulation duration in Fig. 3 is provided in the Supporting Material.)
Figure 3.
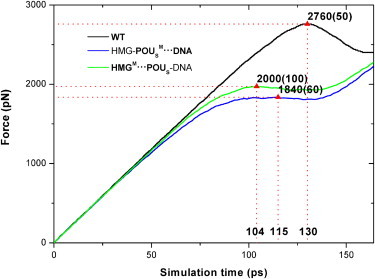
External forces exerted on the POUS domain as a function of simulation time during dissociation for the three model complexes. The triangles mark the force maxima that signify the start of dissociation of the POUS domain from the HMG-DNA binary complex. The error bars of the force maxima are listed in parentheses. The numbers marked at the X axis represent the corresponding simulation times. The legend of the curves is the same as in Fig. 1.
Figure 4.
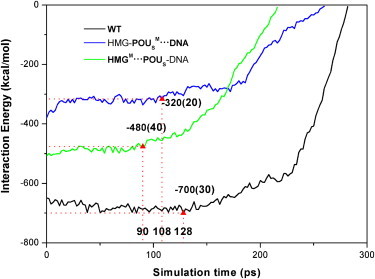
Interaction energy Eint(POUS·HMG-DNA, t) between the POUS domain and the HMG-DNA complex as a function of simulation time during dissociation for three model complexes. The triangles mark the interaction energies at the point of the initial dissociation of the POUS domain from the HMG-DNA binary complex. The error bars of the energy values are listed in parentheses. The numbers marked at the X axis represent the corresponding simulation times. The legend of the curves is the same as in Fig. 1.
The changes in force or interaction energy provide valuable information about the conformational changes and key events that take place during the dissociation. We can see from Figs. 3 and 4 that for the first 90 ps of the dissociation simulation, the interaction energy Eint(POUS·HMG-DNA, t) is relatively flat, whereas the external force on the POUS domain increases linearly, indicating that the ternary complex is still intact. The point at which the interaction energy begins to increase (i.e., becomes more positive) signals the beginning of dissociation of the POUS domain (triangles in Fig. 4). Similarly, the maximum force peak (triangles in Fig. 3) signals the breaking of major attractive interactions between the POUS domain and the HMG-DNA binary complex. We expected these two events (the interaction energy starts to increase and the force peaks) to happen more or less simultaneously. Fig. 3 shows that the external forces reach their maxima around the following simulation times for the three model complexes: WT complex 130 ps, HMG-POUSM···DNA mutant 115 ps, and HMGM···POUS-DNA mutant 104 ps. At similar simulation times, the interaction energy Eint(POUS·HMG-DNA, t) starts to increase monotonically (Fig. 4): WT complex 128 ps, HMG-POUSM···DNA mutant 108 ps, and HMGM···POUS-DNA mutant 90 ps. These results suggest that mutations in both mutants lead to faster dissociation of the POUS domain than the WT complex, and the mutation at the HMG-POUS interface leads to the fastest dissociation. In other words, the hydrophobic interactions between HMG and POUS play a critical role in keeping the POUS domain bound to the HMG-DNA binary complex. In addition, the distance of POUS from HMG-DNA during the dissociation (Fig. S7) shows an identical trend.
The slower dissociation rate of the WT complex compared to the HMGM···POUS-DNA mutant (pseudo-binary complex) is consistent with the experimentally observed diminished intersegmental exchange rate for Oct1-Hoxb1 binding in the presence of Sox2 (10). Energetically, the result may be rationalized by considering the penalty for exposing hydrophobic residues in water, which makes the dissociation of POUS domain from the HMG-POUS interface unfavorable.
The corresponding force maxima at the point of dissociation (Fig. 3) are as follows: WT complex 2760 pN, HMG-POUSM···DNA mutant 1840 pN, and HMGM···POUS-DNA mutant 2000 pN. The corresponding interaction energies at the start of dissociation (Fig. 4) are: WT complex −700 kcal/mol, HMG-POUSM···DNA mutant −320 kcal/mol, and HMGM···POUS-DNA mutant −480 kcal/mol. Because the HMG-POUSM···DNA mutant contains only nonspecific POUS-DNA interactions and has the weakest interaction energy, it takes the least force to become dissociated. We note that the maximum force observed for the HMGM···POUS-DNA mutant is quite similar to that of the HMG-POUSM···DNA mutant. In fact, the force curves of these two mutants are not significantly different from each other, indicating that the ease of pulling POUS away is similar in these two mutants, even though the interaction energy in the HMGM···POUS-DNA mutant is much stronger than that in the HMG-POUSM···DNA mutant.
Tethered-hopping model of protein-DNA binding for the association and dissociation of POUS with respect to HMG-DNA
Here, we propose a qualitative model of protein-DNA binding in the presence of a cofactor, which we call the tethered-hopping model (Fig. 5). Fig. 5 encapsulates the kinetic and thermodynamic properties of the three model complexes and explains the results of the association and dissociation simulations performed in this work. We placed the starting energies of the POUS domain and the HMG-DNA binary complex for the three model complexes on the same level for easy comparison. As a result, the interaction energy between POUS and the HMG-DNA binary complex, Eint(POUS·HMG-DNA, t), becomes simply the energy change of the reaction. The order of energy change of the three model complexes in Fig. 5 is the same as summarized in Table 1 and Fig. S6. There is one intermediate state in the association/dissociation reaction. Taking the association reaction as an example, the POUS domain first binds with the HMG domain, forming the shape-complementary protein-protein interface. Then the POUS domain forms mostly nonspecific interactions with the DNA-binding site, and the ternary complex is formed. The barrier for these two steps of the reaction is the energy required for macromolecular rearrangement and conformational change necessary for effective binding. For simplicity, the first-step energy curves for the WT and the HMG-POUSM···DNA mutant complexes are identical (i.e., the mutations do not affect the first step), and the second-step energy curves for the WT and the HMGM···POUS-DNA mutant complexes can be superimposed (i.e., the mutations do not affect the second step).
Figure 5.
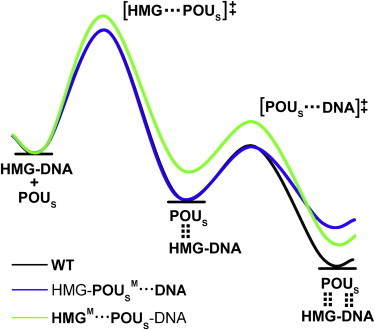
Tethered-hopping model of protein-DNA binding for the association/dissociation reaction of the POUS domain with respect to the HMG-DNA binary complex proposed based on the simulation results. The WT complex is used as an example; the free energies of the molecular species along the association reaction are depicted as horizontal lines, and the energy changes according to the curve (black). The dotted vertical lines between the POUS domain and the HMG-DNA complex signify the HMG-POUS interactions in the intermediate ternary complex and both HMG-POUS and POUS-DNA interactions in the final ternary complex. The two energy barriers for the two steps of the association reaction are labeled as [HMG···POUS]‡ and [POUS···DNA]‡, respectively, where the dots between domains indicate favorable conformation required for the formation of the corresponding protein-protein and protein-DNA interactions. The energy curves of the two mutants are depicted in blue (HMG-POUSM···DNA) and green (HMGM···POUS-DNA), respectively (color online). For easy comparison, the starting energies for all three complexes were placed on the same level. For the two-step association reaction, the formation of the protein-protein interface is the rate-limiting step with a larger activation energy barrier; therefore, the HMGM···POUS-DNA mutant is the slowest of the three complexes to form the ternary complex with the largest first-step energy barrier. For the dissociation reaction, the separation of the POUS domain from the HMG-POUS interface is easiest for the HMGM···POUS-DNA mutant with the smallest second-step energy barrier, causing it to be the first one to dissociate.
According to this simple model, for the WT complex, the energy barrier for the first step is the dominant barrier, making the formation of the protein-protein interface between POUS and HMG the rate-limiting step for the association reaction. Similarly, when the energy curve is viewed from right to left for the dissociation reaction, the second step of breaking the HMG-POUS interface poses a larger energy barrier and is the rate-limiting step for the dissociation. For the HMG-POUSM···DNA mutant, the energy barriers of the association reaction are identical to those of the WT complex, leading to similar association rates for these two model complexes. For the dissociation reaction, it is easier to break the POUS-DNA interface in the HMG-POUSM···DNA mutant (smaller energy barrier), leading to a faster dissociation than observed in the WT complex. Finally, for the HMGM···POUS-DNA mutant, in the association reaction, the energy barrier for the HMG-POUS interface formation is the largest among the three complexes, causing it to be the slowest in forming ternary complex. For the dissociation reaction, the energy barrier for the breaking of the HMG-POUS interface is the smallest among the three model complexes, resulting in the fastest dissociation.
Our tethered-hopping model is consistent with existing sliding and hopping models of protein-DNA binding of binary complexes in that the speeds of association for the WT and the HMG-POUSM···DNA mutant complexes are similar, indicating that formation of the nonspecific protein-DNA interactions is sufficient to drive complex formation. These two complexes have identical energy barriers for the formation of nonspecific interactions, whereas the base-specific interactions mainly contribute to the interaction energy.
Of greater importance, our model demonstrates the critical role of protein partners in facilitating more efficient formation of ternary complexes as well as maintaining higher stability of the formed complexes. Simulations of the HMGM···POUS-DNA mutant may be approximated as studies of the POUS-DNA binary complex without any influence of cofactors. Our results demonstrate that without this cofactor, protein-DNA binding occurs most slowly among all three model complexes, and dissociation of the binary complex occurs most rapidly. Hence, we chose the term “tether” to encapsulate the positioning and constraining effects of the protein-protein interactions that are reflected in both the promotion of protein-DNA binding and the retardation of protein dissociation from DNA for the second transcription factor, respectively. Considering that partner transcription factors often bind to adjacent DNA control elements in cells, it is likely that a tether in the form of favorable protein-protein interactions between cofactor proteins would facilitate the hopping motions of transcription factors to their most favorable DNA-binding sites and help keep the partner proteins bound at the target sites for gene transcription.
In summary, we have simulated the association and dissociation of the POUS domain of the Oct1 protein with respect to the binary protein-DNA complex formed by the HMG domain of the Sox2 protein and the Hoxb1 control element. We found that the hydrophobic protein-protein interface between POUS and HMG is largely responsible for ensuring reliable ternary complex formation by positioning POUS correctly onto its DNA-binding site. This protein-protein interface also effectively prevents the dissociation of POUS. On the basis of these results, we propose a tethered-hopping model for protein-DNA binding in the presence of a cofactor that may be applicable to other similar protein-DNA complexes. However, we are still exploring several important unanswered questions in our laboratory. First, we are studying other types of mutant complexes in which either more conservative or more drastic mutations (which may affect secondary structures) are included. Second, we are considering the entropic effects of association and dissociation, especially the desolvation and resolvation of the binding surfaces of the proteins and DNA at several levels of complexity, to obtain a more accurate measure of the binding energy of the ternary complex. Third, we are investigating the reaction pathway of ternary complex formation between the HMG-POUS protein complex and its DNA-binding sites. We expect that a comparison with the work presented here will help validate or improve the tethered-hopping model and further our understanding of protein-DNA binding. Finally, because of the availability of the Sox2-Oct1-Hoxb1 ternary complex NMR structure, we only considered the mechanism of complex formation and dissociation in analogy to the hopping model in the presence of a cofactor. Our model does not specifically tackle the possibility of tethered-sliding or tethered-intersegmental exchange, due to the limited structural information available for these models. However, they may be probable and important reaction pathways to study in future work.
Acknowledgments
The authors thank Jingfang Wang, Tao Zhang, and Ruoxu Gu for motivating discussions; Youfang Cao (Shanghai Center for Systems Biomedicine, Shanghai Jiao Tong University) for providing the Lenovo DeepComp 1800 Cluster for data analysis; and Maoying Wu and Liang Yan for cluster administration.
This work was supported by the Postdoctoral Foundation of China (20060390993), National Sciences Foundation of China (30570199,20633060), Scientific and Technological Developmental Project of Shandong Province (2005GG4202020), National 863 Bioinformatics Project (2007AA02Z333), 973 Program (2005CB724303), and Chinese National Science Foundation (20773085 and 30870476 to D.W.).
Contributor Information
Yongxiang Shi, Email: shiyx@sdu.edu.cn.
Yuxiang Bu, Email: byx@sdu.edu.cn.
Dongqing Wei, Email: dqwei@sjtu.edu.cn.
Supporting Material
References
- 1.Halford S.E., Szczelkun M.D. How to get from A to B: strategies for analysing protein motion on DNA. Eur. Biophys. J. 2002;31:257–267. doi: 10.1007/s00249-002-0224-4. [DOI] [PubMed] [Google Scholar]
- 2.Halford S.E., Marko J.F. How do site-specific DNA-binding proteins find their targets? Nucleic Acids Res. 2004;32:3040–3052. doi: 10.1093/nar/gkh624. [DOI] [PMC free article] [PubMed] [Google Scholar]
- 3.Hu T., Grosberg A.Y., Shklovskii B.I. How proteins search for their specific sites on DNA: the role of DNA conformation. Biophys. J. 2006;90:2731–2744. doi: 10.1529/biophysj.105.078162. [DOI] [PMC free article] [PubMed] [Google Scholar]
- 4.Bonnet I., Biebricher A., Desbiolles P. Sliding and jumping of single EcoRV restriction enzymes on non-cognate DNA. Nucleic Acids Res. 2008;36:4118–4127. doi: 10.1093/nar/gkn376. [DOI] [PMC free article] [PubMed] [Google Scholar]
- 5.Gorman J., Greene E.C. Visualizing one-dimensional diffusion of proteins along DNA. Nat. Struct. Mol. Biol. 2008;15:768–774. doi: 10.1038/nsmb.1441. [DOI] [PubMed] [Google Scholar]
- 6.Wunderlich Z., Mirny L.A. Spatial effects on the speed and reliability of protein-DNA search. Nucleic Acids Res. 2008;36:3570–3578. doi: 10.1093/nar/gkn173. [DOI] [PMC free article] [PubMed] [Google Scholar]
- 7.Mirny L., Slutsky M., Kosmrlj A. How a protein searches for its site on DNA: the mechanism of facilitated diffusion. J. Phys. A Math. Theor. 2009;42:434013. [Google Scholar]
- 8.Slutsky M., Mirny L.A. Kinetics of protein-DNA interaction: facilitated target location in sequence-dependent potential. Biophys. J. 2004;87:4021–4035. doi: 10.1529/biophysj.104.050765. [DOI] [PMC free article] [PubMed] [Google Scholar]
- 9.Hu L., Grosberg A.Y., Bruinsma R. Are DNA transcription factor proteins Maxwellian demons? Biophys. J. 2008;95:1151–1156. doi: 10.1529/biophysj.108.129825. [DOI] [PMC free article] [PubMed] [Google Scholar]
- 10.Doucleff M., Clore G.M. Global jumping and domain-specific intersegment transfer between DNA cognate sites of the multidomain transcription factor Oct-1. Proc. Natl. Acad. Sci. USA. 2008;105:13871–13876. doi: 10.1073/pnas.0805050105. [DOI] [PMC free article] [PubMed] [Google Scholar]
- 11.Bewley C.A., Gronenborn A.M., Clore G.M. Minor groove-binding architectural proteins: structure, function, and DNA recognition. Annu. Rev. Biophys. Biomol. Struct. 1998;27:105–131. doi: 10.1146/annurev.biophys.27.1.105. [DOI] [PMC free article] [PubMed] [Google Scholar]
- 12.Rudnick J., Bruinsma R. DNA-protein cooperative binding through variable-range elastic coupling. Biophys. J. 1999;76:1725–1733. doi: 10.1016/S0006-3495(99)77334-0. [DOI] [PMC free article] [PubMed] [Google Scholar]
- 13.Becker O.M., MacKerell A.D., Jr., Roux B., Watanabe M. Marcel Dekker, CRC Press; New York: 2001. Computational Biochemistry and Biophysics. [Google Scholar]
- 14.Bhowmik R., Katti K.S., Katti D. Molecular dynamics simulation of hydroxyapatite-polyacrylic acid interfaces. Polymer (Guildf.) 2007;48:664–674. [Google Scholar]
- 15.Lu H., Schulten K. The key event in force-induced unfolding of Titin's immunoglobulin domains. Biophys. J. 2000;79:51–65. doi: 10.1016/S0006-3495(00)76273-4. [DOI] [PMC free article] [PubMed] [Google Scholar]
- 16.Sotomayor M., Schulten K. Single-molecule experiments in vitro and in silico. Science. 2007;316:1144–1148. doi: 10.1126/science.1137591. [DOI] [PubMed] [Google Scholar]
- 17.Isralewitz B., Gao M., Schulten K. Steered molecular dynamics and mechanical functions of proteins. Curr. Opin. Struct. Biol. 2001;11:224–230. doi: 10.1016/s0959-440x(00)00194-9. [DOI] [PubMed] [Google Scholar]
- 18.Izadpanah R., Trygg C., Bunnell B.A. Biologic properties of mesenchymal stem cells derived from bone marrow and adipose tissue. J. Cell. Biochem. 2006;99:1285–1297. doi: 10.1002/jcb.20904. [DOI] [PMC free article] [PubMed] [Google Scholar]
- 19.Williams D.C., Cai M.L., Clore G.M. Molecular basis for synergistic transcriptional activation by Oct1 and Sox2 revealed from the solution structure of the 42-kDa Oct1 center dot Sox2 center dot Hoxb1-DNA ternary transcription factor complex. J. Biol. Chem. 2004;279:1449–1457. doi: 10.1074/jbc.M309790200. [DOI] [PubMed] [Google Scholar]
- 20.Phillips J.C., Braun R., Schulten K. Scalable molecular dynamics with NAMD. J. Comput. Chem. 2005;26:1781–1802. doi: 10.1002/jcc.20289. [DOI] [PMC free article] [PubMed] [Google Scholar]
- 21.Feller S.E., MacKerell A.D. An improved empirical potential energy function for molecular simulations of phospholipids. J. Phys. Chem. B. 2000;104:7510–7515. [Google Scholar]
- 22.Mackerell A.D., Jr. Empirical force fields for biological macromolecules: overview and issues. J. Comput. Chem. 2004;25:1584–1604. doi: 10.1002/jcc.20082. [DOI] [PubMed] [Google Scholar]
- 23.Lin J., Seeman N.C., Vaidehi N. Molecular-dynamics simulations of insertion of chemically modified DNA nanostructures into a water-chloroform interface. Biophys. J. 2008;95:1099–1107. doi: 10.1529/biophysj.107.119230. [DOI] [PMC free article] [PubMed] [Google Scholar]
Associated Data
This section collects any data citations, data availability statements, or supplementary materials included in this article.