

Abstract
NMDA receptors are heteromeric glutamate-gated channels composed of GluN1 and GluN2 subunits. Receptor isoforms that differ in their GluN2-subunit type (A–D) are expressed differentially throughout the central nervous system and have distinct kinetic properties in recombinant systems. How specific receptor isoforms contribute to the functions generally attributed to NMDA receptors remains unknown, due in part to the incomplete functional characterization of individual receptor types and unclear molecular composition of native receptors. We examined the stationary gating kinetics of individual rat recombinant GluN1/GluN2B receptors in cell-attached patches of transiently transfected HEK293 cells and used kinetic analyses and modeling to describe the full range of this receptor's gating behaviors. We found that, like GluN1/GluN2A receptors, GluN1/GluN2B receptors have three gating modes that are distinguishable by their mean open durations. However, for GluN1/GluN2B receptors, the modes also differed markedly in their mean closed durations and thus generated a broader range of open probabilities. We also found that regardless of gating mode, glutamate dissociation occurred ∼4-fold more slowly (k− = 15 s−1) compared to that observed in GluN1/GluN2A receptors. On the basis of these results, we suggest that slow glutamate dissociation and modal gating underlie the long heterogeneous activations of GluN1/GluN2B receptors.
Abbreviations used: NMDA, N-methyl-d-aspartate; Glu, glutamate; Gly, glycine; MOT, mean open time; MCT, mean closed time; Po, open probability; HEPBS, N-(2-hydroxyethyl)piperazine-N′-(4-butanesulfonic acid); GluN1, glycine-binding NMDA receptor subunit (formerly NR1); GluN2, glutamate-binding NMDA receptor subunit (formerly NR2)
Introduction
NMDA receptors are Glu-activated ion channels that are essential for the development and function of central excitatory synapses (1–3). Their biological roles are largely determined by the amplitudes and durations of the ionic fluxes they mediate, which in turn depend on the channel-gating kinetics (4). NMDA receptors assemble as heterotetramers of two obligatory Gly-binding, ubiquitously expressed GluN1 subunits and two Glu-binding GluN2 subunits, which are expressed differentially as four distinct isoforms (A–D). Generally, GluN1/GluN2B receptors (2B) dominate at immature synapses, and GluN1/GluN2A receptors (2A) are preponderant at mature synapses (5–7). However, isoforms also show substantial overlap, and thus the exact molecular composition of native receptors remains elusive. Nevertheless, in recombinant systems, each isoform has distinct kinetics (8–13).
The kinetic characterization of native NMDA receptor responses has revealed unusual properties, i.e., a slow current rise (∼10–20 ms) and even slower relaxations (50 ms–1 s) (4,9,14). In addition, although neuronal NMDA receptors have a high affinity for the neurotransmitter Glu (1–3 μM) (15,16), only ∼30% of receptors appear to contribute to the peak response (17). Macroscopic studies with recombinant receptor isoforms demonstrated that 2B vs. 2A currents rise more slowly (12 vs. 7 ms) (18), have lower peak open probabilities (0.07 vs. 0.5) (18–20) and much longer relaxations (280 ms vs. 54 ms) (18,20,21), but have similar affinities for Glu (1–3 μM) (22,23). Due to the complex gating reaction of NMDA receptors, attempts to parse the mechanisms responsible for these differences have had to rely on single-channel studies.
At the single-channel level, NMDA receptor openings occur in bursts and clusters and can switch opening patterns, indicative of a multistate reaction mechanism and modal gating, respectively (24–28). Based on analyses of single-channel activity recorded from 2B receptors, Banke and Traynelis (20) proposed that, after they bind Glu and before they open, NMDA receptors transition through intermediate, preopen conformations that are sufficiently stable to be discerned in single-channel traces. This initial multistate gating mechanism explained the clustering of bursts and the slow rise of the macroscopic response, and helped investigators estimate microscopic rate constants for the 2B gating reaction. Similar mechanisms have been used to describe activations recorded from 2A and 2C isoforms, which suggests that a multistate gating mechanism is conserved across NMDA receptor isoforms (18,29,30). However, it is unknown whether this conservation also applies to modal gating.
Modal behavior has been observed in both neuronal and recombinant preparations (21,27), but thus far has been fully characterized only for 2A receptors (31,32). To investigate this aspect of 2B receptor activations, we recorded stationary single-channel currents from on-cell patches containing only one active channel. We found that, similarly to the 2A isoform, 2B receptors are capable of modal gating and can adopt three distinct gating patterns that differ in the mean duration of openings. However, in contrast to 2A receptors, 2B receptor modes also differ considerably in closed durations, which accounts for the broader range of observed open probabilities.
Materials and Methods
Details regarding the materials and methods used in this work are provided in the Supporting Material. In brief, HEK293 cells (ATCC CRL-1573) at passage 22–40 were used for calcium phosphate-mediated transfections with ∼1 μg cDNA per 35-mm dish of a mixture containing GluN1-1a (NR1-1a, U08261), GluN2B (NR2B, M91562), and GFP (1:1:1) (33). After a 2-h incubation, the precipitate was removed and cells were grown for 24–48 h in medium supplemented with 2 mM Mg2+ to prevent NMDA receptor-mediated cell death.
Single-channel currents were recorded with the cell-attached patch-clamp technique. Electrodes were pulled from borosilicate glass capillaries (BF150-86-10; Sutter Instrument Co., Novato, CA) and fire-polished to a final resistance of 15–25 MΩ when filled with (extracellular) solution containing (in mM) 150 NaCl, 2.5 KCl, 1 EDTA, 10 HEPBS (pKa, 8.3) pH 8 (NaOH), 0.1 Gly, and 1 Glu, as indicated (31).
Whole-cell currents were recorded with a pipette solution (intracellular) containing (in mM) 135 CsF, 33 CsOH, 2 MgCl2, 1 CaCl2, 10 HEPES, and 11 EGTA, adjusted to pH 7.4 (CsOH) and clamped at −70 mV. Cells were perfused with (extracellular) solutions containing (in mM) 150 NaCl, 2.5 KCl, 0.5 CaCl2, 0.01 EDTA, 0.1 Gly, and 1 Glu, or as indicated, in 10 mM HEPBS, pH 8 (NaOH) (33). The dose-response curve (see Fig. 4 C) was obtained by fitting the Hill equation to the means of steady-state current values obtained from 3–12 cells.
Figure 4.
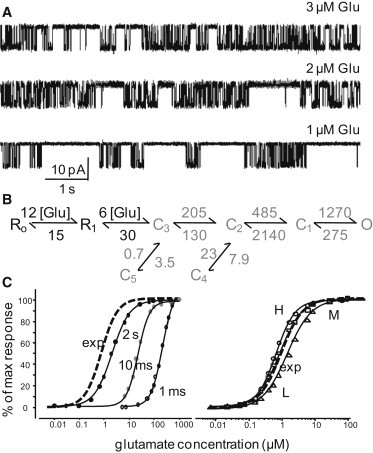
Slow dissociation of Glu from GluN1/GluN2B channels. (A) Portions of records obtained with three subsaturating Glu concentrations (indicated above each trace) and saturating Gly (0.1 mM). (B) Reaction mechanism illustrates association and dissociation rate constants (in μM−1s−1 and s−1, black) obtained from fits to entire single-channel records obtained at three Glu concentrations (3, 2, and 1 μM; n = 12); gating rate constants (in s−1, gray) represent the means of values obtained for each record at saturation (n = 31) with the simplified model illustrated. (C) Left: Experimental (whole-cell) dose response to 5-s pulses of 1 mM Glu (dotted line, EC50 = 1.5 μM) is superimposed, for easy comparison, on curves constructed from simulations with the model in panel B to 2-s, 10-ms, and 1-ms pulses of 1 mM Glu. Right: Experimental dose response (dotted line) superimposed on responses to 2-s pulses simulated with gating rates optimized for L- (▵), M- (□), or H-mode (○) activity.
To increase the chances of examining activity from only one channel, we selected records that were entirely free of simultaneous openings and had more than 4000 continuous events. Current traces were idealized in QuB (www.qub.buffalo.edu) with the SKM algorithm after digital low-pass filtering was performed at 12 kHz and a conservative dead time (0.15 ms, three samples) was imposed across all files. All subsequent analyses of idealized records were done in QuB with the MIL algorithm as described previously (31,34,35). The 2B data set analyzed consisted of 31 one-channel records, which represented ∼15 h of recording and contained >4 × 10⁶ events. As a point of reference, we compiled 12 records obtained previously from 2A receptors under identical experimental conditions (n = 7 (33) and n = 5 (36)), which totaled >8 h of recording and contained >3.3 × 10⁶ events. The significance of differences was evaluated with two-tailed Student's t-tests assuming equal variance, and expressed as fold-change = 2B/2A or % change = ((2B/2A) − 1) × 100; p-values < 0.05 were considered significant. Simulated ensemble currents were calculated from the models illustrated as the time-dependent migration into open states after a square jump into 1 mM Glu for the duration indicated, and assuming that at time zero all receptors occupied the resting, unliganded closed state. For kinetic analyses and dose-response fittings, traces were imported into Origin and analyzed in a manner similar to that used for the experimental macroscopic traces.
Results
Open probability of 2B receptors is low and variable
We examined the stationary gating kinetics of 2B receptors expressed in HEK293 cells by recording steady-state current traces in the presence of saturating concentrations of Glu (1 mM) and Gly (0.1 mM) from cell-attached patches that contained only one active receptor (Fig. 1 A). When averaged over the entire recorded period, the Po values varied considerably, as previously noted in macroscopic studies (21). To ensure adequate representation of gating behaviors, we increased the number of recordings to n = 31 (4 × 10⁶ events) and compared the new recordings with those recorded previously in our laboratory from 2A receptors under identical experimental conditions (n = 12; 3 × 10⁶ events) (33,36). We found that 2B receptors opened to amplitude levels similar to those of 2A receptors, but at equilibrium their Po was ∼3-fold lower (0.21 ± 0.03 vs. 0.65 ± 0.04) and varied over a wider range (0.02–0.49 vs. 0.4–0.8). These differences arose primarily from closures that were ∼6-fold longer (MCT, 39 ± 7 ms vs. 6 ± 1 ms) and more variable for 2B receptors (MCT range, 8–159 ms vs. 3–13 ms). In contrast, their mean open durations were only ∼2-fold shorter (MOT, 5.1 ± 0.4 ms vs. 12 ± 1 ms; Table 1, Fig. 1 B, and Table S1).
Figure 1.

Activity of individual GluN1/GluN2B channels in cell-attached patches. (A) Top: 50-s portions from two cell-attached records (left, patch 11; right, patch 20), each containing only one active 2B channel, are expanded in the 10 traces below (1 kHz) (middle). Bottom: The underlined segment is shown at higher resolution (12 kHz) below; openings are down. (B) Calculated equilibrium Po, MCT, and MOT durations for entire single-channel records of 2A (n = 12, gray) and 2B (n = 31, black) receptors. (C) Histograms of open and closed interval durations for patch 11 (37,796 events) overlaid with their respective probability distribution functions (thick lines) and individual exponential components (thin lines) calculated from a model with five closed and four open states; insets: time constants (ms) and areas (%) of illustrated exponential components. (D) Time constants for individual open components in all the 2B saturation records considered. Each record had two to four open components: τOfast (○, n = 31); τOL (▴, n = 20); τOM (□, n = 28); τOH (●, n = 13).
Table 1.
Properties of individual 2B receptor currents estimated from entire records
| Amplitude(pA) | Po | MOT(ms) | MCT(ms) | |
|---|---|---|---|---|
| GluN2A(n = 12) | 8.5 ± 0.4 | 0.65 ± 0.04 | 12 ± 1 | 6 ± 1 |
| range | 7–10 | 0.4–0.8 | 8–15 | 3–13 |
| GluN2B(n = 31) | 9.9 ± 0.2 | 0.21 ± 0.03 | 5.1 ± 0.4 | 39 ± 7 |
| range | 7–13 | 0.02–0.49 | 2–11 | 8–159 |
| p-value | 0.17 | < 0.001 | < 0.01 | < 0.001 |
| % change2B vs. 2A | −67% | −56% | +550% | |
In all records, the closed distributions had five components (EC1–EC5), whereas open distributions had anywhere from two to four components (Fig. 1, C and D). These results are comparable with those reported previously for 2A and 2C receptors, indicating that the basic gating mechanism is preserved among these isoforms (29). However, the durations of intracluster closures, τC1–C3, were all significantly longer for 2B receptors than for 2A receptors (p-value < 0.02), whereas τC4 and τC5, which were previously proposed to represent desensitized intervals (20), did not significantly differ between the two isoforms (p-value > 0.5; Fig. 2 A, Table S2). In contrast, except for the shortest open component (τOf ∼ 0.3 ms), which was similar for the two isoforms (p-value > 0.06), the remaining three longer open components detected (τOL, τOM, and τOH) were all ∼2-fold shorter for 2B receptors (p-value < 10−5; Fig. 2 A, Table S3). Based on this analysis, we propose that shorter openings and longer intracluster closures, but not longer desensitized periods, account for the lower-equilibrium Po of 2B receptors.
Figure 2.
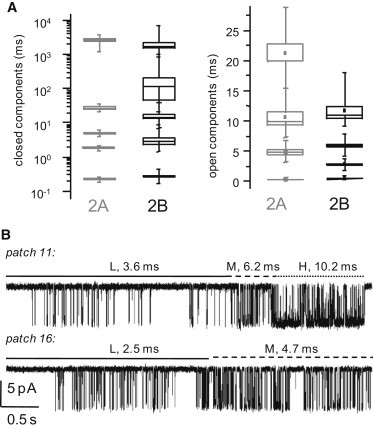
GluN1/GluN2B receptors undergo modal gating. (A) Statistical graphs (box, mean ± SE; whiskers, range) for 2A (gray, n = 12) and 2B (black, n = 31) receptors illustrate dissimilar ranges of time constants for closed, but not open, components. (B) Portions of single-channel traces selected from two separate records illustrate that spontaneous changes in the pattern of activity correlate with changes in the MOT: low (L), continuous line; medium (M), interrupted line; and high (H), dotted line.
Open distributions are indicative of modal gating
Within periods of homogeneous kinetics, the three NMDA receptor isoforms investigated in detail so far (2A, 2B, and 2C) have open interval distributions that include two components (29,31,37). In addition, during prolonged steady-state recordings, receptors can suddenly switch their gating mode, with modes lasting from seconds to minutes (31,32,34,38). For 2A receptors, we observe routinely three types of gating, each comprising of two open time components: low (L), 0.2 ms and 4.5 ms; medium (M), 0.2 ms and 10 ms; and high (H), 0.2 ms and 21 ms (31,32,34,35). Since the shortest open component (τOf) is similar for all three modes, and the longer ones (τOL, τOM, and τOH) differ considerably between modes, the number and duration of the longer time components within each record's open distribution have been used to assess to a first approximation modal gating during the period investigated. This coarse analysis does not indicate how long individual modes last or how many times they are visited during the record considered, but can rapidly indicate how many and which kinds of modes are adopted. Thus, two open components would be indicative of one mode throughout, three open components would indicate that the channel switches behavior at least once, and a record with four open components would most probably contain all three modes.
In the 2B data set examined, most records (27 of 31) had open distributions with more than two components (Fig. 1 D and Table S3), and within these records we often directly observed shifts in gating pattern. Although several discrete switches were distinguished clearly, these were not as numerous or as obvious as those observed in 2A traces. This was to be expected, however, because 2B currents have significantly longer closures and shorter openings, and thus differences in open durations between presumed modes would be less conspicuous. Still, based on the observation that most patches had more than two open components and the longer open components had similar durations from patch to patch (Figs. 1, A and D, and 2 B), we suspected that 2B receptors would also be capable of modal gating. To investigate activity within each mode, we identified and analytically separated distinct activity patterns as described below.
2B channels have distinct mean closed durations within each mode
To find periods with L-, M-, or H-activity (Fig. 3 A), we constructed open-duration stability plots by segmenting clusters of activity within each record into 1-s periods and estimating the mean duration of openings within each isochronous segment (31,34,35). When more than 10 consecutive segments had similar mean open durations (±1 SD), these were reconstituted as continuous periods (to include desensitized gaps) and were assigned to the L, M, or H category according to their mean open duration value (Table S3). Stretches shorter than 10 segments, even if they had uniform open durations, were not included in the subsequent analyses because often when they were joined, they did not contain sufficient events for fits with a 5C2O scheme. Similarly, segments whose MOTs deviated >1 SD from the mean for the considered chain were not considered further because they could not be assigned with confidence to a particular mode. With this procedure, we were able to isolate with reasonable confidence periods of homogeneous gating, and we accumulated sufficient events to attempt a kinetic characterization of separated modes.
Figure 3.

Kinetic mechanism of GluN1/GluN2B gating. (A) Representative traces of low, medium, and high activity patterns. (B) Histograms of open and closed interval durations for groups of low (patch 9; 36,548 events), medium (patch 26; 64,973 events), and high (patch 4; 64,333 events) periods. Thick lines represent probability density functions calculated from fits by a 5C2O model; thin lines represent individual exponential components; for each distribution, time constants (ms) and areas (%) are indicated. (C) Reaction mechanisms estimated from fits to (top, boxed) data in entire records and (bottom) data selected for each mode. All states represent receptor conformations fully bound with Glu and Gly (C, nonconductive; O, conductive). Rate constants above each arrow are in s−1 and represent means of the values estimated for each record: whole records, n = 31, 4.1 × 10⁶ events; low, n = 17, 3.7 × 10⁵ events; medium, n = 20, 1.8 × 10⁶ events; and high, n = 7, 4.9 × 10⁵ events. (D) Free-energy profiles for the equilibrium gating reaction calculated with the rate constants estimated for each mode and illustrated in panel C. Green, blue, and purple represent consistently results for low, medium, and high, respectively.
The L, M, and H traces identified with this procedure were analyzed together within each record. The cumulative results across all patches (L, n = 17; M, n = 20; and H, n = 7) showed that Po differed considerably between the three categories: ∼4-fold for L/M and ∼2-fold for M/H (Table 2). In contrast, MOT increased only twofold for both L/M and M/H transitions, suggesting that the large differences in Po between modes primarily reflected large differences in the closed durations (Table 2). This result sets 2B receptors apart from 2A receptors, for which differences in Po between modes were more modest (<2-fold) and originated primarily from differences in open durations (31,32,35). Further, for 2B receptors, the large modal differences in closed durations correlated with longer and more variable intracluster closed time components (τC1–C3; Table S4). The fourth closed exponential component, EC4, was variable and did not correlate in duration or area with overall Po. Of note, differences in τC5 across modes were not statistically significant (p-value > 0.5), suggesting that modal gating does not influence the stability of the principal desensitized state of 2B receptors. However, EC5 had a considerably larger area for lower Po modes (Table S4).
Table 2.
Kinetic properties of individual 2B receptors within modes
| Gating mode | Events(n) | Po | MOT(ms) | MCT(ms) |
|---|---|---|---|---|
| L (n = 17) | 3.7 × 10⁵ | 0.08 ± 0.02 | 2.5 ± 0.1 | 83 ± 12 |
| M (n = 20) | 1.8 × 10⁶ | 0.33 ± 0.02 | 5.5 ± 0.2 | 14 ± 2 |
| H (n = 7) | 4.9 × 10⁵ | 0.61 ± 0.02 | 9.6 ± 0.3 | 7 ± 1 |
Of importance, when single-channel traces were separated by mode as described above, the closed and open interval distributions had, in each instance, five closed and two open components (Fig. 3, A and B). This result is consistent with a fundamental gating mechanism for 2B receptors composed of five closed and two open states, as previously reported for this and other NMDA receptor isoforms (18,20,29,31,37).
Modes arise from stepwise changes in the height of free-energy barriers to opening
To inquire into the mechanism(s) responsible for modal kinetics, it was necessary to first establish an adequate model for stationary gating, in other words, to select a preferred sequence in which the five closed and two open states are accessed. A generally accepted kinetic scheme for NMDA receptor activation is still lacking. However, evidence is accumulating that a minimal model should include 1), at least two closed states interposed between ligand-binding and channel-opening (20,39); 2), two juxtaposed open states located distal to ligand-binding (31,35); and 3), two desensitized states, defined as the longest-lived fully-liganded closed states, most likely accessed from fully liganded preopen states (18,20,32,33). After these constraints were imposed, several schemes reproduced the sequence of openings and closures observed in single-channel data with log-likelihood (LL) values within the 10-unit threshold arbitrarily imposed as the best-fit criterion. Within this range, the models were ranked by their LL values, and the top-ranking model, illustrated in Fig. 3 C, was selected to estimate values for the postulated rate constants (Fig. S1).
The results from fits to data separated by mode showed that the diagnostic change in MOT across modes originates, as in the case of 2A receptors, from pronounced differences (∼2-fold) in the deactivation rate constant kO1-C1. However, in contrast to 2A receptors, where forward rates are very close in value across modes, changes in the forward rate constants for 2B receptors also contributed substantially to the observed differences in Po (Fig. 3 C). The observation that the forward rate constants are also slower than for 2A receptors and contribute to 2B's lower Po is consistent with previous results obtained in excised patches (18). We used the estimated rate constants to calculate changes in free energy across the reaction coordinate for the three modes. The resulting plot illustrates modal transitions as shifts in the stability of open states, but also highlights concurrent changes in the height of energy barriers toward open states (Fig. 3 D).
Alas, when calculated from kinetic schemes, free-energy diagrams are necessarily relative representations. Thus our results do not exclude the possibility that modes also differ in the stability of the initial state C3, which in our illustration was arbitrarily chosen as the reference state. To address this ambiguity, we reasoned that if state C3 had distinct free energies across modes, then Glu would dissociate with different kinetics from receptors gating in each mode. To test this, we next measured microscopic rate constants for Glu dissociation in each mode.
Regardless of mode, Glu dissociates slowly from 2B receptors
To examine microscopic Glu-binding kinetics, we recorded steady-state activity from one-channel patches at three subsaturating concentrations of Glu (3, 2, and 1 μM Glu, n = 4 for each) in the copresence of saturating concentrations of Gly (0.1 mM). Initially, these concentrations were chosen because they map at the midpoint of the macroscopic dose-response relationship, where activity is likely to be most sensitive to changes in Glu concentrations (40). Of importance, it also turned out that for these concentrations, the closed component whose mean duration was concentration-dependent, representing unliganded and monoliganded receptors, had mean lifetimes that were discernibly shorter than those of the desensitized component but still clearly outside clusters (34,41). This had practical value because it allowed us to choose records that most likely originated from only one channel by selecting those whose desensitized component had lifetimes similar to those estimated at saturation.
As expected, records obtained at these subsaturating concentrations displayed intercluster closures that increased in duration with decreasing Glu concentration, reflecting increasing lifetimes of unliganded and/or monoliganded receptors (Fig. 4 A). In contrast, the intracluster open and closed distributions remained essentially unchanged. From these records we separated L, M, and H periods, as described in the previous section, and fit the data in each group globally across concentrations with a simplified 5C1O scheme to which we appended two Glu-binding steps (18,20,35,42). We found that Glu binds to and dissociates from 2B receptors with similar kinetics regardless of mode (k+ = 6 × 10⁶ M−1s−1, k− = 15 s−1), which supports the interpretation that the C3 states in each mode have similar free energies (Fig. S2). Notably, although all rate constants were allowed to vary during the global fit, the rate constants for liganded gating obtained from this analysis (n = 12) closely reproduced those obtained from the saturation data set (n = 31).
In addition, the dose-response relationships simulated with our model (EC50, 2.2 μM; Fig. 4 B) paralleled those estimated from experimentally measured peak amplitudes of the whole-cell responses after long (5-s) pulses of 1 mM Glu (EC50, 1.5 μM; Fig. 4 C). These results further substantiate the conclusion that despite the considerable variability observed in the Po of the single-channel data set, the behaviors sampled represent a fair approximation of the whole-cell population. Of note, the simulated EC50 values decreased considerably (23 μM and 278 μM) for shorter pulses (10 ms and 1 ms). This result closely reproduced the previously reported observation that for recombinant and native NMDA receptors alike, Glu potency varies with pulse duration (20,43). The fact that our model reproduced this peculiar behavior further argues for its validity. The simulated dose-response relationships for L-, M-, and H-receptors point to only small differences across modes (Fig. 4 C), predicting a minimal influence of modal gating on EC50. Finally, the observation that Glu dissociation is similar across modes supports our proposal that differences in L, M, and H kinetics arise primarily from incremental changes in the height of energy barriers to opening coupled with a simultaneous change in the stability of open states.
Macroscopic desensitization is faster and deeper for low-mode gating receptors
The rate constants estimated in this study for entry into and exit from the desensitized state C5 were statistically similar across modes and also similar to those of 2A receptors (Fig. 3 C). This result would indicate that desensitization mechanisms and kinetics are preserved for these two isoforms. To test whether our model adequately reproduces the equilibration of macroscopic responses during steady application of agonists, we recorded whole-cell responses during 5-s applications of 1 mM Glu and compared the results with simulated traces (Fig. 5 and Table S5).
Figure 5.

Macroscopic responses of GluN1/GluN2B channels. (A) Whole-cell currents recorded from two cells; desensitization kinetics (τD) and extent (Iss/Ipk) are indicated for each trace. (B) Experimental traces in panel A (gray) are shown normalized to their peak current and superimposed on a trace simulated with the average model in Fig. 4B (black). (C) Left: Responses to a 5-s pulse simulated with L-, M-, or H-mode illustrate predicted differences in peak amplitudes. Right: The same traces shown at left are normalized to their respective peak response to illustrate predicted differences in the extent and kinetics of macroscopic desensitization.
The desensitization kinetics of our measured whole-cell responses varied considerably from one cell to the next and were close to those reported previously: τD = 620 ± 47 ms, range = 420–933 ms; Iss/Ipk = 0.60 ± 0.03, range = 0.41–0.76; n = 10 (Fig. 5 A) (20,21,37,44). Traces simulated with our model optimized by fits to entire single-channel recordings (Fig. 4 B) reproduced these results well: τD = 684 ms; Iss/Ipk = 0.50 (Fig. 5 B and Table S5). Simulations with mode-specific rate constants suggested that despite similar microscopic desensitization kinetics between modes (Fig. 3 C), the time course and extent of macroscopic desensitization are strongly mode-dependent, with receptors gating in lower Po modes desensitizing faster and deeper: L, τD = 0.22 s, Iss/Ipk = 0.46; M, τD = 0.79 s, Iss/Ipk = 0.82; and H, τD = 0.72 s; Iss/Ipk = 0.95 (Fig. 5 C and Table S5). This result adds to the growing realization that the macroscopic time course of desensitization does not necessarily signal changes in microscopic desensitization kinetics (33,36).
Discussion
Nearly all of the available information on NMDA receptor kinetics has been derived from whole-cell and excised-patch recordings. In both preparations, however, the integrity of the cellular membrane is compromised and the intracellular milieu is altered dramatically (45). NMDA receptor kinetics change upon patch excision: the peak amplitude of the macroscopic response decreases, the deactivation becomes faster, and desensitization becomes more pronounced with time after patch excision (4,46). Mechanical disruption of the cytoskeleton and the uncontrolled release of Ca2+ from intracellular stores may contribute to these observed changes (47–49). To investigate NMDA receptor kinetics in intact membranes, we characterized the stationary gating of recombinant 2B-type NMDA receptors residing in HEK293 cell membranes. We recorded long stretches of continuous activity from individual receptors with the cell-attached patch-clamp technique and subjected the resultant data to kinetic analyses and modeling.
We found that in attached patches, 2B receptors have higher Po (0.21 ± 0.03) and longer openings (5.1 ± 0.4 ms) than previously measured in excised patches (18–20,37). However, these parameters remained 2–3-fold lower than those measured from 2A receptors in attached patches (31,35). Perhaps as a result of the higher Po and longer open durations afforded by the on-cell preparation, we were able to visually discern several clear shifts in 2B stationary gating indicative of modal kinetics. However, these shifts were generally less obvious than those we observe routinely in 2A records, and our data did not allow us to measure how long the modes were or how often the switches occurred. Further, we analytically separated episodes with homogeneous open durations and characterized three modalities of gating that had strikingly different Po values (L, 0.08; M, 0.33; and H, 0.61). We traced the change in Po to both a decrease in mean open durations (L, 2.5 ms; M, 5.5 ms; and H, 9.6 ms) and a pronounced increase in mean closed durations (L, 83 ms; M, 14 ms; and H, 7 ms). However, the microscopic rate constants for Glu association and dissociation were similar regardless of gating mode (k+ = 6 × 10⁶ M−1s−1; k− = 15 s−1).
Modal gating behavior was first described for voltage-activated sodium channels as episodic changes in a channel's opening pattern (50). Many voltage- and ligand-gated channels display modal behavior, and controlling the time spent in individual modes provides a means of physiological regulation (51–56). For several channel types, the molecular mechanisms responsible for modal shifts have been traced to covalent modification of intracellular residues (52,57–59); binding of diffusible effectors, such as ligands (53) or G proteins (60,61); and interactions with transmembrane accessory subunits (62). The first report of modal gating for NMDA receptors came from the observation that the larger of the several ionic conductances activated by Glu in hippocampal neurons, i.e., NMDA receptors, have two modes of gating that are discernible by their distinct mean open durations (27). For the 2A isoform, this phenomenon was traced to a change in open-state stability, and in this work we report that 2B receptors are also prone to modal gating. Both isoforms have three distinct gating regimes, and it is likely that they occur through a conserved, although still unknown, molecular mechanism. A role for interactions with intracellular factors and/or covalent modification of intracellular residues has not been ruled out. However, the observation that modal gating persists in excised patches is also consistent with an intrinsic mechanism, perhaps involving low-probability intramolecular rearrangements (32).
We found that the changes in Po associated with modal gating were greater for 2B than for 2A isoforms. This was mostly because for 2B, in addition to changes in open-state stability, modal transitions also changed the height of the energy barriers to opening and thus the opening frequency. The kinetic schemes we developed for each gating mode predicted that shifts into lower Po modes would result in substantial decrements in the peak of the macroscopic current that follows a synaptic-like stimulation: L, 0.08; M, 0.41; and H, 0.57. This range of values accessible to 2B receptors is consistent with the wide range of experimentally measured peak Po values obtained in excised patches (0.07–0.33) (18–20,37). Similarly, the deactivation time constants predicted with our kinetic models (L, 80 ms, M, 341 ms, and H, 485 ms) were close in value to those reported for the fast and slow components of 2B-mediated responses in recombinant (τfast, 71–95 ms and τslow, 538–617 ms (20,21,37)) and synaptic (τfast, 30–63 ms and τslow, 250–460 ms (4,63)) preparations. These observations are also consistent with the hypothesis that, as demonstrated for 2A receptors, the biphasic nature of macroscopic relaxation is also indicative of kinetically distinct receptor populations (32).
On the basis of these results, we propose that the wide scatter in the values reported for macroscopic responses, including the open peak probability, deactivation, and desensitization kinetics, reflects kinetic heterogeneity due to modal gating within the population of channels assayed. It is tempting to speculate that the changes in NMDA receptor Po produced by the action of kinases and Ca2+-dependent phosphatases reflect shifts toward higher and lower Po modes, respectively. This hypothesis is consistent with the observed Ca2+-dependent increase in macroscopic desensitization observed in whole-cell preparations (42,47,49,64,65) and also with the change in desensitization observed upon shifts from extrasynaptic to synaptic sites (66).
Lastly, our data and analyses allowed us to estimate microscopic binding and dissociation rate constants for Glu, and to calculate the affinity of each binding site, k+/k− = 2.4 μM. We found that, as is the case with 2A receptors, Glu affinity was mode-independent, and that for all three modes the simulated dose-response curves were sensitive to pulse duration, as previously reported (40,43,67). Of importance, however, the microscopic dissociation rate constant estimated in this study (k− = 15 s−1) was fourfold lower than that of its 2A counterpart measured under identical conditions (35). This difference is notable for two reasons: first, the rate at which Glu dissociates from NMDA receptors influences the shape of the synaptic response (42); second, the ratio 2k−/kC3–C2 determines whether substantial Glu dissociation will occur before a channel ever opens after a brief, synaptic-like pulse (35). The latter prediction produces an apparent unsaturation as repetitive stimulation increases the peak current response (68,69). However, our model shows that this is fundamentally a population effect, since increasing the Glu concentration will not increase the peak response, but increasing the duration of Glu exposure will. This behavior was previously observed in whole-cell responses of both 2A and 2B receptors (43).
In summary, we used single-channel recording of receptors residing in intact patches, kinetic analyses, and modeling to develop kinetic schemes for 2B receptor gating. These kinetic schemes closely reproduced a series of well-documented macroscopic behaviors of 2B receptors, including kinetic heterogeneity, dose-response relationships that were sensitive to pulse duration, and slow deactivation. On the basis of these results, we propose that the minimal operational model developed here is well suited to describe single-channel and ensemble behaviors at equilibrium and under nonstationary conditions. We anticipate that this development will help elucidate the role played by separate receptor isoforms in synaptic function, and together with models developed for other receptor isoforms will be instrumental in providing a quantitative description of synaptic responses.
Acknowledgments
We thank N. Kaur and J. M. Myers for sharing one-channel traces, E. M. Kasperek for assistance with tissue culture and molecular biology, and S. F. Traynelis for valuable feedback and suggestions on the manuscript.
This work was supported in part by grants to G.K.P. from the National Institute of Neurological Disorders and Stroke (NS052669) and the American Heart Association (0535268N).
Supporting Material
References
- 1.Collingridge G.L., Lester R.A. Excitatory amino acid receptors in the vertebrate central nervous system. Pharmacol. Rev. 1989;41:143–210. [PubMed] [Google Scholar]
- 2.McBain C.J., Mayer M.L. N-methyl-d-aspartic acid receptor structure and function. Physiol. Rev. 1994;74:723–760. doi: 10.1152/physrev.1994.74.3.723. [DOI] [PubMed] [Google Scholar]
- 3.Sprengel R., Single F.N. Mice with genetically modified NMDA and AMPA receptors. Ann. N. Y. Acad. Sci. 1999;868:494–501. doi: 10.1111/j.1749-6632.1999.tb11318.x. [DOI] [PubMed] [Google Scholar]
- 4.Lester R.A., Clements J.D., Jahr C.E. Channel kinetics determine the time course of NMDA receptor-mediated synaptic currents. Nature. 1990;346:565–567. doi: 10.1038/346565a0. [DOI] [PubMed] [Google Scholar]
- 5.Li J.H., Wang Y.H., Vicini S. Developmental changes in localization of NMDA receptor subunits in primary cultures of cortical neurons. Eur. J. Neurosci. 1998;10:1704–1715. doi: 10.1046/j.1460-9568.1998.00169.x. [DOI] [PubMed] [Google Scholar]
- 6.Thomas C.G., Miller A.J., Westbrook G.L. Synaptic and extrasynaptic NMDA receptor NR2 subunits in cultured hippocampal neurons. J. Neurophysiol. 2005;95:1727–1734. doi: 10.1152/jn.00771.2005. [DOI] [PubMed] [Google Scholar]
- 7.Köhr G. NMDA receptor function: subunit composition versus spatial distribution. Cell Tissue Res. 2006;326:439–446. doi: 10.1007/s00441-006-0273-6. [DOI] [PubMed] [Google Scholar]
- 8.Moriyoshi K., Masu M., Nakanishi S. Molecular cloning and characterization of the rat NMDA receptor. Nature. 1991;354:31–37. doi: 10.1038/354031a0. [DOI] [PubMed] [Google Scholar]
- 9.Clements J.D., Westbrook G.L. Activation kinetics reveal the number of glutamate and glycine binding sites on the N-methyl-d-aspartate receptor. Neuron. 1991;7:605–613. doi: 10.1016/0896-6273(91)90373-8. [DOI] [PubMed] [Google Scholar]
- 10.Ishii T., Moriyoshi K. Molecular characterization of the family of the N-methyl-d-aspartate receptor subunits. J. Biol. Chem. 1993;268:2836–2843. [PubMed] [Google Scholar]
- 11.Monyer H., Sprengel R., Seeburg P.H. Heteromeric NMDA receptors: molecular and functional distinction of subtypes. Science. 1992;256:1217–1221. doi: 10.1126/science.256.5060.1217. [DOI] [PubMed] [Google Scholar]
- 12.Laube B., Kuhse J., Betz H. Evidence for a tetrameric structure of recombinant NMDA receptors. J. Neurosci. 1998;18:2954–2961. doi: 10.1523/JNEUROSCI.18-08-02954.1998. [DOI] [PMC free article] [PubMed] [Google Scholar]
- 13.Monyer H., Burnashev N., Seeburg P.H. Developmental and regional expression in the rat brain and functional properties of four NMDA receptors. Neuron. 1994;12:529–540. doi: 10.1016/0896-6273(94)90210-0. [DOI] [PubMed] [Google Scholar]
- 14.Dale N., Roberts A. Dual-component amino-acid-mediated synaptic potentials: excitatory drive for swimming in Xenopus embryos. J. Physiol. 1985;363:35–59. doi: 10.1113/jphysiol.1985.sp015694. [DOI] [PMC free article] [PubMed] [Google Scholar]
- 15.Patneau D.K., Mayer M.L. Structure-activity relationships for amino acid transmitter candidates acting at N-methyl-d-aspartate and quisqualate receptors. J. Neurosci. 1990;10:2385–2399. doi: 10.1523/JNEUROSCI.10-07-02385.1990. [DOI] [PMC free article] [PubMed] [Google Scholar]
- 16.Olverman H.J., Jones A.W., Watkins J.C. Structure/activity relations of N-methyl-d-aspartate receptor ligands as studied by their inhibition of [3H]D-2-amino-5-phosphonopentanoic acid binding in rat brain membranes. Neuroscience. 1988;26:17–31. doi: 10.1016/0306-4522(88)90124-8. [DOI] [PubMed] [Google Scholar]
- 17.Jahr C.E. High probability opening of NMDA receptor channels by L-glutamate. Science. 1992;255:470–472. doi: 10.1126/science.1346477. [DOI] [PubMed] [Google Scholar]
- 18.Erreger K., Dravid S.M., Traynelis S.F. Subunit-specific gating controls rat NR1/NR2A and NR1/NR2B NMDA channel kinetics and synaptic signalling profiles. J. Physiol. 2005;563:345–358. doi: 10.1113/jphysiol.2004.080028. [DOI] [PMC free article] [PubMed] [Google Scholar]
- 19.Chen N., Luo T., Raymond L.A. Subtype-dependence of NMDA receptor channel open probability. J. Neurosci. 1999;19:6844–6854. doi: 10.1523/JNEUROSCI.19-16-06844.1999. [DOI] [PMC free article] [PubMed] [Google Scholar]
- 20.Banke T.G., Traynelis S.F. Activation of NR1/NR2B NMDA receptors. Nat. Neurosci. 2003;6:144–152. doi: 10.1038/nn1000. [DOI] [PubMed] [Google Scholar]
- 21.Vicini S., Wang J.F., Grayson D.R. Functional and pharmacological differences between recombinant N-methyl-d-aspartate receptors. Int. J. Neurophysiol. 1998;79:555–566. doi: 10.1152/jn.1998.79.2.555. [DOI] [PubMed] [Google Scholar]
- 22.Chen N., Moshaver A., Raymond L.A. Differential sensitivity of recombinant N-methyl-d-aspartate receptor subtypes to zinc inhibition. Mol. Pharmacol. 1997;51:1015–1023. doi: 10.1124/mol.51.6.1015. [DOI] [PubMed] [Google Scholar]
- 23.Chen N., Murphy T.H., Raymond L.A. Competitive inhibition of NMDA receptor-mediated currents by extracellular calcium chelators. J. Neurophysiol. 2000;84:693–697. doi: 10.1152/jn.2000.84.2.693. [DOI] [PubMed] [Google Scholar]
- 24.Nowak L., Bregestovski P., Prochiantz A. Magnesium gates glutamate-activated channels in mouse central neurones. Nature. 1984;307:462–465. doi: 10.1038/307462a0. [DOI] [PubMed] [Google Scholar]
- 25.Howe J.R., Colquhoun D., Cull-Candy S.G. On the kinetics of large-conductance glutamate-receptor ion channels in rat cerebellar granule neurons. Proc R Soc Lond B Biol Sci. 1988;233:407–422. doi: 10.1098/rspb.1988.0030. [DOI] [PubMed] [Google Scholar]
- 26.Gibb A.J., Colquhoun D. Glutamate activation of a single NMDA receptor-channel produces a cluster of channel openings. Proc R Soc Lond B Biol Sci. 1991;243:39–45. doi: 10.1098/rspb.1991.0007. [DOI] [PubMed] [Google Scholar]
- 27.Jahr C.E., Stevens C.F. Glutamate activates multiple single channel conductances in hippocampal neurons. Nature. 1987;325:522–525. doi: 10.1038/325522a0. [DOI] [PubMed] [Google Scholar]
- 28.Stern P., Cik M., Stephenson F.A. Single channel properties of cloned NMDA receptors in a human cell line: comparison with results from Xenopus oocytes. J. Physiol. 1994;476:391–397. doi: 10.1113/jphysiol.1994.sp020140. [DOI] [PMC free article] [PubMed] [Google Scholar]
- 29.Dravid S.M., Prakash A., Traynelis S.F. Activation of recombinant NR1/NR2C NMDA receptors. J. Physiol. 2008;586:4425–4439. doi: 10.1113/jphysiol.2008.158634. [DOI] [PMC free article] [PubMed] [Google Scholar]
- 30.Erreger K., Chen P.E., Traynelis S.F. Glutamate receptor gating. Crit. Rev. Neurobiol. 2004;16:187–224. doi: 10.1615/critrevneurobiol.v16.i3.10. [DOI] [PubMed] [Google Scholar]
- 31.Popescu G., Auerbach A. Modal gating of NMDA receptors and the shape of their synaptic response. Nat. Neurosci. 2003;6:476–483. doi: 10.1038/nn1044. [DOI] [PubMed] [Google Scholar]
- 32.Zhang W., Howe J.R., Popescu G.K. Distinct gating modes determine the biphasic relaxation of NMDA receptor currents. Nat. Neurosci. 2008;11:1373–1375. doi: 10.1038/nn.2214. [DOI] [PMC free article] [PubMed] [Google Scholar]
- 33.Kussius C.L., Kaur N., Popescu G.K. Pregnanolone sulfate promotes desensitization of activated NMDA receptors. J. Neurosci. 2009;29:6819–6827. doi: 10.1523/JNEUROSCI.0281-09.2009. [DOI] [PMC free article] [PubMed] [Google Scholar]
- 34.Popescu G., Auerbach A. The NMDA receptor gating machine: lessons from single channels. Neuroscientist. 2004;10:192–198. doi: 10.1177/1073858404263483. [DOI] [PubMed] [Google Scholar]
- 35.Popescu G., Robert A., Auerbach A. Reaction mechanism determines NMDA receptor response to repetitive stimulation. Nature. 2004;430:790–793. doi: 10.1038/nature02775. [DOI] [PubMed] [Google Scholar]
- 36.Kussius C.L., Popescu G.K. Kinetic basis of partial agonism at NMDA receptors. Nat. Neurosci. 2009;12:1114–1120. doi: 10.1038/nn.2361. [DOI] [PMC free article] [PubMed] [Google Scholar]
- 37.Banke T.G., Dravid S.M., Traynelis S.F. Protons trap NR1/NR2B NMDA receptors in a nonconducting state. J. Neurosci. 2005;25:42–51. doi: 10.1523/JNEUROSCI.3154-04.2005. [DOI] [PMC free article] [PubMed] [Google Scholar]
- 38.Magleby K.L. Modal gating of NMDA receptors. Trends Neurosci. 2004;27:231–233. doi: 10.1016/j.tins.2004.03.001. [DOI] [PubMed] [Google Scholar]
- 39.Auerbach A., Zhou Y. Gating reaction mechanisms for NMDA receptor channels. J. Neurosci. 2005;25:7914–7923. doi: 10.1523/JNEUROSCI.1471-05.2005. [DOI] [PMC free article] [PubMed] [Google Scholar]
- 40.Anson L.C., Chen P.E., Schoepfer R. Identification of amino acid residues of the NR2A subunit that control glutamate potency in recombinant NR1/NR2A NMDA receptors. J. Neurosci. 1998;18:581–589. doi: 10.1523/JNEUROSCI.18-02-00581.1998. [DOI] [PMC free article] [PubMed] [Google Scholar]
- 41.Wyllie D.J., Béhé P., Colquhoun D. Single-channel activations and concentration jumps: comparison of recombinant NR1a/NR2A and NR1a/NR2D NMDA receptors. J. Physiol. 1998;510:1–18. doi: 10.1111/j.1469-7793.1998.001bz.x. [DOI] [PMC free article] [PubMed] [Google Scholar]
- 42.Lester R.A., Jahr C.E. NMDA channel behavior depends on agonist affinity. Int. J. Neurosci. 1992;12:635–643. doi: 10.1523/JNEUROSCI.12-02-00635.1992. [DOI] [PMC free article] [PubMed] [Google Scholar]
- 43.Chen N., Ren J., Murphy T.H. Changes in agonist concentration dependence that are a function of duration of exposure suggest N-methyl-d-aspartate receptor nonsaturation during synaptic stimulation. Mol. Pharmacol. 2001;59:212–219. doi: 10.1124/mol.59.2.212. [DOI] [PubMed] [Google Scholar]
- 44.Sornarajah L., Vasuta O.C., Raymond L.A. NMDA receptor desensitization regulated by direct binding to PDZ1-2 domains of PSD-95. J. Neurophysiol. 2008;99:3052–3062. doi: 10.1152/jn.90301.2008. [DOI] [PMC free article] [PubMed] [Google Scholar]
- 45.Suchyna T.M., Markin V.S., Sachs F. Biophysics and structure of the patch and the gigaseal. Biophys. J. 2009;97:738–747. doi: 10.1016/j.bpj.2009.05.018. [DOI] [PMC free article] [PubMed] [Google Scholar]
- 46.Clements J.D., Lester R.A., Westbrook G.L. The time course of glutamate in the synaptic cleft. Science. 1992;258:1498–1501. doi: 10.1126/science.1359647. [DOI] [PubMed] [Google Scholar]
- 47.Rosenmund C., Feltz A., Westbrook G.L. Calcium-dependent inactivation of synaptic NMDA receptors in hippocampal neurons. J. Neurophysiol. 1995;73:427–430. doi: 10.1152/jn.1995.73.1.427. [DOI] [PubMed] [Google Scholar]
- 48.Price C.J., Rintoul G.L., Raymond L.A. Inhibition of calcium-dependent NMDA receptor current rundown by calbindin-D28k. J. Neurochem. 1999;72:634–642. doi: 10.1046/j.1471-4159.1999.0720634.x. [DOI] [PubMed] [Google Scholar]
- 49.Rycroft B.K., Gibb A.J. Inhibitory interactions of calcineurin (phosphatase 2B) and calmodulin on rat hippocampal NMDA receptors. Neuropharmacology. 2004;47:505–514. doi: 10.1016/j.neuropharm.2004.06.001. [DOI] [PubMed] [Google Scholar]
- 50.Nilius B. Modal gating behaviour of single sodium channels from the guinea-pig heart. Biomed. Biochim. Acta. 1987;46:S662–S667. [PubMed] [Google Scholar]
- 51.Marrion N.V. Selective reduction of one mode of M-channel gating by muscarine in sympathetic neurons. Neuron. 1993;11:77–84. doi: 10.1016/0896-6273(93)90272-s. [DOI] [PubMed] [Google Scholar]
- 52.Groschner K., Schuhmann K., Romanin C. A type 2A phosphatase-sensitive phosphorylation site controls modal gating of L-type Ca2+ channels in human vascular smooth-muscle cells. Biochem. J. 1996;318:513–517. doi: 10.1042/bj3180513. [DOI] [PMC free article] [PubMed] [Google Scholar]
- 53.Ionescu L., White C., Mak D.O. Mode switching is the major mechanism of ligand regulation of InsP3 receptor calcium release channels. J. Gen. Physiol. 2007;130:631–645. doi: 10.1085/jgp.200709859. [DOI] [PMC free article] [PubMed] [Google Scholar]
- 54.Zhang P., Canessa C.M. Single-channel properties of recombinant acid-sensitive ion channels formed by the subunits ASIC2 and ASIC3 from dorsal root ganglion neurons expressed in Xenopus oocytes. J. Gen. Physiol. 2001;117:563–572. doi: 10.1085/jgp.117.6.563. [DOI] [PMC free article] [PubMed] [Google Scholar]
- 55.Lema G.M., Auerbach A. Modes and models of GABA(A) receptor gating. J. Physiol. 2006;572:183–200. doi: 10.1113/jphysiol.2005.099093. [DOI] [PMC free article] [PubMed] [Google Scholar]
- 56.Naranjo D., Brehm P. Modal shifts in acetylcholine receptor channel gating confer subunit-dependent desensitization. Science. 1993;260:1811–1814. doi: 10.1126/science.8511590. [DOI] [PubMed] [Google Scholar]
- 57.Marrion N.V. Calcineurin regulates M channel modal gating in sympathetic neurons. Neuron. 1996;16:163–173. doi: 10.1016/s0896-6273(00)80033-1. [DOI] [PubMed] [Google Scholar]
- 58.Müllner C., Yakubovich D., Schreibmayer W. Single channel analysis of the regulation of GIRK1/GIRK4 channels by protein phosphorylation. Biophys. J. 2003;84:1399–1409. doi: 10.1016/S0006-3495(03)74954-6. [DOI] [PMC free article] [PubMed] [Google Scholar]
- 59.Hashambhoy Y.L., Winslow R.L., Greenstein J.L. CaMKII-induced shift in modal gating explains L-type Ca(2+) current facilitation: a modeling study. Biophys. J. 2009;96:1770–1785. doi: 10.1016/j.bpj.2008.11.055. [DOI] [PMC free article] [PubMed] [Google Scholar]
- 60.Delcour A.H., Tsien R.W. Altered prevalence of gating modes in neurotransmitter inhibition of N-type calcium channels. Science. 1993;259:980–984. doi: 10.1126/science.8094902. [DOI] [PubMed] [Google Scholar]
- 61.Ivanova-Nikolova T.T., Nikolov E.N., Robishaw J.D. Muscarinic K+ channel in the heart. Modal regulation by G protein βγ subunits. J. Gen. Physiol. 1998;112:199–210. doi: 10.1085/jgp.112.2.199. [DOI] [PMC free article] [PubMed] [Google Scholar]
- 62.Luvisetto S., Fellin T., Pietrobon D. Modal gating of human CaV2.1 (P/Q-type) calcium channels: I. The slow and the fast gating modes and their modulation by β subunits. J. Gen. Physiol. 2004;124:445–461. doi: 10.1085/jgp.200409034. [DOI] [PMC free article] [PubMed] [Google Scholar]
- 63.Carmignoto G., Vicini S. Activity-dependent decrease in NMDA receptor responses during development of the visual cortex. Science. 1992;258:1007–1011. doi: 10.1126/science.1279803. [DOI] [PubMed] [Google Scholar]
- 64.Krupp J.J., Vissel B., Westbrook G.L. Calcium-dependent inactivation of recombinant N-methyl-d-aspartate receptors is NR2 subunit specific. Mol. Pharmacol. 1996;50:1680–1688. [PubMed] [Google Scholar]
- 65.Rycroft B.K., Gibb A.J. Regulation of single NMDA receptor channel activity by α-actinin and calmodulin in rat hippocampal granule cells. J. Physiol. 2004;557:795–808. doi: 10.1113/jphysiol.2003.059212. [DOI] [PMC free article] [PubMed] [Google Scholar]
- 66.Li B., Otsu Y., Raymond L.A. Developmental decrease in NMDA receptor desensitization associated with shift to synapse and interaction with postsynaptic density-95. J. Neurosci. 2003;23:11244–11254. doi: 10.1523/JNEUROSCI.23-35-11244.2003. [DOI] [PMC free article] [PubMed] [Google Scholar]
- 67.Erreger K., Geballe M.T., Traynelis S.F. Subunit-specific agonist activity at NR2A-, NR2B-, NR2C-, and NR2D-containing N-methyl-d-aspartate glutamate receptors. Mol. Pharmacol. 2007;72:907–920. doi: 10.1124/mol.107.037333. [DOI] [PubMed] [Google Scholar]
- 68.McAllister A.K., Stevens C.F. Nonsaturation of AMPA and NMDA receptors at hippocampal synapses. Proc. Natl. Acad. Sci. USA. 2000;97:6173–6178. doi: 10.1073/pnas.100126497. [DOI] [PMC free article] [PubMed] [Google Scholar]
- 69.Mainen Z.F., Malinow R., Svoboda K. Synaptic calcium transients in single spines indicate that NMDA receptors are not saturated. Nature. 1999;399:151–155. doi: 10.1038/20187. [DOI] [PubMed] [Google Scholar]
Associated Data
This section collects any data citations, data availability statements, or supplementary materials included in this article.