

Abstract
For biological molecules in aqueous solution, the hydration pressure as a function of distance from the molecular surface represents a very short-range repulsive pressure that limits atom-atom contact, opposing the attractive van der Waals pressure. Whereas the separation distance for molecules that easily arrange into ordered arrays (e.g., lipids, DNA, collagen fibers) can be determined from x-ray diffraction, many globular proteins are not as easily structured. Using a new micropipette technique, spherical, glassified protein microbeads can be made that allow determination of protein hydration as a function of the water activity (aw) in a surrounding medium (decanol). By adjusting aw of the dehydration medium, the final protein concentration of the solid microbead is controlled, and ranges from 700 to 1150 mg/mL. By controlling aw (and thus the osmotic pressure) around lysozyme, the repulsive pressure was determined as a function of distance between each globular, ellipsoid protein. For separation distances, d, between 2.5 and 9 Å, the repulsive decay length was 1.7 Å and the pressure extrapolated to d = 0 was 2.2 × 10⁸ N/m2, indicating that the hydration pressure for lysozyme is similar to other biological interfaces such as phospholipid bilayers.
Introduction
It is well known that proteins in aqueous solution are locally surrounded by water that has different properties from bulk water. This hydration water has fewer degrees of freedom, a longer residence time, and is more difficult to remove (lower water activity, aw) (1). Protein hydration has been measured as a function of aw, which is usually controlled by setting the relative humidity. The quantity of water retained or associated with the protein is then measured gravimetrically or by x-ray diffraction (2–4), Fourier transform infrared spectroscopy (5), nuclear magnetic resonance (6), or dielectric relaxation (7). These techniques all show that water in direct contact with the protein surface has a lower activity than bulk, and that water surrounding polar groups has lower activity still. In other words, more energy is required to remove the water that interacts directly with the amino acids at the protein surface than is required for water further away, i.e., water in its ideal standard state surrounded by other water molecules in bulk water. Physically then, there is a distance dependence of this energy (chemical potential of water) that has been seen experimentally to decay as an exponential. Consequently, when two hydrophilic surfaces are brought closely together (<20 Å) in an aqueous phase, there is an energy of repulsion that is much greater than that predicted by repulsive electrostatic and attractive van der Waals interactions (8,9). The general form of this hydration energy potential is Uhyd = Poλ exp(−d/λ), where λ is a decay length characteristic of the solvent size and surface geometry, d is the distance between surfaces, and Po, which varies according to surface properties, is the pressure extrapolated to d = 0, or, in terms of hydration pressure, Phyd = Po exp(−d/λ). We have found that a glassified state for a protein can be created when a single protein solution microdroplet is dehydrated in an organic solvent of controlled water activity. In the work reported here, the distance dependence of the interaction energy between protein molecules is measured using a simple packing model of protein-protein arrangements.
For molecules that easily arrange into ordered arrays (e.g., lipids, DNA, collagen fibers), the separation distance can be determined from x-ray diffraction (8–12). The aw in the sample can be adjusted by setting the relative humidity or by the osmotic stress method, in which a large solute such as dextran (11), poly(vinylpyrrolidone), or polyethylene glycol (PEG) is used to set the osmotic pressure, Πosm, of a surrounding phase. Water and small solutes diffuse between the two phases until the chemical potentials are equal (13). The chemical potential of water, μw = μo + kBT ln aw (where μo = chemical potential of pure water, T = 298 K, and kB is Boltzmann's constant), indicates the free energy change upon transferring one water molecule from the region between surfaces to water in its ideal standard state. The pressure between surfaces is then determined by dividing by the molecular volume of water, vw, or from Πosm = kBT/vw ln aw. Alternatively, the repulsive force can be measured directly by coating surfaces with the test molecules and bringing them together with a surface force apparatus (14–17) or atomic force microscope probe (17,18). This method has been used for molecules such as globular proteins that do not form ordered arrays but that can be adhered to a surface. However, it has the disadvantage that the surfaces are relatively rough and not well defined at the molecular level, making it more suitable for longer-range interactions. One must account for how proteins will order themselves at the boundary, and it becomes difficult to define the protein surface geometry (18,19).
Using a new micropipette technique, which allows us to quickly determine protein hydration as a function of aw in a surrounding medium, we have determined the separation distance between globular lysozyme (Lys) proteins by applying a packing model to dehydration and rehydration data. A microdroplet of protein solution is formed in a dehydration medium that removes bulk water, and then water of hydration, to an extent determined by the aw of the medium. In the case of Lys, this results in a spherical, single-phase, glassified protein bead. By knowing the initial Lys concentration in the microdroplet and by measuring the change in droplet diameter, we can calculate the amount of water remaining in the glassified microbead. In combination with the packing model, this allows us to calculate hydration pressure as a function of distance away from the protein surface. Hydration data determined in this manner is compared with vapor sorption data and other known values from the literature. The calculated pressure-distance relationship is presented and compared to those of other biological molecules.
Materials and Methods
Materials
Lys from chicken egg white was obtained from Sigma (St. Louis, MO) (3× crystallized and lyophilized, molecular mass = 14.7 kDa, 95% pure, L7651) and used as received. Solutions were prepared with DI water to concentrations ranging from 2 mg/mL to 85 mg/mL. n-decanol (>99% pure), hexamethyldisilazane, BaCl2, and polyethylene glycol (PEG) (3350 MW) were acquired from Sigma. Decanol was stored over 3 Å molecular sieves to keep it dry. Water content of dry decanol was determined by Karl Fischer titration. Anhydrous CaSO4 (i.e., Drierite) was acquired from W.A. Hammond Drierite (Xenia, OH). Ethanol and CuSO4 were acquired from Fisher Scientific (Fair Lawn, NJ). NaCl was acquired from Mallinckrodt Chemicals (Phillipsburg, NJ). MgCl2•6H2O was acquired from EM Science (Gibbstown, NJ). PEG (10,000 MW) was acquired from Alfa Aesar (Ward Hill, MA).
Single microdroplet dissolution and dehydration
The single microdroplet dissolution and dehydration technique is based on our previous work in which we used the micropipette setup to measure and model the dissolution of microparticles (10–100 μm diameter) in two-phase microsystems, including gas-in-liquid (20) and liquid-in-liquid (21,22) systems. Here, a Lys solution is the microdroplet phase and decanol is the dissolution medium. As shown in Fig. 1 and Movie S1 in the Supporting Material, when a water or solution microdroplet is expelled from the micropipette, the water immediately starts to dissolve in the surrounding decanol medium. As water leaves the microdroplet, the Lys concentration in the microdroplet increases. Ideally, this surrounding medium must be a separate liquid phase that is immiscible with the first phase and forms an interface, yet is able to dissolve the first phase.
Figure 1.
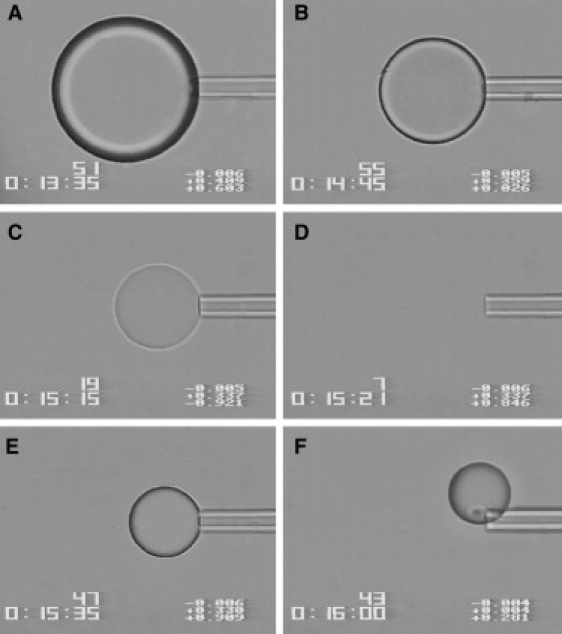
Videomicrographs (90 × 120 μm) of a Lys microdroplet dehydrating in a decanol (f = 0) drying medium. (A) 28 s, (B) 98 s, (C) 128 s, (D), 134 s, (E) 148 s, and (F) 173 s after forming the droplet on the micropipette tip. (D) Refractive index match. (F) Microbead, now a glass, being released from the micropipette.
For any aqueous dissolved solute, water of hydration is present to a greater or lesser extent according to the chemical potential equilibrium with water present in the surrounding medium. In the system presented here, a microdroplet of an aqueous Lys solution is dissolved into decanol, resulting in the almost complete removal of all bound water and the solidification of the protein as a glassified microbead. The raw data from a dissolution experiment is the measurement of microparticle diameter versus time from a video recording, noting any visually identifiable changes in refractive index, particle geometry, or phase separation at the droplet interfacial boundary or throughout the interior. By measuring the microdroplet diameter, the volume, Lys concentration, and water concentration within the droplet can be calculated as a function of time. Thus, the entire average microparticle concentration profile in situ is determined and calculated by assuming that the solute does not migrate into the drying medium, i.e., the solute mass in the microparticle is constant. For solutes that may be soluble or sparingly soluble (like Lys) in the suspending medium phase, this is experimentally controlled by saturating the suspending medium with the microparticle phase solute. The methods and analysis presented here introduce a technology platform that could be used to dehydrate not only protein molecules, but also a wide range of molecules (e.g., salts, sugars, DNA, polymers, and other small water-soluble molecules such as drugs).
The experimental setup includes an inverted optical microscope (Diaphot 200; Nikon, Melville, NY) with a 40× objective, micropipette manipulation system, and video capture equipment. A charge-coupled device camera (Optronics Engineering, Carl Zeiss, Wake Forest, IL) and multiplexer (Vista Electronics, La Mesa, CA) were interfaced with a videocassette recorder (SVHS; Panasonic, Secaucus, NJ) to capture time-stamped video. Measurements were obtained using a video caliper system (Vista Electronics). For some experiments, the camera system was modified to accommodate a larger field of view and digital acquisition. The camera (Pike F-100B; Allied Vision Technologies, Stadtroda, Germany) was controlled via a computer with StreamPix software (Norpix, Montreal, Quebec, Canada) and the captured video analyzed using ImageJ (National Institutes of Health, http://rsbweb.nih.gov/ij/). This increased the field of view from 90 × 120 μm to 180 × 180 μm while maintaining a resolution of 0.2 μm/pixel.
To minimize spreading of aqueous solution on the outer surface of the glass micropipette, the micropipettes were vapor-coated with a monolayer of hydrophobic hexamethyldisilazane. A 2-mm path-length cuvette (∼0.95 mL; Nova Biotech, El Cajon, CA) was used as the chamber, as seen in Fig. S1, A and B. All experiments were done at room temperature (∼22°C). The temperature in the chamber was monitored with a thermocouple during two experiments. As expected, the temperature increased slightly (1°C) to 23°C due to microscope illumination.
The amount of water in the drying solvent was established before the micropipette experiment by mixing known quantities of dry and water-saturated solvent. It was characterized by the ratio (saturation fraction, f) of the initial water concentration to the saturated water concentration. The resulting f-value is between 0 and 1, inclusive, and is equal to 0 when the drying medium is free of water and equal to 1 when it is fully saturated with water. All decanol solutions were saturated with Lys to prevent the loss of protein from the microbead. The solubility of Lys in wet decanol (f = 1) was estimated at <0.002 mg/mL based on absorbance at 280 nm. However, there was no detectable difference between results obtained from solutions presaturated with Lys and those that were not—indicating that any protein dissolution occurs more slowly than the timescale of the experiment.
Any solvent in which water is soluble and with which water can form an interface, i.e., is immiscible, can be used as a drying solvent. Decanol was chosen primarily because of its solubility properties. The solubility of decanol in water is low enough (∼0.01 vol %) that any decanol diffusing into the aqueous protein droplet is negligible in volume measurements, and the solubility of water in decanol is high enough that the water capacity of the chamber greatly exceeds the amount of water added from a droplet. For example, 0.9 mL of dry decanol (f = 0) has a capacity to dissolve ∼400,000 water microdroplets (50 μm diameter, 65.45 pL volume) with a solubility limit of 3.4 wt %. When f equals 0.9, the capacity is ∼40,000 water droplets. A single chamber was used for eight (or fewer) microdroplets, so it was assumed that the water added did not change the water concentration of the decanol phase. To minimize any influence from changes in the local water concentration due to water added from droplets, microbeads were held >1 cm from the air-decanol interface into the chamber to lose most of their water, then left >1 cm further in to ensure equilibration.
To begin the experiment, a micropipette was front-filled with a Lys solution, inserted into the decanol-filled chamber, and a microdroplet formed by applying positive pressure in the micropipette to force out the Lys solution into the drying medium (Fig. 1). When this microdroplet was at a desired diameter (50–110 μm), the pipette holder was gently tapped to release the droplet from the micropipette. The droplet was then quickly caught on the end of the micropipette by applying a slight suction. Droplets were typically watched under diffusion-controlled dissolution for the first 2–30 min until hardened, then released to settle to the bottom of the chamber and recorded periodically for the next 30–90 min. In some instances, convective transport of water from the droplet was achieved by moving the droplet through the solution while still on the end of the micropipette or by allowing the droplet to fall through solution while maintaining microscopic focus. At each saturation fraction, 7–19 droplets were measured.
Refractive index: protein concentration calculation
In preliminary experiments, we noticed that as the dissolution process occurred, the refractive index, n, of the Lys solution changed and at one point exactly matched that of the decanol, causing the droplet to become invisible (see Fig. 1 D and Movie S1). This observation allowed an in situ measurement to be made of Lys solution concentration at this n-match. To do this, a calibration curve was made of Lys solution n versus concentration, as shown in Fig. S2. Details of measurements and results are given in the Supporting Material.
Scanning electron microscopy (SEM)
SEM images were taken of single microbeads that had been dehydrated in decanol (see Supporting Material). In a separate experiment, SEM images were also taken of micropipette tips that had been used in experiments to confirm optical measurements of their diameter and our calibration of optical microscope video images.
Hydration analysis
Assuming that the Lys mass within the droplet is constant and the initial concentration, Ci, is known, the concentration, C, can be calculated from the measured droplet diameter. The calculated concentration at the n-match, Cn′, was compared to the expected concentration, Cn, and the ratio Cn/Cn′ = kn used as a correction factor in all concentration-based calculations (see the Supporting Material for details.) This in situ measurement of Lys concentration ensured the best estimate of the concentration just before solidification.
The protein specific volume, vp, was assumed to be constant at 0.7 mL/g, and corresponds to the van der Waals volume of a Lys molecule plus the volume inaccessible to the surface of a spherical solvent probe of 1.4 Å radius (23). From this assumption, the volume fraction of water, ϕw, can be calculated as
| (1) |
Note that ϕw is defined as the volume fraction of the droplet phase that is not occupied by Lys, i.e., we measured the total volume of the protein-water phase, which includes Lys, hydration water (equivalent to adsorbed water, or water in the hydration shell), and interstitial space. The hydration water ϕhyd is the water that is associated directly with the Lys surface. The volume fraction of the interstitial space, ϕint, is determined by the packing efficiency of the Lys molecules in the sample. Depending on the surrounding environment, this interstitial space may be occupied by water or other molecules, e.g., decanol or air, or be under vacuum as in SEM measurements. Therefore, ϕw is divided between hydration water (interacting with the protein) and interstitial space (present due to packing limitations of the protein) such that ϕw = ϕhyd + ϕint. The theoretical value of ϕint for the random jammed state of hard objects is 0.36 for spheres and 0.29 for prolate ellipsoids (1.5 aspect ratio) (24). We solved the problem of estimating the interstitial space by calculating ϕint from Eq. 1, assuming ϕhyd = 0 when the microbead is under dry (SEM vacuum ∼8 × 10⁻⁵ Pa, aw ∼10−8) conditions (as seen later in Fig. 5).
Figure 5.
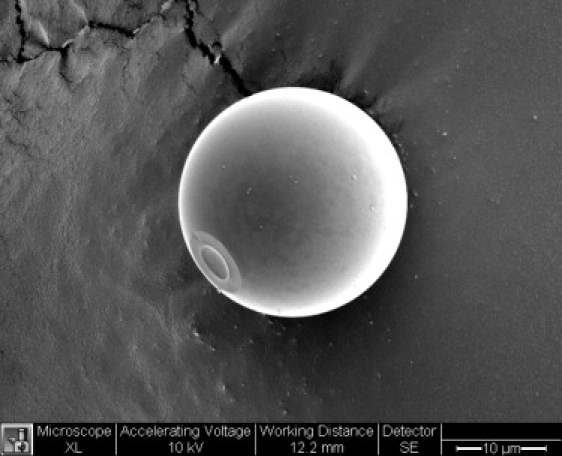
SEM image of a Lys microbead (diameter = 25.9 μm).
Given the molecular weights for water, MWw, and protein, MWp, and an appropriate density of water, ρw, the amount of hydration water, h, in g water/g protein can be calculated as
| (2) |
or as the number of water molecules per protein, nw,
| (3) |
Merzel and Smith (25) have shown that the density of water within the first monolayer (∼3 Å) around Lys is ∼5% denser than bulk water. We have therefore chosen ρw = 1.05 g/mL for the first monolayer (defined below) and 1 g/mL for any additional water.
The Lys molecule was approximated as a prolate ellipsoid, with minor radius a = 14 Å and major radius c = 21 Å. It was assumed that hydration water is evenly distributed in a shell around the protein as shown in Fig. 2. The distance, d, between Lys molecules was defined as the minimum distance between Lys surfaces, or twice the hydration shell thickness, x (in Å), which can be determined analytically for an ellipsoid with radii a and c from
| (4) |
where Vhyd (in Å3) is the hydration shell volume for a single Lys molecule, given as
| (5) |
Figure 2.
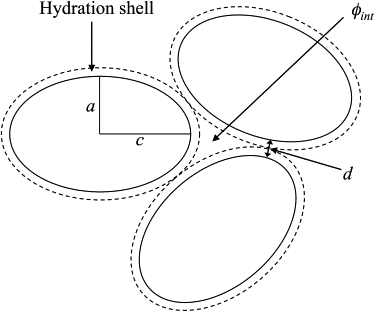
Two-dimensional schematic of the Lys packing model. Solid outlines represent the volume of Lys molecules with radii a and c. Dotted outlines represent the volume of hydration water, Vhyd. Also shown is the distance between molecules, d, and the interstitial volume fraction, ϕint.
The distance between Lys molecules is then d = 2x where x is the real root of Eq. 4.
Segatin and Klofutar (26) have measured the water solubility in decanol as a function of aw. We converted their water concentrations to saturation fractions and fitted the results to a polynomial function, which was used to relate f to aw (see Fig. S3).
Vapor sorption on lyophilized and dried microbead samples
To compare our hydration results with those obtained using a standard technique, we measured vapor absorption to bulk Lys samples. Lyophilized powder (15–20 mg) was placed in 1.7 mL tubes and vacuum dried. The open tubes were placed in sealed vials containing CaSO4 to remove any remaining water. This was taken to be the dry Lys mass. The open tubes were then transferred to sealed vials with saturated salt solution (MgCl2, NaCl, BaCl2, CuSO4) and allowed to equilibrate. The amount of absorbed water was determined gravimetrically. Samples were allowed to equilibrate until the mass was constant for 3–6 days. At low aw, this took as little as three days. For very high aw (>0.95), samples were left up to 33 days.
To verify whether Lys dehydrated with decanol has the same water sorption properties as lyophilized Lys, these experiments were repeated with glassified protein. Lys beads were prepared (N = 3) by adding 150 μL of 115 mg/mL Lys solution to 8.5 mL of decanol, resulting in f ∼0.6 due to water dissolving from the Lys solution into the decanol. The suspension was gently shaken by hand for 1 min. The samples were centrifuged at low speed to sediment the Lys microbeads and all but ∼1 mL of the decanol supernatant was removed. The samples were resuspended, transferred to 1.7 mL tubes, and washed three times with ethanol. The remaining ethanol was removed under vacuum, and the open sample tubes placed in sealed vials along with CaSO4 to remove any remaining water.
It is known that protein sorption isotherms exhibit hysteresis below aw ∼0.9 (27–31). For a given aw, proteins are typically more hydrated during desorption than absorption. We did a series of absorption and then desorption experiments so we could compare the results to our single droplet experiments, which are initially a dehydration process. Lyophilized samples were hydrated with salt solutions in order of increasing aw without drying between experiments. After exposure to 0.1 M NaCl or pure water for at least 14 days, they were equilibrated against the same salt solutions in order of decreasing aw.
Vapor sorption on single particles
An experiment was devised whereby we could rehydrate a previously dehydrated single Lys microbead. A microbead was created from a Lys solution in the micropipette and secured on the end of a micropipette as described for SEM imaging. The microbead was then removed from the decanol phase and exposed to different relative humidity atmospheres (see Supporting Materials) as volume changes were recorded. This allowed a comparison between gravimetric and volumetric vapor sorption experiments, and allowed us to measure sorption at much higher aw than could be achieved with decanol. Dehydration in decanol at f = 0.99 takes ∼100 times as long as in f = 0, which takes ∼3 min. During this time the water concentration established in the decanol-filled chamber changes due to solvent (or water) evaporation into the surrounding atmosphere. In bulk vapor sorption experiments, reaching equilibrium with a sample large enough to measure gravimetrically would take several days. By using a single microbead (1–30 ng of protein), equilibrium is reached within minutes, even for aw > 0.99.
Results
Refractive index: protein concentration verification
As shown in Fig. 1, there was a point during protein microdroplet dissolution into the alcohol medium during which the refractive indices of the two liquids matched and the microdroplet became optically invisible. Lys concentration was calculated based on volume throughout the whole experiment, but this point provided a way to accurately and independently measure the concentration at a point close to solidification. A calibration curve (n versus C) for Lys solutions is shown in Fig. S2. The linear trend-line, setting n at C = 0 to 1.3319 (our average value for DI water), is n = 1.3319 + 0.1943C (R2 = 0.9905, C here is in g/mL). This is consistent with the line obtained by Fredericks et al. (32), who found a slope of 0.2 mL/g. The refractive index of water-saturated decanol was measured as 1.4326, which intersects the Lys line at 518 mg/mL (Cn). This is the concentration at which the refractive indices of the concentrated Lys solution microdroplet and the immediate surrounding water-saturated decanol match and the droplet becomes invisible. For droplets made with Lys solution of known concentration and whose initial sizes could be accurately measured (N = 42 of 286), the average correction factor (kn = Cn/Cn′) was 1.01 ± 0.05, which confirms the accuracy of using the n-match to determine Lys concentration.
Microbead dehydration
One of the main findings from this work is that the dissolution of aqueous solvent from the protein solution microdroplet results in the solidification of the protein into a microbead, dehydrating the protein to a limit determined by the aw of the drying medium. A series of micrographs of the dehydration of a Lys microdroplet in decanol is shown in Fig. 1. The single microdroplet in this example was formed into dry decanol (f = 0) from a 60 mg/mL Lys solution. The first image shown is shortly after forming the droplet (28 s after releasing from the micropipette). The third and fourth frames show the droplet shortly before and during the n-match (128 s and 134 s after formation), respectively. The final frame shows the microbead, now solid, being released from the pipette (173 s after formation). It is important to note that there was no visible phase separation during dehydration, just a gradual refractive index change.
The diameter and Lys concentration for two representative droplets (Ci = 18.4 and 133.9 mg/ml Lys) are shown in Fig. 3 as a function of time, compared with a droplet of pure water (Ci = 0 mg/mL). The droplets were formed into decanol at f = 0 and held still for at least 300 s. The final diameter was found to be constant for hours (see Fig. S4) for droplets left in a capped chamber. As expected, the droplet with a higher Ci leveled off at a larger diameter. The final Lys concentration in the microbeads, however, was independent of Ci. Droplets that were allowed to solidify by a convective process (either falling through solution or being pulled through solution with the micropipette) solidified faster, but reached the same final equilibrium concentrations.
Figure 3.
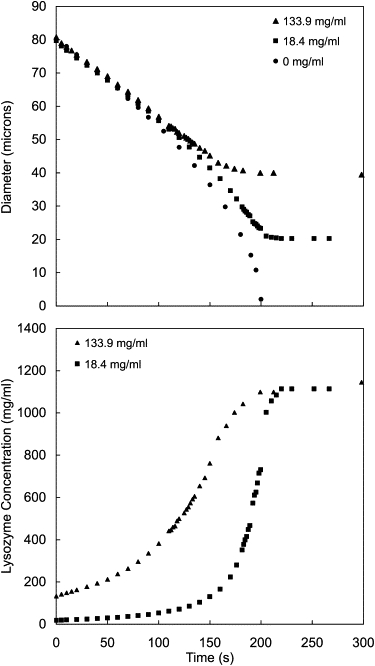
Diameter and Lys concentration as a function of time for droplets of Lys solution formed into decanol (f = 0). Calculated initial concentrations were 18.4 mg/mL (squares) and 133.9 mg/mL (triangles). For comparison, the diameter of a pure water droplet (circles) is also shown as a function of time.
Fig. 4 shows the diameter and Lys concentration of droplets formed into solutions of different f-values as a function of time. For comparison, droplets were chosen with similar initial diameters and concentrations. All were held on the micropipette tip and gently pulled through solution at about the same speed to maximize the dissolution rate by constantly exposing the droplets to solvent at the original f-value. As f decreased (drier decanol), the dissolution rate increased and the final Lys concentration increased, i.e., the microbeads were more dehydrated.
Figure 4.
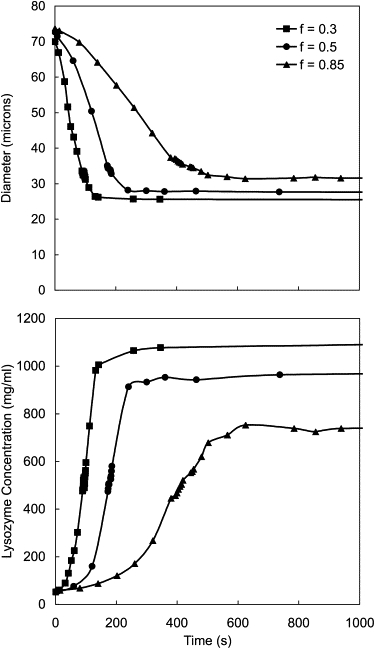
Diameter and Lys concentration as a function of time for droplets of Lys solution formed into decanol at f = 0.3 (squares), f = 0.5 (circles), and f = 0.85 (triangles). Calculated initial concentrations were 49.7 mg/mL (f = 0.3), 51.0 mg/mL (f = 0.5), and 49.8 mg/mL (f = 0.85).
SEM
For accurate calibration of our optical system, two different micropipette tips were measured with the optical video system as well as SEM. Multiple measurements of each tip gave 12.4 ± 0.1 and 11.5 ± 0.1 μm optically, and 12.3 ± 0.1 and 11.4 ± 0.2 μm with the SEM, which shows that optical measurements using the video caliper system are consistent with and as accurate as the much higher resolution SEM.
Several dried Lys microbeads were also imaged by SEM. A representative image of a microbead is shown in Fig. 5. As expected from optical observations, the microbeads are spherical with a smooth surface. The ring on the bottom left side of the microbead is from contact with the micropipette tip, consistent with that seen in Fig. 1 F. In the SEM environment, the microbead is considered completely dry, so it is at its smallest diameter. The microbead volume is therefore determined only by Lys volume and packing efficiency, i.e., ϕw = ϕint (note that ϕw represents the volume fraction not occupied by protein, whether occupied by water or under vacuum). The average concentration (N = 4) was 1329 ± 15 mg/mL. This corresponds to a volume fraction of the interstitial space ϕint = 0.07 ± 0.01. Thus Lys molecules can pack much more densely than equivalent hard ellipses, for which ϕint = 0.29 (24). The droplets were initially dehydrated using solutions ranging from f = 0.1 to f = 0.95. As expected, the concentration in the SEM environment was independent of the initial dehydration level.
(De)hydration isotherm
The hydration values determined from vapor sorption experiments are shown in Fig. 6. Error bars for h represent the standard deviation of the mean. Results from our gravimetric data of vapor sorption to lyophilized powder show hysteresis, i.e., protein hydration during desorption is higher than protein hydration during absorption for a given aw. At aw = 0.32 and aw = 0.75 this difference is about the same magnitude as the error in the measurement. The difference increases to 0.115 g/g at aw = 0.91. The two curves then converge again near aw ∼0.95. Hydration values determined from single-particle vapor sorption experiments (volumetric measurement) were consistent with bulk desorption data for aw ≥ 0.9.
Figure 6.
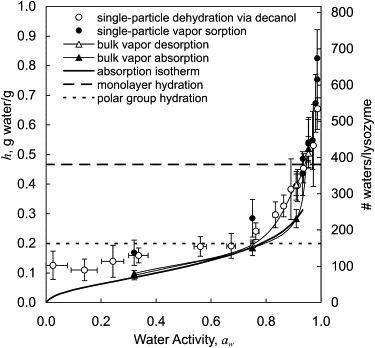
Lys dehydration and hydration as a function of aw as determined by the micropipette technique (open circles), the single-particle sorption technique (solid circles), and gravimetrically through vapor absorption (solid triangles) and desorption (open triangles). Solid lines through the bulk sorption points are only to guide the eye. For reference, a vapor absorption isotherm from the literature is shown (solid line) (30) as well as water coverage of polar groups (dotted line) (3,6,7,34) and full monolayer coverage (dashed line).
Lys beads that were dehydrated in decanol in a bulk sample had the same spherical, smooth, and clear appearance as single microbeads, and ranged in size from 1 to 20 μm, with most <10 μm (as observed by optical microscopy). The beads (after removing solvent and thoroughly drying) absorbed the same amount of water as samples of lyophilized powder at the two values of aw tested, 0.32 and 0.95.
Equilibrium hydration levels were determined for microdroplets dehydrated in decanol ranging from f = 0.01 to f = 0.95 (0.025 ≤ aw ≤ 0.987). The equilibrium hydration level is shown as a function of aw in Fig. 6 along with vapor sorption data. Error bars for aw were calculated assuming that our dry decanol is at f = 0.01 ± 0.02 (as estimated by Karl Fischer titration), and that our saturated decanol is at f = 1 ± 0.01. Intermediate solutions were prepared by mixing known ratios of the two.
In all cases, a higher aw in the surrounding medium resulted in a higher water content in the final protein phase. At aw > 0.8, the decanol dehydration data correspond well with the desorption isotherm and with single-particle vapor sorption data. At aw < 0.8 the protein beads show higher levels of hydration than vapor sorption on bulk samples. Table 1 summarizes hydration values determined from vapor sorption and decanol dehydration experiments for select values of aw, as well as values from the literature.
Table 1.
Lysozyme hydration, h, determined by different methods
|
aw = 0.75 |
aw = 0.91 |
aw = 0.95 |
||||
|---|---|---|---|---|---|---|
| h (g/g ± SD) | N | h (g/g ± SD) | N | h (g/g ± SD) | N | |
| Hydration | ||||||
| Bulk vapor sorption | 0.18 ± 0.03 | 6 | 0.28 ± 0.03 | 6 | 0.52 ± 0.04 | 9 |
| Sorption calorimetry∗ | 0.18 | — | 0.29 | — | 0.41 | — |
| Dehydration | ||||||
| Decanol dehydration† | 0.24 ± 0.03 | 17 | 0.40 ± 0.05 | 13 | 0.54 ± 0.09 | 13 |
| Single-particle vapor sorption | 0.28 ± 0.06 | 2 | 0.39 ± 0.05 | 4 | 0.54 ± 0.08 | 3 |
| Bulk vapor sorption | 0.20 ± 0.01 | 4 | 0.40 ± 0.04 | 7 | 0.51 ± 0.03 | 7 |
| Sorption calorimetry∗ | 0.24 | — | 0.47 | — | 0.51 | — |
Sorption calorimetry data taken from Fig. 3 in Kocherbitov et al. (29).
Water activities calculated from f = 0.51, 0.75, and 0.85, are 0.76, 0.91, and 0.96, respectively.
Hydration potential
Πosm and μw were calculated from aw and plotted as a function of the equilibrium distance between proteins, d, for our decanol dehydration and single-particle vapor sorption results. The results are shown in Fig. 7 along with lines representing the distances that correspond to polar amino-acid group and monolayer water coverage. (Note that as this is the distance between two protein molecules, monolayer coverage includes two layers of water.)
Figure 7.
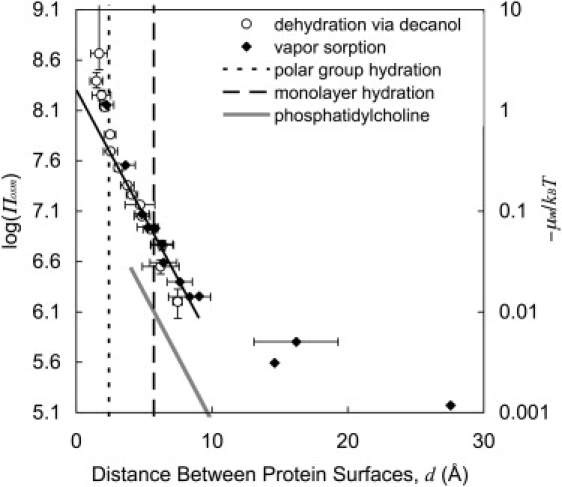
Πosm and μw as a function of the distance between protein surfaces for microbead dehydration (open circles) and single-particle vapor sorption (solid diamonds). The solid line represents the best linear fit to the data for 0.67 < aw < 0.988 extrapolated to d = 0. For reference, distances corresponding to water coverage of polar groups (dotted line) (3,6,7,34) and full monolayer coverage (dashed line) are shown. The shaded line shows the region of hydration pressure for egg phosphatidylcholine bilayers (4 < d < 12 Å, λ = 1.7 Å, and Po = 4 × 10⁷ N/m2) (33).
At very close distances (d < 2.5 Å), the pressure between proteins increases rapidly with continued dehydration. This region corresponds to aw < 0.7 and water coverage of only polar groups (or less). Importantly though, for 2.5 Å < d < ∼9 Å (0.67 < aw < 0.986), the pressure decreases log-linearly with the decay constant λ = 1.7 Å and Po = 2.2 × 10⁸ N/m2 (R2 = 0.948).
Discussion and Conclusions
The decay length for the region for 2.5 Å < d < 9 Å (the rest of the first monolayer and part of a second layer of water) is within the range of values found for lipid bilayers (1–3 Å) or DNA (1.3–4 Å) (8). (It should be kept in mind that the pressures and energies presented here are in terms of the total interaction energy, i.e., electrostatic and van der Waals interactions have not been subtracted.) Fig. 7 includes a line representing the range of hydration pressure for egg phosphatidylcholine (λ = 1.7 Å and Po = 4 × 10⁷ N/m2 for 4 Å < d < 12 Å) (33). Experiments performed with different lipids in different solvents have shown that the decay length depends on solvent density and is ∼2 Å in water (9,33). Values for Po range from 107 to 1011 N/m2, depending on the nature of the lipid (specifically, Po increases with increasing dipole potential (9)) and on how d = 0 is defined (9,12). Due to the different method of measurement, our value for Po cannot be directly compared to lipids, but is in the same range of magnitudes.
Beyond d ∼9 Å there is clearly a transition to a region where the pressure decays more slowly with distance. The decay length in this region is ∼10 Å, which is the same magnitude we would expect for the Debye length, assuming the ionic strength is due primarily to counterions in solution. To the best of our knowledge this is the first time that pressures between globular proteins have been determined at such close distances. Blomberg et al. (14,19) measured the force between Lys-coated mica surfaces for d ∼20–350 Å. Claesson et al. (15) measured the force between insulin-coated surfaces and concluded that there was a transition to hydration/steric forces near 10 Å, but did not have the resolution to measure these forces. In both studies, calculated electrostatic and van der Waals forces matched the experimental data well at large distances (>10–20 Å), but they could not clearly examine close contact. There is enough resolution in our data to conclude that the pressure-distance relationship is exponential, and that there is a transition to electrostatic repulsion near d ∼9 Å. Calculations of these forces that account for the geometry of our system and the effect of ionic strength (which increases as water is removed and ion concentration increases) are being modeled.
Included in Figs. 6 and 7 are lines representing the water necessary for coverage of charged and polar amino-acid side chains (generally regarded as bound water) and full monolayer coverage. The value for polar coverage, 0.20 ± 0.07 g/g (∼160 waters/Lys), is an average of results from the literature for transitions in excess heat capacity (34), dielectric relaxation (7), nuclear magnetic resonance (6), and x-ray diffraction (waters with at least one hydrogen bond) (3). Beyond this bound water, the definition of full hydration differs. Although h ∼0.3–0.4 g/g is generally regarded as monolayer coverage, calculations based on surface area claim anywhere from 300 to 900 molecules for monolayer coverage of Lys (6,34–37). The value we have chosen for full monolayer coverage, 0.47 g/g (∼380 waters/Lys), corresponds to d = 5.6 Å, which is approximately the thickness of two water molecules. It must be stressed that although reasonable, this is only an approximate value. The amount of water that occupies the volume of the first monolayer depends on its density. Molecular dynamics simulations have shown that water is denser around charged groups, and less dense near hydrophobic regions (25,38,39). The calculated average density also depends on how the interface between protein and water is defined (39). Because single-particle measurements are based on volume, h and nw depend on ρw, but d does not. For example, if ρw in the monolayer varies from 0.95 to 1.15 g/ml, h varies from 0.42 to 0.51 g/g, but all calculations of d, and therefore λ and Po, remain unchanged.
For aw < 0.75, the hydration level from decanol dehydration is higher than the bulk vapor sorption results by 0.07 g/g. This is not entirely unexpected. It has been shown that water sorption isotherms for proteins in organic solvents are comparable to those in air, i.e., hydration depends on aw, not water concentration (40). However, differences have been found when there is an interaction between the solvent and protein (31,40,41). Because we are measuring volume changes of the protein phase, we cannot determine whether the nonprotein volume of the phase is occupied by decanol or water. Assuming a bulk density of decanol of 0.83 g/mL, 5–6 decanol molecules per protein molecule would account for the volume difference we see for aw < 0.75. This interpretation is consistent with our other experiments. When the microbeads were dried for SEM imaging, the decanol would have evaporated, leaving the volume that corresponds to 0 g/g. When the decanol was removed from our bulk microbead samples by washing with ethanol, the sorption properties were identical to that of lyophilized powder.
In terms of the distance between protein surfaces, the region for aw < 0.75 corresponds to d < 2.5 Å (the region of polar coverage). The short decay length may indicate steric interactions, as side-chain movement is greatly reduced, or it may be artificially short due to the presence of decanol. In either case, this region was not used to evaluate hydration potential.
We assumed that the water concentration in the droplet reached equilibrium by the end of an experiment and that it was not kinetically trapped, i.e., that a shell of dried protein did not encapsulate regions of lower protein concentration within the microbead. Thus, the final water concentration (and therefore protein concentration) in the droplet should only be a function of aw. As verification, we compared the three controllable parameters (initial droplet size, initial protein concentration, and droplet movement or dissolution rate) to the final Lys concentration in the microbeads for every f-value tested. (See Table S1 for details of the ranges tested.) Final concentrations were independent of each of the three parameters. We also found no correlation between the final protein concentrations and the calculated concentration at the n-match, Cn′, compared to the expected concentration, Cn (represented as the correction factor, kn), suggesting no systematic error was introduced. The fact that the correction factor was so close to 1 also verifies that this technique can be used to accurately calculate solute concentrations when initial conditions are known. At values of aw at which all three methods were used (aw = 0.75, 0.91, 0.95) there is reasonable agreement between our values and those obtained by Kocherbitov ((29), and see our Table 1) and no statistically significant difference between single-particle (volumetric) and bulk (gravimetric) dehydration values, which supports our packing model.
In addition to obtaining hydration information for biological molecules, the technique has potential applications in biocatalysis, protein preservation, and drug delivery. Enzymes have been known to retain activity in organic solvents, particularly when added as an aqueous solution (42). By directly observing the dehydration of a single protein solution droplet, this technique can be used to quickly identify the amount of water retained for a given protein-solvent system. The process also offers an alternative to lyophilization. Decanol removes water relatively quickly (minutes, depending on the dehydration medium), at room temperature and without the presence of ice crystals, which can be damaging to protein secondary structures (43,44). Additionally, our ability to control particle size without milling provides an advantage in drug delivery where small, spherical particles are desirable for encapsulation within polymers and other gel matrices (45).
Acknowledgments
This work was supported by grant No. EB005030 from the National Institutes of Health.
Supporting Material
References
- 1.Wolfe J., Bryant G., Koster K.L. What is ‘unfreezable water’, how unfreezable is it, and how much is there? Cryo Letters. 2002;23:157–166. [PubMed] [Google Scholar]
- 2.Dobrianov I., Kriminski S., Thorne R.E. Dynamic response of tetragonal lysozyme crystals to changes in relative humidity: implications for post-growth crystal treatments. Acta Crystallogr. D Biol. Crystallogr. 2001;57:61–68. doi: 10.1107/s0907444900014578. [DOI] [PubMed] [Google Scholar]
- 3.Kodandapani R., Suresh C.G., Vijayan M. Crystal structure of low humidity tetragonal lysozyme at 2.1-Å resolution. Variability in hydration shell and its structural consequences. J. Biol. Chem. 1990;265:16126–16131. doi: 10.2210/pdb4lym/pdb. [DOI] [PubMed] [Google Scholar]
- 4.Nagendra H.G., Sudarsanakumar C., Vijayan M. Characterization of lysozyme crystals with unusually low solvent content. Acta Crystallogr. D Biol. Crystallogr. 1995;51:390–392. doi: 10.1107/S0907444994009790. [DOI] [PubMed] [Google Scholar]
- 5.Careri G., Giansanti A., Gratton E. Lysozyme film hydration events: an IR and gravimetric study. Biopolymers. 1979;18:1187–1203. doi: 10.1002/bip.1979.360180512. [DOI] [PubMed] [Google Scholar]
- 6.Fullerton G.D., Ord V.A., Cameron I.L. An evaluation of the hydration of lysozyme by an NMR titration method. Biochim. Biophys. Acta. 1986;869:230–246. doi: 10.1016/0167-4838(86)90063-4. [DOI] [PubMed] [Google Scholar]
- 7.Pethig R. Protein-water interactions determined by dielectric methods. Annu. Rev. Phys. Chem. 1992;43:177–205. doi: 10.1146/annurev.pc.43.100192.001141. [DOI] [PubMed] [Google Scholar]
- 8.Leikin S., Parsegian V.A., Rand R.P. Hydration forces. Annu. Rev. Phys. Chem. 1993;44:369–395. doi: 10.1146/annurev.pc.44.100193.002101. [DOI] [PubMed] [Google Scholar]
- 9.McIntosh T.J., Simon S.A. Hydration and steric pressures between phospholipid bilayers. Annu. Rev. Biophys. Biomol. Struct. 1994;23:27–51. doi: 10.1146/annurev.bb.23.060194.000331. [DOI] [PubMed] [Google Scholar]
- 10.Leikin S., Rau D.C., Parsegian V.A. Direct measurement of forces between self-assembled proteins: temperature-dependent exponential forces between collagen triple helices. Proc. Natl. Acad. Sci. USA. 1994;91:276–280. doi: 10.1073/pnas.91.1.276. [DOI] [PMC free article] [PubMed] [Google Scholar]
- 11.LeNeveu D.M., Rand R.P., Parsegian V.A. Measurement of forces between lecithin bilayers. Nature. 1976;259:601–603. doi: 10.1038/259601a0. [DOI] [PubMed] [Google Scholar]
- 12.Rand R.P., Parsegian V.A. Hydration forces between phospholipid bilayers. Biochim. Biophys. Acta. 1989;988:351–376. [Google Scholar]
- 13.Parsegian V.A., Rand R.P., Rau D.C. Osmotic stress for the direct measurement of intermolecular forces. Methods Enzymol. 1986;127:400–416. doi: 10.1016/0076-6879(86)27032-9. [DOI] [PubMed] [Google Scholar]
- 14.Blomberg E., Claesson P.M., Tilton R.D. Interaction between adsorbed layers of lysozyme studied with the surface force technique. Langmuir. 1994;10:2325–2334. [Google Scholar]
- 15.Claesson P.M., Arnebrant T., Nylander T. Direct measurements of the interaction between layers of insulin adsorbed on hydrophobic surfaces. J. Colloid Interface Sci. 1989;130:457–466. [Google Scholar]
- 16.Israelachvili J., Marra J. Direct methods for measuring conformational water forces (hydration forces) between membrane and other surfaces. Methods Enzymol. 1986;127:353–360. doi: 10.1016/0076-6879(86)27029-9. [DOI] [PubMed] [Google Scholar]
- 17.Leckband D. Measuring the forces that control protein interactions. Annu. Rev. Biophys. Biomol. Struct. 2000;29:1–26. doi: 10.1146/annurev.biophys.29.1.1. [DOI] [PubMed] [Google Scholar]
- 18.Bowen W.R., Hilal N., Wright C.J. Direct measurement of interactions between adsorbed protein layers using an atomic force microscope. J. Colloid Interface Sci. 1998;197:348–352. doi: 10.1006/jcis.1997.5247. [DOI] [PubMed] [Google Scholar]
- 19.Blomberg E., Claesson P.M., Fröberg J.C. Surfaces coated with protein layers: a surface force and ESCA study. Biomaterials. 1998;19:371–386. doi: 10.1016/s0142-9612(97)00114-2. [DOI] [PubMed] [Google Scholar]
- 20.Duncan P.B., Needham D. Test of the Epstein-Plesset model for gas microparticle dissolution in aqueous media: effect of surface tension and gas undersaturation in solution. Langmuir. 2004;20:2567–2578. doi: 10.1021/la034930i. [DOI] [PubMed] [Google Scholar]
- 21.Duncan P.B., Needham D. Microdroplet dissolution into a second-phase solvent using a micropipet technique: test of the Epstein-Plesset model for an aniline-water system. Langmuir. 2006;22:4190–4197. doi: 10.1021/la053314e. [DOI] [PubMed] [Google Scholar]
- 22.Lee S.H., Needham D., Jutila A. Water micro-droplets in simple hydrocarbons: dissolution, free energies of adhesion and bilayer permeability. Abstr. Pap. Am. Chem. Soc. 2005;229:U667. [Google Scholar]
- 23.Murphy L.R., Matubayasi N., Levy R.M. Protein hydration and unfolding—insights from experimental partial specific volumes and unfolded protein models. Fold. Des. 1998;3:105–118. doi: 10.1016/S1359-0278(98)00016-9. [DOI] [PubMed] [Google Scholar]
- 24.Chaikin P.M., Donev A., Torquato S. Some observations on the random packing of hard ellipsoids. Ind. Eng. Chem. Res. 2006;45:6960–6965. [Google Scholar]
- 25.Merzel F., Smith J.C. High-density hydration layer of lysozymes: molecular dynamics decomposition of solution scattering data. J. Chem. Inf. Model. 2005;45:1593–1599. doi: 10.1021/ci0502000. [DOI] [PubMed] [Google Scholar]
- 26.Segatin N., Klofutar C. Thermodynamics of the solubility of water in 1-hexanol, 1-octanol, 1-decanol, and cyclohexanol. Monatsh. Chem. 2004;135:241–248. [Google Scholar]
- 27.Bryan W.P. Thermodynamic models for water-protein sorption hysteresis. Biopolymers. 1987;26:1705–1716. doi: 10.1002/bip.360261005. [DOI] [PubMed] [Google Scholar]
- 28.Gregory, R.B. 1995. Protein-Solvent Interactions. M. Dekker, New York, NY.
- 29.Kocherbitov V., Arnebrant T., Söderman O. Lysozyme-water interactions studied by sorption calorimetry. J. Phys. Chem. B. 2004;108:19036–19042. [Google Scholar]
- 30.Lüscher-Mattli M. Thermodynamic functions of biopolymer hydration. I. Their determination by vapor pressure studies, discussed in an analysis of the primary hydration process. Biopolymers. 1982;21:403–418. [Google Scholar]
- 31.Sirotkin V.A. Effect of dioxane on the structure and hydration-dehydration of α-chymotrypsin as measured by FTIR spectroscopy. Biochim. Biophys. Acta. 2005;1750:17–29. doi: 10.1016/j.bbapap.2005.02.010. [DOI] [PubMed] [Google Scholar]
- 32.Fredericks W.J., Hammonds M.C., Rosenberger F. Density, thermal expansivity, viscosity and refractive-index of lysozyme solutions at crystal-growth concentrations. J. Cryst. Growth. 1994;141:183–192. [Google Scholar]
- 33.McIntosh T.J., Magid A.D., Simon S.A. Range of the solvation pressure between lipid membranes: dependence on the packing density of solvent molecules. Biochemistry. 1989;28:7904–7912. doi: 10.1021/bi00445a053. [DOI] [PubMed] [Google Scholar]
- 34.Yang P.H., Rupley J.A. Protein-water interactions. Heat capacity of the lysozyme-water system. Biochemistry. 1979;18:2654–2661. doi: 10.1021/bi00579a035. [DOI] [PubMed] [Google Scholar]
- 35.Rupley J.A., Careri G. Protein hydration and function. Adv. Protein Chem. 1991;41:37–172. doi: 10.1016/s0065-3233(08)60197-7. [DOI] [PubMed] [Google Scholar]
- 36.Stanley C., Krueger S., Rau D.C. Protein structure and hydration probed by SANS and osmotic stress. Biophys. J. 2008;94:2777–2789. doi: 10.1529/biophysj.107.122697. [DOI] [PMC free article] [PubMed] [Google Scholar]
- 37.Zhou H.X. A unified picture of protein hydration: prediction of hydrodynamic properties from known structures. Biophys. Chem. 2001;93:171–179. doi: 10.1016/s0301-4622(01)00219-8. [DOI] [PubMed] [Google Scholar]
- 38.Sarupria S., Garde S. Quantifying water density fluctuations and compressibility of hydration shells of hydrophobic solutes and proteins. Phys. Rev. Lett. 2009;103:037803. doi: 10.1103/PhysRevLett.103.037803. [DOI] [PubMed] [Google Scholar]
- 39.Smolin N., Winter R. Molecular dynamics simulations of staphylococcal nuclease: properties of water at the protein surface. J. Phys. Chem. B. 2004;108:15928–15937. [Google Scholar]
- 40.Lee S.B., Kim K.-J. Effect of water activity on enzyme hydration and enzyme reaction rate in organic solvents. J. Ferment. Bioeng. 1995;79:473–478. [Google Scholar]
- 41.Halling P.J. High-affinity binding of water by proteins is similar in air and in organic solvents. Biochim. Biophys. Acta. 1990;1040:225–228. doi: 10.1016/0167-4838(90)90080-y. [DOI] [PubMed] [Google Scholar]
- 42.Klibanov A.M. Improving enzymes by using them in organic solvents. Nature. 2001;409:241–246. doi: 10.1038/35051719. [DOI] [PubMed] [Google Scholar]
- 43.Randolph T.W. Phase separation of excipients during lyophilization: effects on protein stability. J. Pharm. Sci. 1997;86:1198–1203. doi: 10.1021/js970135b. [DOI] [PubMed] [Google Scholar]
- 44.Wang W. Lyophilization and development of solid protein pharmaceuticals. Int. J. Pharm. 2000;203:1–60. doi: 10.1016/s0378-5173(00)00423-3. [DOI] [PubMed] [Google Scholar]
- 45.Maa Y.F., Hsu C.C. Effect of primary emulsions on microsphere size and protein-loading in the double emulsion process. J. Microencapsul. 1997;14:225–241. doi: 10.3109/02652049709015335. [DOI] [PubMed] [Google Scholar]
Associated Data
This section collects any data citations, data availability statements, or supplementary materials included in this article.