

Abstract
An increasing number of experimental studies employ single particle tracking to probe the physical environment in complex systems. We here propose and discuss what we believe are new methods to analyze the time series of the particle traces, in particular, for subdiffusion phenomena. We discuss the statistical properties of mean maximal excursions (MMEs), i.e., the maximal distance covered by a test particle up to time t. Compared to traditional methods focusing on the mean-squared displacement we show that the MME analysis performs better in the determination of the anomalous diffusion exponent. We also demonstrate that combination of regular moments with moments of the MME method provides additional criteria to determine the exact physical nature of the underlying stochastic subdiffusion processes. We put the methods to test using experimental data as well as simulated time series from different models for normal and anomalous dynamics such as diffusion on fractals, continuous time random walks, and fractional Brownian motion.
Introduction
The history of stochastic motion may be traced back to the writings of Titus Lucretius, describing the battling of dust particles in air (1). Later, the irregular motion of single coal dust particles was described by Jan Ingenhousz in 1785 (2). Robert Brown in 1827 reported the jittery motion of small particles within the vacuoles of pollen grains (3). Possibly the first systematic recording of actual trajectories was published by Jean Perrin, observing individual, small granules in uniform gamboge emulsions (4). Apparently, the first actual experimental study based on the time series analysis of single particle trajectories is due to Nordlund, who tracked small mercury spheres in water (5). Today single trajectory analysis is a common method used to probe the motion of particles, notably, in complex biological environments (6–15).
Typically, a diffusion process in d dimensions is characterized by the ensemble-averaged, mean-squared displacement (MSD):
| (1) |
Here we assumed spherical symmetry and an isotropic environment, such that P(r, t) is the probability density to find the particle a (radial) distance r away from the origin at time t after release of the particle at r = 0 at time t = 0. In Eq. 1, we introduced the anomalous diffusion exponent α. In the limit α = 1 we encounter regular Brownian diffusion. For other values of α, the associated diffusion is anomalous: the case 0 < α < 1 is called subdiffusion, whereas for α > 1 the process is called superdiffusion (16). In this work we focus on subdiffusive processes. In Eq. 1, the generalized diffusion coefficient is of dimension [Kα] = cm2/sα. Subdiffusion of the form from Eq. 1 is found in a variety of systems, such as amorphous semiconductors (17), tracer dispersion in subsurface aquifers (18), or in turbulent systems (19).
In fact, subdiffusion was found from observation of single trajectories in a number of biologically relevant systems: For instance, it was shown that adeno-associated viruses of radius ≈ 15 nm in a cell perform subdiffusion with α = 0.5…0.9 (6). Fluorescently-labeled messenger RNA chains of 3000 bases' length and effective diameter of some 50 nm subdiffuse with α ≈ 0.75 (7). Lipid granules of typical size of few hundred nm exhibit subdiffusion with α ≈ 0.75…0.85 (8–11); and the diffusion of telomeres in the nucleus of mammalian cells shows α ≈ 0.3 at shorter times and α ≈ 0.5 at intermediate times (12). A study assuming normal diffusion for the analysis of tracking data of single-cell nuclear organelles shows extreme fluctuations of the diffusivity as function of time along individual trajectories, possibly pointing to subdiffusion effects (13). In vitro, subdiffusion was measured in protein solutions (14) and in reconstituted actin networks (15). Molecular crowding is often suspected as a cause of subdiffusion in living cells (20,21).
Currently, one of the important open questions is: What physical mechanism causes the subdiffusion in biological systems? Single-particle tracking is expected to provide essential clues to answer this question. In response to this, a method was recently suggested based on the statistics of first passage times, i.e., the distribution of times it takes a random walker to first reach a given distance from its starting point. This quantity has been shown to be a powerful tool to discriminate between continuous time random walk and diffusion on fractals (22,23). However, such an analysis requires a huge amount of data for the analysis to be statistically relevant. Fluorescence correlation spectroscopy has also been proposed to identify the physical mechanism of subdiffusion (24); but this approach is based on an indirect observable, the fluorescence correlator, which is not directly comparable with analytical results; moreover, this method needs to fit three parameters to a single curve. We here present a new method (to our knowledge) that is based on analytical results. Our approach is demonstrated to enable one to extract more, and more accurate, information from a set of single particle trajectories.
A typical single particle tracking experiment provides a time series r(t) of the particle position from which one may calculate the time-averaged MSD:
| (2) |
Here T denotes the overall measurement time, and Δ is a lag time defining a window swept over the time series. For a Brownian random walk with typical width 〈δr2〉 of the step length and characteristic waiting-time τ between successive steps, we recover the time average
where the diffusion constant becomes K1 = 〈δr2〉/[2dτ]. In this case, the time average provides exactly the same information as the ensemble average. Note that this is not always the case when the dynamics is subdiffusive (25–27).
Using time averages to analyze the behavior of a single particle is an elegant method in allowing us to avoid errors from averages over particles with nonidentical physical properties. However, in many cases the actual trajectories are too short to allow one to extract meaningful information from the time average. Moreover, in cases where the subdiffusion is governed by a CTRW with diverging characteristic waiting time, the values of the moments, and therefore their ratios, become random quantities (25,26). Using the ensemble average prevents this problem. We therefore consider herein ensemble averages calculated directly from measured trajectories. In particular, we present an analysis based on a mean maximal excursion (MME) statistics. It will be shown that this method provides relevant information on the system, complementary to results from analysis of regular moments. Moreover, we demonstrate that the MME method may obtain more accurate information about the dynamics than the typically measured mean-squared displacement (see Eq. 1).
In what follows we present the theoretical background of the MME analysis and discuss how different dynamic processes can be discriminated. We then discuss how to apply these methods in practice, including the analysis of some recent single-particle tracking data.
Materials and Methods
As a benchmark for our quantitative analysis, we here define the three most prominent approaches to subdiffusion. Physically these processes are fundamentally different, although they all share the form (Eq. 1) of the mean-squared displacement (MSD). In the Supporting Material, we provide details on how we simulate the time series based on the stochastic models.
Continuous time random walk
Continuous time random walk (CTRW) defines a random walk process during which the walker rests a random waiting time, drawn from a probability distribution, between successive steps (17). If the density of waiting times is of the long-tailed form
| (3) |
for 0 < α < 1, the mean waiting time
diverges, and the resulting process becomes subdiffusive with MSD from Eq. 1. The exponent α from the waiting time density in Eq. 3 is then the same as in Eq. 1. If the variance of the associated jump lengths is again 〈δr2〉, the generalized diffusion coefficient becomes Kα = 〈δr2〉/(2dτ). Waiting times with such power-law distribution were, for instance, observed for the motion of probes in a reconstituted actin network (15). CTRW is used in a wide variety of fields, ranging from charge-carrier motion in amorphous semiconductors (17), over tracer diffusion in underground aquifers (18), up to weakly chaotic systems (19).
Diffusion on fractals
A random walker moving on a geometric fractal (for instance, a percolation cluster near the percolation threshold) meets bottlenecks and dead-ends on all scales, similar to the motion in a labyrinth. This results in an effective subdiffusion in the embedding space. Whereas the fractal dimension df characterizes the geometry of the fractal, the diffusive dynamics involves an additional critical exponent, the random walk exponent dw (dw ≥ 2). The latter is related to the anomalous diffusion exponent through α = 2/dw (28). Fractals can be used to model complex networks, and have recently been suggested to mimic certain features of diffusion under conditions of molecular crowding (29,30). We will use for the theoretical descriptions the dynamical scheme of O'Shaughnessy and Procaccia (31).
Fractional Brownian motion
Fractional Brownian motion (FBM) was introduced to take into account correlations in a random walk: the state of the system at time t is influenced by the state at time t′ < t. In the FBM model this is achieved by passing from a Gaussian white noise dB(t) to fractional Gaussian noise
| (4) |
where the Hurst exponent 0 < H < 1 is connected to the anomalous diffusion exponent by α = 2H. FBM therefore describes both subdiffusion and superdiffusion up to the ballistic limit α = 2. FBM is used to describe the motion of a monomer in a polymer chain (32) or single file diffusion (33). FBM has recently been proposed to underlie the diffusion in a crowded environment (24). The autocorrelation function of FBM in one dimension reads (34)
| (5) |
and for t1 = t2 we recover the MSD from Eq. 1. Following Unterberger (35), we extend FBM to several dimensions such that a d-dimensional FBM of exponent H is a process in which each of the coordinates follows a one-dimensional FBM of exponent H. The resulting d-dimensional FBM still satisfies Eq. 1, with α = 2H.
Results
The parameters in the three simulation models are chosen to produce the same anomalous diffusion exponent α = 0.70. Using only the classical analysis based on the MSD (Eq. 1), one could not tell which model was used to create the data. We discuss here how additional observables allow one to extract a more accurate value of this α-exponent, and how they may be used to distinguish the microscopic stochastic mechanisms.
Mean maximal excursion approach
A power law fit to the classical MSD (1) provides the magnitude of the anomalous diffusion exponent α. We here show that the mean maximal excursion (MME) method is a better observable to determine α. The maximal excursion is the greatest distance r that the random walker reaches until time t. This quantity is averaged over all trajectories, to obtain the MME second moment
| (6) |
where
is the probability that the maximal distance from the origin that is reached up to time t, is equal to r0. The MME second moment from Eq. 6 scales like tα, as shown in Bidaux et al. (36) for fractal media, and derived in the Supporting Material for a CTRW process.
For FBM this quantity is not known, similar to the first passage in other than a semiinfinite domain in one dimension. However, one can still use the MME method to numerically analyze data created by an FBM process, as shown below.
Why is the MME second moment better than the more standard MSD? The ratio γ = σX(t)/〈X(t)〉 of the standard deviation
versus the mean is a measure for the dispersion around the center of the distribution (first moment). A lower ratio means that the random variable has a smaller spread around its mean. This will produce a smoother average and thus a more accurate fit as the larger number of data points closer to the average value receive a higher relative weight. Indeed, for regular Brownian motion (BM) the ratio is smaller for the MME second moment than for the regular second moment, the time-independent values being γ(MSD)/γ(MME) = 1.61, 1.44, and 1.34 for one, two, and three dimensions. The MME method is therefore expected to nonnegligibly outperform the MSD method. Details of this calculation are presented in the Supporting Material. For diffusion on a fractal, the ratio γ(MSD)/γ(MME) also grows with decreasing fractal dimension, being always >1. For a CTRW the ratio γ(MSD)/γ(MME) diminishes as well with decreasing α, reaching its lowest value at α = 0. But it is always >1 in dimensions d = 1, 2, 3.
Another way to characterize the dispersion of the MME method versus regular moments is the ratio of the fourth moment versus the second moment of the respective distribution.
For a random walk on a fractal, approximated by the dynamical scheme of O'Shaughnessy and Procaccia (31), the MME moments become (36)
| (7) |
where the prefactor is given through
| (8) |
Here In is the modified Bessel function of the first kind. The regular moments satisfy an analogous relation (31):
| (9) |
The ratios and 〈r4〉/〈r2〉2 are therefore time-independent numerical constants. Note that the above expressions also contain the limiting case of BM (integer dimension, and α = 1). In the latter case the associated values are listed in Table 1, demonstrating again that the MME distribution is more concentrated and therefore more amenable to parameter extraction by fitting (see also the discussion below).
Table 1.
Ratios of fourth moment versus the square of the second moment for normal moment statistics and MME statistics
| α | One dimension | Two dimensions | Three dimensions | |
|---|---|---|---|---|
| 〈r4〉/〈r2〉2 | 1 | 3 | 2 | 5/3 |
| 1.77 | 1.49 | 1.36 | ||
| 〈r4〉/〈r2〉2 | 1/2 | 3π/2 ≈ 4.71 | π ≈ 3.14 | 5π/6 ≈ 2.62 |
| 2.78 | 2.33 | 2.14 |
We list normal BM (α = 1) and CTRW subdiffusion with α = 1/2. The MME distribution is narrower and therefore more amenable for data fitting in all cases.
For FBM, the regular moments are obtained from the Brownian ones by simple replacement of time t by tα. Because the regular moment ratios are time-independent, we find exactly the same values as in the Brownian case. The MME moments are not known analytically, so we performed numerical simulations to get an estimate of these quantities. A surprising result is that the MME moments are proportional to tkα′/2, but with a new exponent α′ > α.
We discuss these results in detail in the Supporting Material, finding a linear correlation (R2 > 0.999 for 10 points) between the two exponents:
| (10) |
We note that for BM (α = 1), we retrieve the classical result α′ = α. We also obtained an expression for the MME moment ratio, , in two dimensions (R2 > 0.99 for 10 points):
| (11) |
We note that solely focusing on the determination of α′ from the second MME moment may lead to an overestimation of the anomalous diffusion exponent if the motion is governed by FBM and α′ is not converted to α via the relation in Eq. 11. It is therefore important to also evaluate the complementary criteria such as the MSD and the moment ratios.
In the case of CTRW subdiffusion, we profit from the fact that in Laplace space we can transform the probability density and the moments of normal BM into the corresponding CTRW subdiffusion solution by so-called subordination (16,37). In practice, this means that we can replace s by K1sα/Kα where s is the Laplace variable conjugated to time t. We obtain the ratio for both regular moments and MME statistics from the Brownian result, however, with different prefactors:
| (12) |
| (13) |
Table 1 shows the results for α = 1/2.
The moment ratios and 〈r4〉/〈r2〉2 are useful observables. Once we determine the anomalous exponent α from fit to the MSD or the second MME moment we can use the moment ratios to identify the process. If the moment ratio for a subdiffusion process with 0 < α < 1 is the same as for BM, we are dealing with an FBM process. If the value matches the one for CTRW subdiffusion for the given α, we verify the CTRW mechanism. Finally, we can identify the remaining possibility, i.e., diffusion on a fractal: The obtained numerical value for the ratio allows us, in principle, to deduce the underlying fractal dimension df, using the predicted values of Eqs. 7 and 9. We will discuss below the reliability of such classifications.
Determination of the fractal dimension df
Finally we establish a criterion to distinguish diffusion on a fractal from CTRW and FBM subdiffusion. We know that the probability density for a diffusing particle on a fractal satisfies the scaling relation (38,39)
| (14) |
The same relation holds for a CTRW or a FBM if we replace df by the Euclidian dimension. Let us focus on the probability to be in a growing sphere of radius r0tα/2. Then
| (15) |
Because the exponent α is known from the second MME moment fit we can extract df from above relation.
Summary
Collecting the results from this section, we come up with the following recipe to analyze diffusion data obtained from experiment or simulation (compare also the results summarized in Table 2).
First, obtain the anomalous diffusion exponent α from power-law fit to MSD and the second MME moment.
Different subdiffusion mechanisms can then be determined as follows:
Diffusion on a fractal has regular and MME moment ratios that depend on both α and the fractal dimension df. The fractal dimension is smaller than the embedding Euclidean dimension. CTRW subdiffusion has regular and MME moments that depend on the anomalous diffusion exponent α. The ratios are larger than the corresponding Brownian quantities. The probability to be in a sphere growing like tα/2 is constant. FBM has the same ratios for regular moments as BM. The MME second moment exponent is >α, and the MME ratio is smaller than the Brownian ratio. The probability to be in a sphere growing like tα/2 is constant.
Table 2.
Test for two-dimensional trajectories in a free environment, and equation references for other dimensions
| Second moment (regular, MME) | Ratio (regular, MME) | Growing spheres | |
|---|---|---|---|
| BM | (∝ t, ∝ t) | (2, 1.49), Eqs. 7 and 9 | Pr(r ≤ r0tα/2, t) = A0 |
| Fractals | (∝ tα, ∝ tα) | (<2, <1.49), Eqs. 7 and 9 | |
| CTRW | (∝ tα, ∝ tα) | (>2, >1.49), Eqs. 12 and 13 | Pr(r ≤ r0tα/2, t) = A0 |
| FBM | (∝ tα, ∝ tα′), Eq. 10 | (2, <1.49), Eq. 11 | Pr(r ≤ r0tα/2, t) = A0 |
For each model (BM, diffusion on fractal, CTRW, and FBM), the second column lists the scaling behavior of the second regular and MME moments (〈r2〉 and ); the third column shows the relative values of the regular and MME ratio (〈X4〉/〈X2〉2); and the fourth column contains the scaling laws of the probability, at time t, to be in a sphere growing like tα/2.
Discussion
We now turn to the question: How can experimental data be analyzed by help of the tools established above? In a typical experment, a small particle is tracked by a microscope, the motion being projected onto the focal plane (two dimensions), to produce a time series r(t) = (x(t), y(t)) of the particle positions. Given a set of N trajectories ri(t), with ni steps in trajectory i, we first calculate the distances to the starting point,
| (16) |
in the two-dimensional projection of the motion monitored in the experiment. The propagator is not directly accessible in an experiment. However, division of the number of trajectories being at r for a given time t in the two-dimensional projection, by the total number of trajectories of length ni ≥ t, leads to a good estimate of P(r, t). We can therefore transform all the previous integrals defining the moments into discrete sums, and apply the above methods.
Regular and MME moments
In discrete form, the kth order moments become
| (17) |
and
| (18) |
for regular and MME statistics, respectively. Here is the number of trajectories that are at least t steps' long.
Note that the discrete MME moments defined here do not correspond exactly to the theoretical definition provided before. In fact, we do not have access to the whole trajectory, but only some sample points of it, with a given time step between two consecutive frames. The real rmax may be reached in between two frames, and therefore would not be observed. However, after sufficiently long time the difference between the discrete estimate calculated here and the real value from the continuous trajectory becomes sufficiently small.
Fig. 1 shows the result of fits of the MSD and the second MME moment to simulated data according to the three subdiffusion models, all with anomalous diffusion exponent α = 0.7. Indeed the MME method performs somewhat better. We should note that these simulation results are fairly smooth, and therefore we would not expect a significant difference between the two methods, in contrast to the results on the experimental data below. Also note that we chose different anomalous diffusion constants Kα to be able to distinguish the different curves in Fig. 1. Of course, this does not influence the quality of the fit of the anomalous diffusion exponent α.
Figure 1.
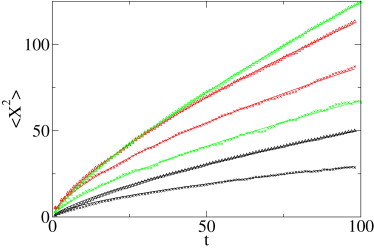
MSD 〈r2(t)〉 and second MME moment as function of time t (arbitrary units) for the three simulated time series (1000 trajectories of 100 steps each), each with anomalous diffusion exponent α = 0.7. The power-law fits produce, for two-dimensional percolation data, α = 0.64 (MSD, depicted by black ×) and α = 0.73 (MME, black Δ); for CTRW data, α = 0.67 (MSD, red ×) and α = 0.71 (MME, red Δ); and for FBM data, α = 0.72 (MSD, green ×) and α′ = 0.79 (MME, green Δ, expected value α′ ≈ 0.74).
Let us now turn to the moment ratios 〈r4〉/〈r2〉2 and . As mentioned above, some care has to be taken with the latter: only the long time values have a physical meaning. In fact, for the first frame, the moment estimate is exactly 〈r2〉, because of the discrete time step. After few dozens of frames, the estimate converges toward its correct value, and the ratios become meaningful.
In Fig. 2 we show a plot of the moment ratios. The convergence to a constant value attained at sufficiently long times is distinct. The ratios are those predicted for both CTRW and FBM, where the simulation is performed in a free environment. For diffusion on a percolation cluster, we observe a deviation from the prediction, due to the confinement of the diffusion for this set: the propagator does not converge toward the free space propagator, but toward the stationary distribution. We note that these ratios are clearly distinguishable between regular and MME moments, but also between the three simulations sets. Knowing the α-value from the previous power law fit of MSD or second MME moment, those ratios are already a good indication of the underlying stochastic process. As the difference between CTRW and diffusion on a fractal is not too large, we use the method of a growing sphere to see whether we can discriminate more clearly between those two mechanisms.
Figure 2.
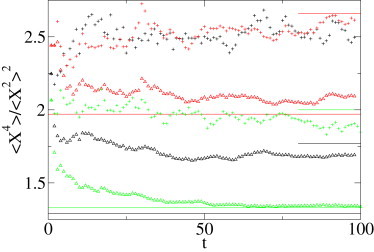
Regular and MME moment ratios 〈r4〉/〈r2〉2 and as function of time (a.u.) for the three simulated sets (diffusion on a fractal, FBM, and CTRW). Each set consists of 1000 trajectories with 100 steps each. (Black Δ) MME ratio for the diffusion on a two-dimensional percolation cluster; the data do not converge to the expected value 1.29 (black horizontal line). The same behavior is observed for the regular moment ratio (black +), for which the expected value is 1.77 (short black line). This discrepancy is likely due to the confinement of the percolation cluster on a 250 × 250 network: the random walker quickly reaches the boundaries, and the convergence occurs toward the equilibrium distribution, not toward the free space propagator. (Red Δ) MME ratio for the CTRW process, converging to 1.97 (red horizontal line). We also plot the regular moment ratio (red +); these are more irregular and converge to 2.66 (short red line). For FBM, the MME ratio (green Δ) converges to the estimated value of Eq. 11, 1.33 (green horizontal line), and the regular ratio (green +) oscillates around the Brownian value 2 (short green line).
Growing sphere analysis
Let us turn to the probability to find the particle at time t in a (growing) sphere of radius r0tα/2. Here r0 is a free parameter. It should be chosen sufficiently large, such that for a given trajectory the probability to be within the sphere is appreciably large. At the same time it should not be too large, otherwise the probability to be within the sphere is almost 1. Choosing a small multiple of 〈r(t = 1)〉 appears to be a good compromise. The probability to be inside the sphere then becomes
| (19) |
Here Θ(r) is the Heaviside function, which equals 1 if r ≥ 0, and 0 if r < 0. We expect the scaling . To fit the fractal dimension df we need the anomalous diffusion exponent α as input. We used the value extracted from the second MME moment fits. The direct plot of the probability is quite easy to interpret: if the probability is constant, then d = df; if it grows slowly, then d > df, and the support is fractal (df ≠ d). The dimension d here is the dimension of the trajectories (d = 2 in our examples due to the projection onto the focal plane). In Fig. 3, we see clearly that for CTRW and FBM the probability is approximately constant, and that for the diffusion on a percolation cluster, it grows with time, indicating that df < d, as it should be.
Figure 3.
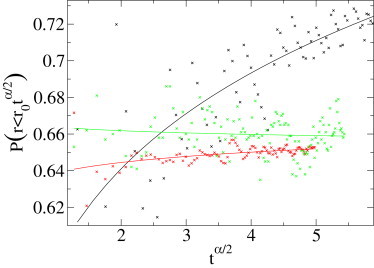
Probability to be in a growing sphere of radius r0tα/2 as function of tα/2 for the three simulated sets (a.u.). This analysis is based on the previously fitted values of α. Results: Two-dimensional critical percolation (black ×) produces d – df ≈ 0.11, i.e., df ≈ 1.89 (exact value 91:48 ≈ 1.896). The CTRW set (red ×) gives d – df ≈ 0.01 instead of 0, and the FBM set (green ×) leads to d – df ≈ – 0.004 instead of 0.
Experimental data
We analyze experimental single particle tracking data, showing that such time series are sufficiently large to apply the analysis tools developed herein.
The first data set (see the Supporting Material) contains 67 trajectories with up to 210 steps' length of quantum dots diffusing freely in a solvent. The expected behavior is regular BM. The data set is quite small and we show that MME moments are better observables than regular moments. We plot the MSD as a function of time in Fig. 4, and fit the data by a power-law ∝ tα. This fit provides an anomalous diffusion coefficient α = 0.81. The fit based on the second MME moment returns the value α = 1.02, an almost perfect reproduction of the expected value α = 1. The much better result of the MME method is due to the lower dispersion around the mean of the MME statistics, as discussed in the Supporting Material. In Fig. 4 it can be appreciated that the large outlier in the MSD statistics at ∼t = 0.7 s is responsible for the low α-value. The MSD also follows normal diffusion at longer times. This analysis demonstrates that the MSD, in this case, would lead to a large deviation from the expected value, and thus to the erroneous conclusion that the observed motion were subdiffusive; note that the MME analysis performs much more reliably.
Figure 4.
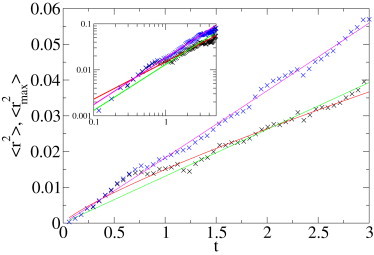
Analysis of an experimental set of 67 trajectories, the longest consisting of 210 points, for quantum dots freely diffusing in a solvent. MSD (black ×), fitted by a power law with exponents α = 0.81 (red line). We also show a fit with fixed exponent α = 1 (green line, expected behavior for BM). MME (blue ×), fitted by a power law (red line, α = 1.02). Time is in s; distances are in μm2. (Inset) Double-logarithmic plot of the same data.
The second set of data was obtained from video tracking of eight different lipid granules moving in yeast cells. As we had few long trajectories, before an ensemble average we first directly analyzed the eight trajectories using the time-averaged MSD in Eq. 2. We obtain a distinct subdiffusive behavior with an exponent close to 0.4, as demonstrated in Fig. 5. Each trajectory corresponds to a given granule. It is interesting to see that the data exhibit a scatter in amplitude and considerable local variation of slope. (Such features were also observed previously; see, for instance, (7,10).) They may possibly be related to aging effects (40). We also note that one of the curves shows a much steeper slope than do the others. We extended the time-average analysis to the second MME moment
| (20) |
and again obtained a clear subdiffusive behavior, but with an exponent close to 0.5, as demonstrated in Fig. 6. Once again, we have a scatter in amplitude. The initial slope variation (0 < t < 10) is due to the inaccuracy in the MME estimation when there are only few frames to average. A greater exponent for MME than for regular moment could be due to an inaccuracy in the fit. However, it may indeed point toward an underlying FBM process.
Figure 5.
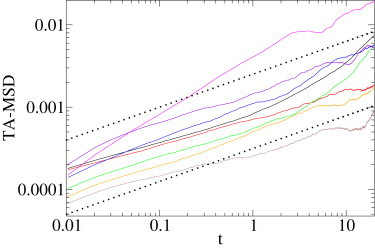
Lipid granules diffusing in a yeast cell. Eight trajectories, between 5515 and 19,393 frames' long. Log-log plot of the time-averaged MSD as a function of lag time (continuous lines), and A0t0.4 (dotted lines). Time is scaled in s, and time-averaged MSD is in μm2.
Figure 6.
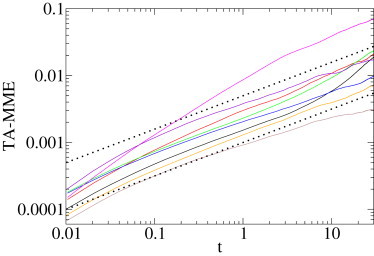
Lipid granules diffusing in a yeast cell. Log-log plot of the time-averaged second MME moment of the data from Fig. 5 as function of lag time (continuous lines), and A0t0.5 (dotted lines). Time is scaled in s; the ordinate is in μm2.
To gain more insight into the diffusion mechanism producing this subdiffusion behavior, we applied the methodology detailed above. As the different trajectories were not all recorded at the same frequency (96.5 and 99.1 frames/s), we kept only the greater set (96.5 fps), containing five trajectories, and we split those into 526 short trajectories of 100 steps each. These trajectories are nonoverlapping and one may view them as the result of 526 separate observations. Surprisingly, we retrieve the exponent 0.41 ± 0.01 using the MSD, and the value 0.53 ± 0.02 from the second MME moment, as shown in Fig. 7. We repeated this analysis with a step size of 150 (350 trajectories), concluding that the choice of the step size 100 has no influence on the value of those coefficients. Because one of the trajectories (the magenta line in Figs. 5 and 6) shows a much steeper slope, we excluded it for the rest of the analysis.
Figure 7.
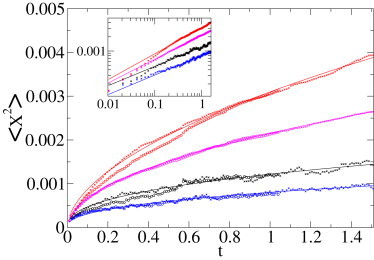
Lipid granules diffusing in a yeast cell. Five-hundred-and-twenty-six subtrajectories of 100 steps extracted from the experimental set of five trajectories, which are between 5515 and 19,393 frames' long. Ensemble-averaged MSD (black •) fitted by a power law (α = 0.41, black line), and ensemble-averaged MME (red •), fitted with a power law (α = 0.55, red line). We verified that creating 350 trajectories of 150 steps instead of 100 does not change the exponents obtained from the MSD or the second MME moment (× instead of • symbols). Because one of the trajectories had a steeper slope than the others, we repeated the same analysis without this trajectory. The new subset contained 445 trajectories of 100 steps, or 296 of 150 steps (MSD in blue leading to α = 0.42, second MME moment in magenta producing α = 0.51). Time is in s; the ordinate is measured in μm2. (Inset) Double-logarithmic plot of the same data.
An interesting observation is the following: assuming that the underlying stochastic process is indeed an FBM, Eq. 10 for α = 0.41 predicts a value α′ = 0.50 for the MME statistics, in quite good agreement with the fitted value. This finding is quite suggestive in favor of FBM as the stochastic process governing the particle motion.
Because the trajectories correspond to different granules, in different cells, we also studied them separately: each trajectory was split into stretches of 100 steps. For each granule, we plotted the regular and the MME ratios. They are somewhat noisy, but for each granule the MME ratio is clearly below the Brownian one (1.49): it ranges between 1.20 and 1.40. The regular moment ratio is slightly above the Brownian value (Eq. 2), between 1.7 and 2.5, as shown in Fig. S3 of the Supporting Material. We also plotted the ratio for the whole set of 100 steps (thick lines), which give approximately the same results as those obtained for individual trajectories. From these ratios, we obtain another clue pointing at an underlying FBM mechanism: the MME moment ratio is, on average, below the value for BM, and the regular moment ratio is close to the Brownian value. These MME ratios are not very precise, but seem to range somewhat above the expected value for FBM with α = 0.41: Eq. 11 gives 1.21 ± 0.02.
The test with the growing sphere is, once again, somewhat noisy; however, it clearly shows that the probability to be in a sphere, growing like tα/2, attains a constant value (see Fig. S4). This excludes the possibility that the process corresponds to diffusion on a fractal.
The above analysis demonstrates that the tools proposed in this study allow us to classify the stochastic process underlying the motion of the measured single particle trajectories of the granules. We observe that this motion shares several distinct features with an FBM process. Namely, FBM explains the finding of different scaling exponents of the MSD and the MME second moment, including their actual values connected by Eq. 10. It is also consistent with a Brownian regular moment ratio, and an MME ratio lower than the Brownian ratio, as shown in Fig. S3. The recorded data were also shown to be incompatible with diffusion on a fractal. The question arises: Could CTRW function as a potential mechanism? The scatter between different single trajectories observed in the time-averaged second moments is reminiscent of the weak ergodicity breaking for CTRW subdiffusion with diverging characteristic waiting time, as studied in the literature (25,26). However an alternative explanation may simply be different environments and granule sizes. It should be noted that even between successive recordings the cellular environment may change slightly, influencing the motion of the observed particle. The CTRW hypothesis, however, is not consistent with the moment ratio test: the expected ratio for α = 0.4 would be 3.38 for the regular one, and 2.50 for the MME—far above the observed values.
Given the clues we obtained from the analysis, the experimental data quite clearly point toward an FBM as an underlying stochastic process. More extensive data acquisition is expected to allow us to make more precise conclusions.
Conclusions
With modern tracking tools, biophysical experiments provide us with the time series of single particle trajectories. Recently a growing number of cases have been reported in which the monitored particles exhibit subdiffusion. An important example is the motion of biopolymers under cellular crowding conditions. Whereas the MSD of these data, scaling like ≃ tα, provides the anomalous diffusion exponent α, the underlying physical mechanism causing this subdiffusion is presently unknown. As different mechanisms give rise to fundamentally different physical behaviors influencing the particle diffusion in a living cell, it is important to obtain information from experimental or simulation data other than the anomalous diffusion exponent, allowing us to pin down the specific stochastic process. We here introduced and studied several observables to analyze more quantitatively single-particle trajectories of freely (sub)diffusing particles. For long trajectories with active motion events, the latter may be singled out and our analysis performed on the passive parts of the trajectories (41). As typical experimental data sets are relatively short, we here focus on the ensemble average obtained from a larger number of individual trajectories. The data were simulated based on three subdiffusion models—these being CTRW with power-law waiting-time density; fractional BM; and diffusion on a fractal support. Moreover, we analyzed two sets of experimental single-particle tracking data, corresponding to a Brownian and a subdiffusive system.
In particular, we propose alternative measures to the usual fit to the MSD. Apart from obtaining the fourth-order moment and constructing the ratio 〈r4〉/〈r2〉2, these alternatives are:
-
1.
MME statistics that the particle has not traveled more than a preset distance up to time t. Its second and fourth moments, theoretically, scale with time the same way as the regular moments; however, they appear to reproduce more truthfully the actual subdiffusion exponents. Constructing the ratio 〈rmax4〉/〈rmax2〉2 for these quantities provides additional information that allows one to distinguish different subdiffusion mechanisms.
-
2.
The analysis using a growing sphere containing a certain portion of particles appears as a quite reliable method to obtain the (fractal) dimension of the underlying trajectory.
An application to an experimental set proves the efficiency of those tests: the MME analysis is clearly more accurate than the classical MSD one, and with a modest data set we are able to collect several independent clues to identify FBM as mechanism to explain the motion of lipid granules under molecular crowding conditions. For a long recorded time series, the performance of the MME and regular-moments analysis becomes comparable.
From the discussion of simulations and experimental data, we have shown that to understand the physical mechanism of anomalous diffusion in a given set of data, one needs to gather evidence from complementary measures such as those proposed in this article.
Acknowledgments
We acknowledge funding from the Deutsche Forschungsgemeinschaft and the CompInt graduate school at the Technical University of Munich.
We are grateful to Eli Barkai, Jae-Hyong Jeon, Yossi Klafter, and Igor Sokolov for many helpful discussions.
Supporting Material
References
- 1.Titus Lucretius Carus. 2009. On the Nature of Things. Forgotten Books, www.forgottenbooks.org.
- 2.Ingenhousz J. T. Barrois le jeune; Paris: 1785. New Experiments and Observations on Diverse Physical Objects. [Google Scholar]
- 3.Brown R. A brief account of microscopical observations made in the months of June, July and August, 1827, on the particles contained in the pollen of plants; and on the general existence of active molecules in organic and inorganic bodies. Philos. Mag. 1828;4:161–173. [Google Scholar]
- 4.Perrin J.B. Brownian motion and molecular reality. Ann. Chim. Phys. 1909;18:5–114. [Google Scholar]
- 5.Nordlund I. A new determination of Avogadro's number from Brownian motion of small mercury spherules. Z. Phys. Chem. 1914;87:40–62. [Google Scholar]
- 6.Seisenberger G., Ried M.U., Bräuchle C. Real-time single-molecule imaging of the infection pathway of an adeno-associated virus. Science. 2001;294:1929–1932. doi: 10.1126/science.1064103. [DOI] [PubMed] [Google Scholar]
- 7.Golding I., Cox E.C. Physical nature of bacterial cytoplasm. Phys. Rev. Lett. 2006;96:098102. doi: 10.1103/PhysRevLett.96.098102. [DOI] [PubMed] [Google Scholar]
- 8.Caspi A., Granek R., Elbaum M. Enhanced diffusion in active intracellular transport. Phys. Rev. Lett. 2000;85:5655–5658. doi: 10.1103/PhysRevLett.85.5655. [DOI] [PubMed] [Google Scholar]
- 9.Caspi A., Granek R., Elbaum M. Diffusion and directed motion in cellular transport. Phys. Rev. E. 2002;66:011916. doi: 10.1103/PhysRevE.66.011916. [DOI] [PubMed] [Google Scholar]
- 10.Tolić-Nørrelykke I.M., Munteanu E.-L., Berg-Sørensen K. Anomalous diffusion in living yeast cells. Phys. Rev. Lett. 2004;93:078102. doi: 10.1103/PhysRevLett.93.078102. [DOI] [PubMed] [Google Scholar]
- 11.Selhuber-Unkel C., Yde P., Oddershede L.B. Intracellular diffusion during the cell cycle. Phys. Biol. 2009;6:025015. doi: 10.1088/1478-3975/6/2/025015. [DOI] [PubMed] [Google Scholar]
- 12.Bronstein I., Israel Y., Garini Y. Transient anomalous diffusion of telomeres in the nucleus of mammalian cells. Phys. Rev. Lett. 2009;103:018102. doi: 10.1103/PhysRevLett.103.018102. [DOI] [PubMed] [Google Scholar]
- 13.Platani M., Goldberg I., Swedlow J.R. Cajal body dynamics and association with chromatin are ATP-dependent. Nat. Cell Biol. 2002;4:502–508. doi: 10.1038/ncb809. [DOI] [PubMed] [Google Scholar]
- 14.Pan W., Filobelo L., Vekilov P.G. Viscoelasticity in homogeneous protein solutions. Phys. Rev. Lett. 2009;102:058101. doi: 10.1103/PhysRevLett.102.058101. [DOI] [PubMed] [Google Scholar]
- 15.Wong I.Y., Gardel M.L., Weitz D.A. Anomalous diffusion probes microstructure dynamics of entangled F-actin networks. Phys. Rev. Lett. 2004;92:178101. doi: 10.1103/PhysRevLett.92.178101. [DOI] [PubMed] [Google Scholar]
- 16.Metzler R., Klafter J. The random walk's guide to anomalous diffusion: a fractional dynamics approach. Phys. Rep. 2000;339:1–77. [Google Scholar]
- 17.Scher H., Montroll E.W. Anomalous transit-time dispersion in amorphous solids. Phys. Rev. B. 1975;12:2455–2477. [Google Scholar]
- 18.Scher H., Margolin G., Berkowitz B. The dynamical foundation of fractal stream chemistry: The origin of extremely long retention times. Geophys. Res. Lett. 2002;29:1061. [Google Scholar]
- 19.Silvestri L., Fronzoni L., Allegrini P. Event-driven power-law relaxation in weak turbulence. Phys. Rev. Lett. 2009;102:014502. doi: 10.1103/PhysRevLett.102.014502. [DOI] [PubMed] [Google Scholar]
- 20.Zimmerman S.B., Minton A.P. Macromolecular crowding: biochemical, biophysical, and physiological consequences. Annu. Rev. Biophys. Biomol. Struct. 1993;22:27–65. doi: 10.1146/annurev.bb.22.060193.000331. [DOI] [PubMed] [Google Scholar]
- 21.Saxton M.J. Anomalous diffusion due to obstacles: a Monte Carlo study. Biophys. J. 1994;66:394–401. doi: 10.1016/s0006-3495(94)80789-1. [DOI] [PMC free article] [PubMed] [Google Scholar]
- 22.Condamin S., Tejedor V., Klafter J. Probing microscopic origins of confined subdiffusion by first-passage observables. Proc. Natl. Acad. Sci. USA. 2008;105:5675–5680. doi: 10.1073/pnas.0712158105. [DOI] [PMC free article] [PubMed] [Google Scholar]
- 23.Condamin S., Bénichou O., Klafter J. First-passage time distributions for subdiffusion in confined geometry. Phys. Rev. Lett. 2007;98:250602. doi: 10.1103/PhysRevLett.98.250602. [DOI] [PubMed] [Google Scholar]
- 24.Szymanski J., Weiss M. Elucidating the origin of anomalous diffusion in crowded fluids. Phys. Rev. Lett. 2009;103:038102. doi: 10.1103/PhysRevLett.103.038102. [DOI] [PubMed] [Google Scholar]
- 25.He Y., Burov S., Barkai E. Random time-scale invariant diffusion and transport coefficients. Phys. Rev. Lett. 2008;101:058101. doi: 10.1103/PhysRevLett.101.058101. [DOI] [PubMed] [Google Scholar]
- 26.Lubelski A., Sokolov I.M., Klafter J. Nonergodicity mimics inhomogeneity in single particle tracking. Phys. Rev. Lett. 2008;100:250602. doi: 10.1103/PhysRevLett.100.250602. [DOI] [PubMed] [Google Scholar]
- 27.Deng W., Barkai E. Ergodic properties of fractional Brownian-Langevin motion. Phys. Rev. E Stat. Nonlin. Soft Matter Phys. 2009;79:011112. doi: 10.1103/PhysRevE.79.011112. [DOI] [PubMed] [Google Scholar]
- 28.Havlin S., ben-Avraham D. Diffusion in disordered media. Adv. Phys. 1987;36:695–798. [Google Scholar]
- 29.Meroz Y., Eliazar I., Klafter J. Facilitated diffusion in a crowded environment: from kinetics to stochastics. J. Phys. A. 2009 In press. [Google Scholar]
- 30.Loverdo C., Bénichou O., Desbiolles P. Quantifying hopping and jumping in facilitated diffusion of DNA-binding proteins. Phys. Rev. Lett. 2009;102:188101. doi: 10.1103/PhysRevLett.102.188101. [DOI] [PubMed] [Google Scholar]
- 31.O'Shaughnessy B., Procaccia I., I Analytical solutions for diffusion on fractal objects. Phys. Rev. Lett. 1985;54:455–458. doi: 10.1103/PhysRevLett.54.455. [DOI] [PubMed] [Google Scholar]
- 32.Kantor Y., Kardar M. Anomalous diffusion with absorbing boundary. Phys. Rev. E Stat. Nonlin. Soft Matter Phys. 2007;76:061121. doi: 10.1103/PhysRevE.76.061121. [DOI] [PubMed] [Google Scholar]
- 33.Lizana L., Ambjörnsson T. Single-file diffusion in a box. Phys. Rev. Lett. 2008;100:200601. doi: 10.1103/PhysRevLett.100.200601. [DOI] [PubMed] [Google Scholar]
- 34.Mandelbrot B.B., van Ness J.W. Fractional Brownian motions, fractional noises and applications. SIAM Rev. 1968;10:422–437. [Google Scholar]
- 35.Unterberger J. Stochastic calculus for fractional Brownian motion with Hurst exponent H > 1/4: a rough path method by analytic extension. Ann. Probab. 2009;37:565–614. [Google Scholar]
- 36.Bidaux R., Chave J., Vocka R. Finite time and asymptotic behavior of the maximal excursion of a random walk. J. Phys. A. 1999;32:5009–5016. [Google Scholar]
- 37.Feller W. Vol. 2. Wiley; New York: 1971. (An Introduction to Probability Theory and Its Applications). [Google Scholar]
- 38.Ben-Avraham D., Havlin S. Cambridge University Press; Cambridge, UK: 2000. Diffusion and Reactions in Fractals and Disordered Systems. [Google Scholar]
- 39.Metzler R., Glöckle W.G., Nonnenmacher T.F. Fractional model equation for anomalous diffusion. Physica A. 1994;211:13–24. [Google Scholar]
- 40.Barkai E., Cheng Y.C. Ageing continuous time random walks. J. Chem. Phys. 2003;118:6167–6178. [Google Scholar]
- 41.Arcizet D., Meier B., Heinrich D. Temporal analysis of active and passive transport in living cells. Phys. Rev. Lett. 2008;101:248103. doi: 10.1103/PhysRevLett.101.248103. [DOI] [PubMed] [Google Scholar]
Associated Data
This section collects any data citations, data availability statements, or supplementary materials included in this article.