

Abstract
Airway hyperresponsiveness is a major characteristic of asthma and is generally ascribed to excessive airway narrowing associated with the contraction of airway smooth muscle cells (ASMCs). ASMC contraction is initiated by a rise in intracellular calcium concentration ([Ca2+]i), observed as oscillatory Ca2+ waves that can be induced by either agonist or high extracellular K+ (KCl). In this work, we present a model of oscillatory Ca2+ waves based on experimental data that incorporate both the inositol trisphosphate receptor and the ryanodine receptor. We then combined this Ca2+ model and our modified actin-myosin cross-bridge model to investigate the role and contribution of oscillatory Ca2+ waves to contractile force generation in mouse ASMCs. The model predicts that: 1), the difference in behavior of agonist- and KCl-induced Ca2+ waves results principally from the fact that the sarcoplasmic reticulum is depleted during agonist-induced oscillations, but is overfilled during KCl-induced oscillations; 2), regardless of the order in which agonist and KCl are added into the cell, the resulting [Ca2+]i oscillations will always be the short-period, agonist-induced-like oscillations; and 3), both the inositol trisphosphate receptor and the ryanodine receptor densities are higher toward one end of the cell. In addition, our results indicate that oscillatory Ca2+ waves generate less contraction than whole-cell Ca2+ oscillations induced by the same agonist concentration. This is due to the spatial inhomogeneity of the receptor distributions.
Introduction
Contraction of airway smooth muscle cells (ASMCs) in the walls of the tracheobronchial tree results in a narrowing of the airway and is associated with obstructive lung disease such as asthma. In ASMCs, a change in the cytosolic concentration of calcium ([Ca2+]i) is the primary-signal-regulating contractile function (1–5); an increase in [Ca2+]i activates myosin light chain kinase, which, in turn, phosphorylates myosin, thus stimulating cross-bridge cycling and contraction. In ASMCs, this change in [Ca2+]i does not take the form of a simple increase, but instead occurs as oscillatory Ca2+ waves.
Oscillatory Ca2+ waves in ASMCs have been observed in different species and cell preparations (6–11) and are usually initiated by contractile agonists such as acetylcholine (ACh), methacholine (MCh), or 5-hydroxytryptamine (5-HT). Surprisingly, Ca2+ oscillations can also be initiated in mouse ASMCs by high extracellular K+; these Ca2+ oscillations usually have a much lower frequency than agonist-induced Ca2+ oscillations (10,11). Both types of oscillatory Ca2+ waves involve Ca2+ release from the internal Ca2+ store, the sarcoplasmic reticulum (SR) (4,8,10). Ca2+ release from the SR is controlled by either the inositol trisphosphate receptor (IPR) or the ryanodine receptor (RyR), both of which exhibit Ca2+-induced Ca2+ release (CICR).
Some experimental results suggest that agonist-induced Ca2+ oscillations can be mediated by CICR via the RyR (6,7). However, other experimental results have shown no such dependence on the RyR, but instead demonstrate that agonist-induced oscillations depend on Ca2+ release through the IPR (10–13). In contrast to agonist-induced Ca2+ oscillations, KCl-induced oscillations appear to be initiated by an influx of Ca2+ via L-type and/or T-type Ca2+ channels (10). The cell appears to compensate for this Ca2+ influx by transporting the surplus Ca2+ from the cytosol into the SR via SERCA pumps. It was hypothesized in Perez and Sanderson (10) that this Ca2+ influx into the SR leads to the overloading of the SR. The consequence of this is an increase in the open probability of the RyR and the triggering of prolonged CICR via the sensitized RyRs to empty the SR and raise the [Ca2+]i.
To understand the mechanisms mediating these two types of Ca2+ oscillations and waves in mouse ASMCs, we have constructed and analyzed a model of oscillatory Ca2+ waves, based on previously published experimental data (10), which include both the IPR and the RyR. The initial version of the model ignores the spatial aspects of intracellular Ca2+ dynamics, assuming instead that the cell is a well-mixed system. The model is then extended by the inclusion of Ca2+ diffusion, to simulate oscillatory intracellular waves.
Our ultimate goal is to investigate the role and contribution of oscillatory Ca2+ waves to contractile force generation in ASMCs. Therefore, we subsequently combined our model of oscillatory Ca2+ waves with our modified cross-bridge model (14) to calculate isometric force generation in response to changes in [Ca2+]i.
The Whole-Cell Model
The model is based on the schematic diagram shown in Fig. 1 and incorporates the dynamics of [Ca2+] in both the cytoplasm and the SR, denoted by c and cs, respectively. An increase in [Ca2+]i can result from entry of Ca2+ from the external environment or release from the SR. Ca2+ influx from the external environment occurs via voltage-dependent Ca2+ channels and arachidonic-acid-operated channels (AAOC). Ca2+ release from the SR is through the IPR, the RyR, and a generic leak. [Ca2+]i is reduced by pumping Ca2+ out of the cell through an ATPase pump and back to the SR by the SERCA pump.
Figure 1.
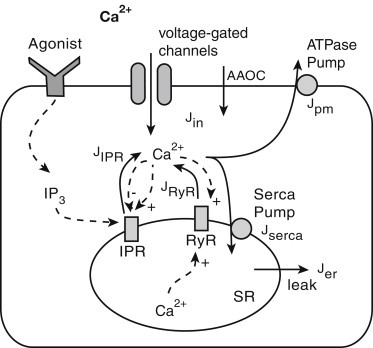
Schematic diagram of the Ca2+ model. Ca2+ can be released from the sarcoplasmic reticulum (SR) though the inositol trisphosphate receptor (IPR), the ryanodine receptor (RyR), and a generic leak. Binding of agonist to the receptor in the outer cell membrane stimulates IP3 production. IP3 binds to the IPR in the SR, thus opening the receptor and leading to Ca2+ release. Initially, this has a positive feedback on the IPR and RyR open probabilities, thus triggering the release of more Ca2+ into the cytoplasm. At higher [Ca2+]i, this feedback loop becomes negative and closes the IPR. The increase in [Ca2+] in the SR also has a positive feedback on the RyR open probability. Ca2+ can be pumped into the SR through the SERCA pump and out of the cell via the ATPase pump. Ca2+ enters the cell through voltage-gated Ca2+ channels or arachidonic-acid-operated channels (AAOC). The Ca2+ fluxes are denoted by solid lines. The dashed lines represent the feedback effects on various mechanisms in the cell.
IP3 receptor
The binding of an agonist to a receptor in the cell's surface membrane triggers a chain reaction leading to the production of the second messenger IP3. The IP3 diffuses through the cytosol and binds to the IPR, causing Ca2+ to be released from the SR. It was experimentally determined that in ASMCs, Ca2+ oscillations are controlled by exerting both positive and negative feedback on the gating of the IPR (15). These feedback loops occur on different timescales. Hence, shorter-period oscillations in ASMCs do not depend on oscillations in [IP3].
To complicate the situation, Ca2+ oscillations and waves have been shown to be the aggregate of a number of stochastic elementary Ca2+ release events (16,17). These localized Ca2+ release events occur at a single or a small cluster of receptor sites and are termed Ca2+ puffs when involving an IPR. Ca2+ puffs have been studied in detail in Xenopus oocytes (18) and more recently in SH-SY5Y cells (19). These Ca2+ puffs and their propagation during Ca2+ waves and oscillations can be modeled using a stochastic Markov process (20).
Although stochastic effects play a major role in intracellular Ca2+ dynamics in ASMCs, stochastic simulation of individual or small clusters of IPR is computationally prohibitively expensive. Furthermore, the conditions under which deterministic modeling of Ca2+ release via the IPR is insufficient are not fully understood (20,21). Therefore, we used a deterministic approach to model the open probability of the IPR; although this approach will not capture stochastic dynamics, it is sufficient to construct a model with substantial predictive power.
Our model of the IPR is based on the De Young and Keizer model (21–23),
where the variable p denotes [IP3] in the cytoplasm. As we do not model any of the intervening steps between addition of the agonist and the production of IP3, we can use p as a surrogate indication of the agonist level. The variable y represents the proportion of IPR that have been inactivated by Ca2+. The variables ki and are the receptor binding and dissociation constants, respectively.
Ryanodine receptor
A number of RyR models have been proposed in the relevant literature. However, most models are adapted to studying RyR dynamics in cardiac cells (24) due to its importance in excitation-contraction. Roux and Marhl (25) developed a model to study caffeine-induced Ca2+ oscillations in ASMCs. This model assumes a direct dependence of RyR open probability on caffeine concentration, making it unsuitable for our study of KCl-induced [Ca2+]i oscillations.
Friel (26) proposed a simple model to simulate CICR in bullfrog sympathetic neurons. Despite its simplicity, this model provides an excellent quantitative description of Ca2+ oscillations over the entire oscillatory cycle. We use a modified version of this RyR model in our work. As previously hypothesized (10), the open probability of the RyR is increased in response to SR overloading (27). We therefore modified the Friel model to include a store-dependent term (28). Hence the open probability of the RyR is
Other fluxes
The Ca2+ flux through the SERCA pump is approximated by a sigmoidal function of c, with a Hill coefficient of 2 as suggested in Lytton et al. (29). Thus
where Ve is the maximum rate of the pump and Ke is the half-activation for Ca2+.
Although we know that agonists cause an increase in Ca2+ influx, the exact mechanism between the influx of extracellular Ca2+ (Jin) and p remains unknown (30). Therefore, we chose a simple form for Ca2+ influx via AAOC as an increasing function of [IP3]. Hence, we modeled Jin to include a voltage-dependent, an AAOC-dependent, and a constant basal level term, as
where ICa is the current of the Ca2+ voltage-gated channel and F is the Faraday constant.
The Ca2+ efflux from the cell is maintained by the plasma membrane pump, which is modeled by
Membrane potential
In this model, the voltage-dependent ICa current is described by the product of its macroscopic conductance, a voltage-dependent activation gating variable (representing the fraction of current flow for a given membrane potential), and the driving force (31). Hence
where gCa is the conductance and m is the activation-gating variable (32). We modeled m using the sigmoidal relationship
where Vm represents the voltage at which the current is half-maximally activated. The driving force for Ca2+, VCa, is obtained from the Goldman-Hodgkin-Katz equation. Therefore,
where ce is extracellular [Ca2+]. R is the gas constant and T is the absolute temperature.
Summary of the model
In our initial model, we assume the SR and all associated pumps and receptors are continuously distributed throughout the cell interior. Furthermore, we assume the buffers are fast, immobile and have low affinities. Hence the model has the conservation equations for [Ca2+]i as
where δ scales the net Ca2+ flux into the cell. Similarly, γ scales the unit of cs from moles per liter SR into moles per liter cytoplasm. The values kIPR and kRyR represent the densities of the IPR and the RyR, respectively. The value Jrelease includes fluxes across the IPR, the RyR, and a generic leak given by Jer.
The equations of the Ca2+ model and the complete list of parameter values are presented in the Supporting Material.
Results
Agonist-induced oscillations
To simulate an agonist-induced [Ca2+]i oscillation, we solved the system with p = 0.35 μM, indicating the addition of 1 μM acetylcholine (Fig. 2 A). This value of p sets the system to be in an oscillating range (Fig. 2 B). The expanded details of the experimental data and simulations are shown in Fig. 2, C and D. Fig. 2 E shows the corresponding changes in [Ca2+] in the SR. [Ca2+]i oscillations caused depletion of the SR, and Ca2+ release from the SR was mainly through the IPR (Fig. 2 F). The open probability of the RyR was greatly reduced after an initial transient increase (Fig. 2 G). This is because the initial transient increase in [Ca2+]i via the IPR flux, after the addition of agonist, caused CICR through the RyR. As the SR is depleted by [Ca2+]i oscillations, the RyR open probability decreases in response.
Figure 2.
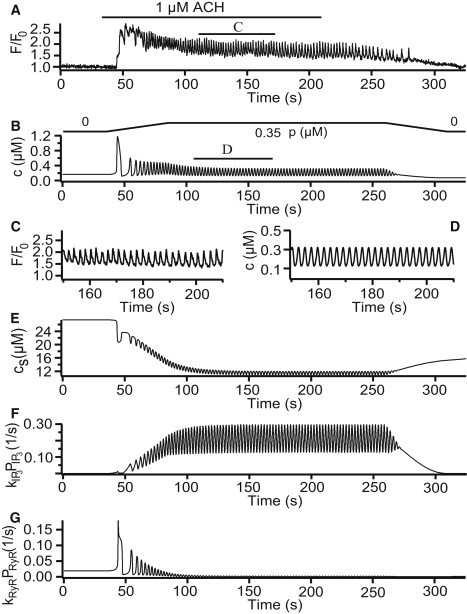
Agonist-induced oscillations. (A) Experimental result from Perez and Sanderson (10), which represents mouse airway smooth muscle cells (ASMCs) stimulated with 1 μM acetylcholine (ACh). (B and D) Numerical simulations of our Ca2+ model. (C) Expanded region of 1 min, indicated by the lower bar in panel A. (E) Changes in [Ca2+] in the sarcoplasmic reticulum (SR). (F and G) Fluxes from the SR via the inositol trisphosphate receptor (IPR) and the ryanodine receptor (RyR), respectively. To simulate the experimental addition and removal of agonist, the increase and decrease in p required 50 s to reach its maximum level. Parameter values are shown in the Supporting Material with p = 0.35 μM and V = –60 mV.
KCl-induced oscillations
To simulate the [Ca2+]i oscillations caused by membrane depolarization, we solved the system with V = –30 mV, indicating the addition of 100 mM KCl (Fig. 3 A). The simulated [Ca2+]i oscillation is shown in Fig. 3 B. Fig. 3 C shows the corresponding changes in [Ca2+] in the SR, indicating there is an obvious overfilling of the SR before its depletion. The overloading of the SR caused the open probability of the RyR to increase (Fig. 3 E), thus leading to the rise in [Ca2+]i. The simulation does not involve agonist, hence the Ca2+ release from the SR via the IPR remains zero (Fig. 3 D).
Figure 3.
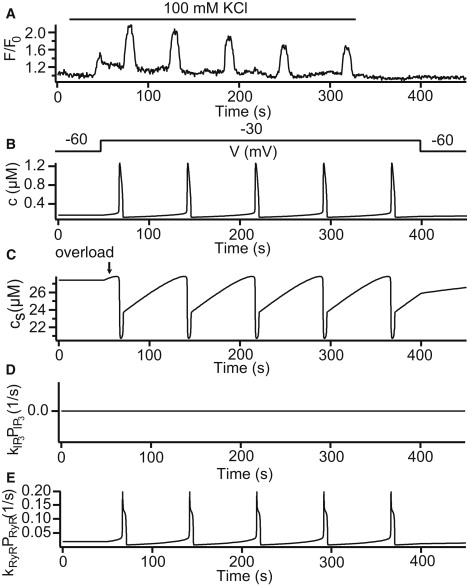
KCl-induced oscillations. (A) Experimental result from Perez and Sanderson (10), which represents mouse airway smooth muscle cells (ASMCs) stimulated with 100 mM KCl. (B) Numerical solution with p = 0 μM and V = –30 mV. (C) Changes in [Ca2+] in the SR. (D and E) Fluxes from the sarcoplasmic reticulum (SR) via the inositol trisphosphate receptor (IPR) and the ryanodine receptor (RyR), respectively. Parameter values are shown in the Supporting Material.
The role of extracellular Ca2+
[Ca2+]i oscillations can be induced by agonist, but not maintained in the absence of the extracellular Ca2+ (10). Both the experimental result and the model simulation are included in the Supporting Material. With zero extracellular Ca2+, KCl does not cause a change in [Ca2+]i (10). As expected, numerical simulation of our model in this case did not provide any [Ca2+]i oscillations (result not shown).
Closed-cell model
It has previously been shown that a useful way of understanding the behavior of models such as these is to introduce a new variable related to the total amount of Ca2+ in the cell (30). Hence, we introduced the variable ct (the total number of moles of Ca2+ in the cell divided by the cytoplasmic volume), which is defined as ct = c + (1/γ)cs. We thus treat ct as a bifurcation parameter and investigate the behavior of the model for fixed values of ct. Our result showed that long-period KCl-induced [Ca2+]i oscillations have a very different oscillating range in ct compared to the short-period agonist-induced oscillations. Higher agonist levels induce [Ca2+]i oscillations in a lower ct. For a more detailed explanation of this technique and the bifurcation diagram of our model, please see the Supporting Material.
Increased Ca2+ load
We first explored the behavior of the oscillation model with the parameter values shown in the Supporting Material by treating p and V as the bifurcation parameters. We then varied the Ca2+ load of the system by changing the basal level of Jin flux (α0). Our result showed that increasing α0 changes the dynamics of the system. With higher Ca2+ load, long-period [Ca2+]i oscillations occur in the low agonist region. This indicates RyR-dominated Ca2+ release. In addition, between the short- and long-period [Ca2+]i oscillation regions, the receptors showed strong interaction, and period-doubling bifurcations occur leading to mixed-mode oscillations.
We then performed the two-parameter bifurcation analysis (p versus V) with different α0 values. By increasing p, the short, mixed-mode and long-period oscillations were observed. The figures indicate no qualitative differences in this analysis between the two Ca2+ loads. With Ca2+ load increasing, both short- and long-period oscillation regions expand accordingly.
We included these bifurcation diagrams and a more detailed explanation in the Supporting Material.
Model prediction
Based on the two-parameter bifurcation analysis, we predict that long-period KCl-induced Ca2+ oscillations are replaced by short-period oscillations when a high concentration of agonist is added to the cell (Fig. 4 A). However, when reversing the order of these two stimuli, we only observe short-period Ca2+ oscillations (Fig. 4 D). Fig. 4, B and E, shows the model predictions of [Ca2+] in the SR during these two simulations. The prediction has been verified by experiment and results are shown in Fig. 4, C and F. The reason for this result is that agonist always depletes the SR, hence the RyR is unable to open and release Ca2+. Therefore, the RyR becomes inoperative and short-period agonist-induced oscillations always dominate.
Figure 4.

Model prediction. (A and B) Numerical simulations of [Ca2+] oscillations in the cytosol and sarcoplasmic reticulum (SR), respectively. In this simulation, V = –40 mV and p is set to be 0.35 μM at t = 250 s. (C) Experimental result of [Ca2+]i oscillations induced by 50 mM KCl and 200 nM methacholine (MCh) that were consecutively added to the mouse airway smooth muscle cell (ASMC). (D and E) Numerical simulations with p = 0.35 μM and V set to –40 mV at t = 80 s. (F) [Ca2+]i oscillations corresponding to the reverse order of stimuli. Parameter values are shown in the Supporting Material.
Oscillatory Ca2+ waves
Experimental results in Perez and Sanderson (10) indicate that Ca2+ oscillations induced by agonist consist of Ca2+ waves that propagate along the entire cell (Fig. 5 A). However, KCl-induced waves show elemental Ca2+ events that do not propagate through the whole-cell (indicated by arrows in Fig. 5 A). These elemental Ca2+ events become more frequent and pronounced immediately before a Ca2+ wave. After each Ca2+ wave, there is an inhibitory period before the elemental Ca2+ events start again.
Figure 5.

Ca2+ waves and elemental Ca2+ events in ASMCs induced by agonist and KCl. (A) Experimental results of line scans from the longitudinal axes of single mouse ASMC during simulation with 1 μM 5-hydroxytryptamine (5-HT), 1 μM acetylcholine (ACh), and 50 mM KCl (10). The line scans show ∼13 μm along the center of the cell. The elemental Ca2+ events in the KCl-induced Ca2+ wave are indicated by arrows. It was assumed that a smooth muscle cell is ∼40-μm-long in our model. (B and C) Numerical results showing Ca2+ waves close to the center of the smooth muscle cell (15–30 μm) induced by agonist and KCl, respectively. The slopes of the open lines in panel A as well as the colored lines in panels B and C indicate the velocity and direction of the Ca2+ waves in the mouse airway smooth muscle cell (ASMC). (D and E) Distributions of inositol trisphosphate receptor (IPR) and the ryanodine receptor (RyR) densities along the cell length u, respectively. Parameter values are shown in the Supporting Material.
The slopes of the open lines in the line-scan plots indicate the velocity (μm/s) and direction of the Ca2+ waves in the SMCs. Compared to agonist-induced waves, KCl-induced waves have a slower wave velocity and a longer duration. The initiation site of the agonist-induced Ca2+ waves can change and cause the wave to travel in the opposite direction (Fig. 5 A). However, the initiation site of KCl-induced waves seems to be close to the location exhibiting the highest frequency of elemental Ca2+ events. The line scans in Fig. 5 A show ∼13 μm along the center of the cell.
Our Ca2+ oscillation model was converted into a model for Ca2+ waves by including Ca2+ diffusion. Experimentally observed intracellular Ca2+ waves in mouse-lung-slice preparations exhibit very little, if any, curvature, and thus can effectively be modeled as one-dimensional (see supplemental videos in Perez and Sanderson (10)). Hence, we only consider a model with one spatial variable. Thus
where Dc is the diffusion coefficient of Ca2+ and the rest of the model remains the same. The spatial variable is u and it was assumed that both IPR and RyR densities are not spatially homogeneous. Parameters kIPR(u) and kRyR(u) control the variations in IPR and RyR densities, respectively.
In Fig. 5, B and C, we show Ca2+ wave density plots of waves induced by agonist and KCl, respectively. These plots only show an area of 15 μm along the center of the SMC in order to match the experimental data presented in Fig. 5 A. Our agonist-induced simulations are in good agreement with the experimental results and show that waves only change direction close to the center. In both simulations, the wave patterns at the ends of the cell are qualitatively the same as the ones from the middle of the cell (although there are no changes in direction).
There is, however, one important qualitative feature lacking from our model. Because our model is entirely deterministic, our KCl-induced simulations do not exhibit elemental Ca2+ events. Prior research (20,21) has shown that the elemental Ca2+ events observed experimentally can be reproduced by including stochastic properties of the IPR in the model. Similar methods can be applied for modeling stochastic RyR. It is not clear whether a fully stochastic model would result in qualitatively different predictions, although we believe this unlikely to be the case. In any case, the spatial properties of the elemental events have not yet been studied experimentally in sufficient detail to allow a proper statistical comparison between the model and the data.
Fig. 5, D and E, illustrates the predicted distributions of IPR and RyR densities along the cell. Our model predicts that both IPR and RyR densities are higher at one end of the cell, with RyR density sloping more steeply between the two levels than IPR density. Although we investigated several other hypotheses (included in the Supporting Material), they did not provide satisfactory results in the sense that we were unable to reproduce, even qualitatively, the observed experimental results. In other words, the predicted distributions shown in Fig. 5, D and E, are the only ones we have been able to find that reproduce the experimentally observed results. It is not difficult to find plausible reasons for why this particular receptor distribution should work as observed. Because of the gradient in receptor density, each end of the cell is trying to oscillate at a slightly different frequency. The two ends are able to maintain partial synchronization for a short time, but eventually one end lags too far behind the other. When this happens, the wave cannot then travel the entire length of the cell, but stops halfway (as it hits a refractory region), leaving the slower end of the cell free to initiate the next wave, which thus travels in the opposite direction. Repetition of this process results in waves that regularly change direction.
This conclusion is not based on a rigorous model comparison using a statistical analysis, and hence should be used with caution, but it nevertheless provides a testable prediction of IPR and RyR density distributions in ASMCs. Although this prediction is possibly surprising—it is difficult to think of any physiological reason for such gradients in IPR and RyR density—we know of no a priori reason to believe they are impossible. Only an experimental test will be able to address this question. We are currently developing experiments to test this prediction, but as yet no data are available.
Oscillatory Ca2+ waves and force generation
This study is part of a larger project with the goal of developing a distributed multiscale model of the lung to help our understanding of airway hyperresponsiveness. At the cellular level our objective is to understand how these changes in [Ca2+]i are translated into contractile force, and how different Ca2+ oscillations can differentially affect contraction, and thus lung impedance.
We studied the role and relative contribution of Ca2+ waves versus whole-cell Ca2+ oscillations in force generation via the cross-bridge cycle. This was done using a model obtained by combining the wave model and our modified cross-bridge model (14). We only compare the steady-state mean relative force generated for each of these two cases. Although we have previously shown that the isotonic and isometric responses are qualitatively different in terms of transient behavior (14), at the steady state they are qualitatively the same. Due to the computational complexity of isotonic force generation, here we only calculate isometric force. Hence, although this will not generate quantitative predictions valid for the isotonic case, it will still provide the correct qualitative description of the effects on contraction of both oscillation types or spatial heterogeneity of the Ca2+ response.
For convenience, we include the equations of the cross-bridge model and the parameter values used in the computations in the Supporting Material.
Our results indicate that whole-cell Ca2+ oscillations induce greater contraction than Ca2+ waves (Fig. 6 A) for every agonist concentration (referring p). The reason for this is not obvious, as such differences in generated force could be the result of different oscillation frequencies, different mean [Ca2+]i, or other factors.
Figure 6.

Steady-state mean relative force generated by both Ca2+ waves and whole-cell Ca2+ oscillations represented by stars and circles in all plots, respectively. (A) Relationships between mean relative isometric force and increases in agonist level (p μM). (B and C) Changes in oscillation frequency and average [Ca2+]i corresponding to varied levels of p, respectively. (D) Data are taken from Wang et al. (14), their Fig. 8 C, and shows the contractile response of airway to Ca2+ oscillations (i.e., square waves) with different average [Ca2+]i. Note that smaller mean relative airway area corresponds to stronger contraction. For comparison, the area obtained from a constant Ca2+ signal of equal average is shown (dashed line). The dot-dashed line gives the mean area for the limit case at high frequency oscillations (for detailed calculation, see Wang et al. (14)). In all panels, Ca2+ waves (marked as stars) and whole-cell Ca2+ oscillations (marked as circles) induced by p ∼0.32 μM (red) and p ∼0.6 μM (blue). Parameter values are shown in the Supporting Material.
However, Fig. 6, B and C, shows that this is not the case.
First, at each p, Ca2+ waves and whole-cell Ca2+ oscillations have similar oscillation frequencies (Fig. 6 B, colored stars and circles). Here both whole-cell Ca2+ oscillations and Ca2+ waves exhibit consistently high frequencies (0.38–0.49 spikes/s in Fig. 6 B). In prior work we demonstrated that increases in frequency above five spikes/min (0.083 spikes/s) for a particular level of average [Ca2+]i cause little additional contraction in ASMCs (14). Hence, any difference in frequency between the two modes of Ca2+ oscillations investigated is unlikely to have a significant effect on force generation.
Secondly, Fig. 6 C shows at lower values of p the oscillations have a higher mean [Ca2+]i, whereas the opposite is true at higher values of p. Hence, neither differences in frequency, nor differences in mean [Ca2+]i can explain why oscillations generate greater contraction.
The answer to this puzzle becomes apparent only when we consider previous work. Fig. 6 D (adapted from Wang et al. (14)) illustrates the relationship between mean relative airway area (note that a small area corresponds to large contraction) and average [Ca2+]i, for different wave shapes. We used square-waves (i.e., periodic piecewise linear function), which have the same amplitude, to obtain the high frequency (dot-dashed line) and three spikes/min (solid line) curves. The varying average [Ca2+]i is achieved by changing the spike width (14). For a given mean [Ca2+]i, the shape of the wave is an important determinant of generated force. The greater the frequency, the greater the force, and the least force is generated by a constant [Ca2+]i. Hence, an oscillation with a higher mean [Ca2+]i can generate less force, as long as the oscillation shape is similar to a constant [Ca2+]i.
This explains the results in Fig. 6, A–C. At a lower value of p (p ∼0.32 μM; marked by the red circle and star) the mean [Ca2+]i is higher in the oscillation than in the wave, and both wave shapes lie close to the solid curve in Fig. 6 D. Hence, the mean [Ca2+]i has the greater effect, and the oscillation generates more force.
However, when p ∼0.6 μM (blue circle and star), the shape of the wave has changed dramatically, and looks more similar to a constant [Ca2+]i. Thus, although it has a higher mean [Ca2+]i than the oscillation, its changed shape means that it continues to generate less force.
It is important to note that this difference between waves and oscillations depends crucially on the assumption that the receptor density is not homogeneous—an assumption that is in turn based on the fact that a heterogeneous receptor density is necessary to reproduce the correct qualitative wave behavior. If IPR and RyR are assumed to have a homogeneous spatial distribution, waves and oscillations give the exact same generated force (results not shown). It implies that the heterogeneous distribution of IPR and RyR has a significant effect on ASMC contraction, and it is thus important that these receptor distributions be measured accurately.
Discussion
We have constructed a model to explore the regulatory mechanisms mediating agonist- and KCl-induced [Ca2+]i oscillations in mouse ASMCs. Our model includes both IPR and RyR, interacting via a common SR. Although both receptors are included in the model, a different receptor dominates for each of the oscillation types. Our results show that in ASMCs, Ca2+ flux from the SR is mainly through the IPR in the agonist-induced case. However, in the KCl-induced case, Ca2+ release from the SR is only through the RyR. This difference in behavior results principally from the fact that the SR is depleted during agonist-induced oscillations, but is overfilled during KCl-induced case. In addition, with zero extracellular [Ca2+], agonist-induced [Ca2+]i oscillations cannot be maintained and KCl does not induce any oscillations. Due to the difficulties of fitting one set of parameter values to three separate sets of experimental data (i.e., agonist- and KCl-induced oscillations, and oscillations in the absence of extracellular Ca2+), our model does not provide quantitative agreement with the experimental results. Most noticeably, simulated agonist-induced oscillations do not exhibit the raised baseline that can be seen clearly in the data, whereas the simulated KCl-induced oscillations are too thin. It is likely that our highly simplified description of Ca2+ influx is to blame for the baseline discrepancies, whereas Ca2+ pump rates are probably playing a major role in setting the width of the KCl-induced oscillations. However, despite these quantitative deficiencies, the model does provide testable predictions, all of which were subsequently validated experimentally. Thus, although our model clearly does not capture all the mechanisms underlying the Ca2+ oscillations, it does capture many of them, and retains considerable predictive capability.
Membrane depolarization is an important aspect in mediating SMC contractility. The addition of KCl leads to an increase in extracellular [K+], thus causing the membrane to depolarize and the Ca2+ channels to open, allowing an influx of extracellular Ca2+ into the cytoplasm. Our model omits the details of the membrane depolarization process. Hence we can increase V directly in the model to reflect the change in membrane potential induced by the addition of KCl. According to Perez and Sanderson (10), neither L-type nor T-type Ca2+ channels can currently be excluded from participating in KCl-induced Ca2+ influx. The precise identity, distribution, and physiological role of other types of Ca2+ channels in ASMCs is still the subject of ongoing research and beyond the scope of our work (33,34). Therefore we include a nonspecific voltage-gated Ca2+ channel in our model. The model could be modified to account for different types of Ca2+ channels once more conclusive experimental results become available. However, ASMCs are nonexcitable and thus transmembrane events involving these ion channels are likely less important than in excitable ones such as vascular SMC (34). Therefore, a simple model capturing the major electrophysiological processes such as ours may suffice.
SMCs of various types have been studied extensively. A number of models describing various physiological features of SMC related to cellular Ca2+ dynamics have been presented in the literature (35–39). These models, although relevant to their respective cell types, are not directly applicable to ASMCs due to differences in physiological structure and function. In Roux et al. (40), a theoretical model of membrane conductance specific to ASMCs was proposed. In their work they calculate a nonoscillating [Ca2+]i increase and predict the corresponding membrane depolarization and influx of extracellular Ca2+. We investigate [Ca2+]i oscillations caused by membrane depolarization, and so we use the approximate steady-state value of membrane potential V = –60 mV as predicted by their model.
With respect to modeling Ca2+ release from the internal store in SMCs, Parthimos et al. (35), Koenigsberger et al. (36), and Lemon et al. (39) simulated both CICR from the RyR- and IP3-induced Ca2+ release from the IPR. These models assumed two separate internal stores for the two respective receptor types (i.e., a two-pool model). Other models (38,41) were used to simulate either receptor using a single internal store (i.e., single-pool model). In the literature (25,41) it was assumed that extracellular Ca2+ influx is not directly involved in Ca2+ signaling (i.e., closed-cell model). However, due to the importance of extracellular Ca2+ influx in our model to maintain Ca2+ oscillations, we present an open-cell model here. The RyR model presented in Roux and Marhl (25) simulates caffeine-induced Ca2+ oscillations, hence RyR open probability is directly dependent on caffeine concentration, whereas our work focuses on KCl-induced Ca2+ oscillations via membrane depolarization. Our model includes both receptor types as necessitated by our experimental results, but uses a single internal store.
Elemental Ca2+ signals mediated by single or small clusters of RyR, and termed Ca2+ sparks, were initially discovered in cardiac cells and have been studied in a variety of cell types including ASMCs (42–44). Ca2+ sparks during agonist-induced Ca2+ oscillations have been observed in isolated tracheal SMCs of various species (44–47). Similar behavior has been commonly observed in cardiac myocytes that are overloaded with Ca2+ (42). Interestingly, similar experiments with mouse-lung-slice preparations did not produce Ca2+ sparks. The only observation of Ca2+ sparks was under KCl-induced conditions, where it appeared that Ca2+ was leaking into the cell and overloading the internal stores (10,33).
Experimental results from studies of isolated tracheal SMCs presented in the literature (6,7) indicate that agonist-induced [Ca2+]i oscillations are mainly mediated by CICR via the RyR. However, experiments with ASMCs from lung slice preparations do not show this dependence on the RyR, indicating a dependence on the IPR instead (10–13,48). Our results indicate that Ca2+ load is a crucial bifurcation parameter. Under increased Ca2+ load, the dynamics of the system change to produce a region of agonist-induced Ca2+ oscillations dominated by the RyR. We therefore have reason to believe that these experimental results obtained from different cell preparations are not contradictory, but simply correspond to different regions in the bifurcation diagram.
From the two-parameter bifurcation analysis, we predict that no matter in which order agonist and KCl are put into the cell, the resulting [Ca2+]i oscillations will always be the short-period agonist-induced-like oscillations. The experimental results also support this prediction (Fig. 4). Our prediction implies that in ASMCs the addition of agonist will always lead to a decrease of Ca2+ in the SR, thus preventing the RyR from releasing Ca2+. We also predict that low p can cause Ca2+ oscillations that are similar to KCl-induced oscillations. Here the SR can be overfilled as a result of increased Ca2+ influx during low p leading to baseline spiking through the RyR. This prediction has been confirmed qualitatively by experiment (results not shown), although the quantitative agreement is poor.
It is important to note that our model is based on the experimental results in Perez and Sanderson (10). We differentiate the receptors using the oscillation frequency based on the nature of our experimental data. However, we do not claim that this distinction is generally applicable to other experimental results or cell types. It is expected that by balancing Ca2+ fluxes across the outer plasma membrane, the RyR-mediated CICR could also produce fast oscillations. Ventura and Sneyd (49) presented an in-depth bifurcation analysis to investigate IPR- and RyR-mediated Ca2+ oscillations and waves. They concluded that it is not yet clear how changes in the relative effectiveness of IPR and RyR affect Ca2+ oscillations. It is not even clear whether or not it is possible to manipulate the receptors pharmacologically with fine enough precision to be able to answer this question.
We studied the spatio-temporal events of Ca2+ oscillations induced by agonist and KCl in mouse ASMCs by including the Ca2+ diffusion in our Ca2+ model to simulate Ca2+ waves. Our model only considers one spatial dimension. Due to the nature of the experimental results (10), we deem this to be sufficient for our investigation. Here the use of a more complicated geometry, approximating the actual shape of the cell, would likely be of little benefit, but introduce significant computational overheads. Our simulations provide the correct qualitative behavior when compared with experimental results of agonist-induced waves. However, our model cannot simulate the small elemental Ca2+ events in the KCl-induced wave. Our results indicate that both IPR and RyR densities are higher at one end of the cell, with RyR density sloping more steeply between the two levels than IPR density.
Finally, our results also show that oscillatory Ca2+ waves cause less contraction than whole-cell Ca2+ oscillations induced by the same p. The contraction differences can be attributed to the heterogeneous receptor distributions, decreasing the force generated by an oscillatory wave compared to a spatially homogeneous oscillation. This indicates that the inhomogeneity of the receptor distributions plays an important role in ASMC contraction and the spatial distribution of Ca2+ cannot be ignored when computing the force generated by oscillatory Ca2+ waves, and hence must be taken into account even in multiscale models. It is currently unclear how best to include this property. Direct numerical simulation is probably computationally prohibitively expensive, but whole-cell models, which are much faster, are quantitatively inadequate. We shall address this issue in later work.
Supporting Material
References
- 1.de Lanerolle P., Condit J.R., Jr., Adelstein R.S. Myosin phosphorylation, agonist concentration and contraction of tracheal smooth muscle. Nature. 1982;298:871–872. doi: 10.1038/298871a0. [DOI] [PubMed] [Google Scholar]
- 2.Gerthoffer W.T. Regulation of the contractile element of airway smooth muscle. Am. J. Physiol. 1991;261:15–28. doi: 10.1152/ajplung.1991.261.2.L15. [DOI] [PubMed] [Google Scholar]
- 3.Somlyo A.P., Somlyo A.V. Signal transduction and regulation in smooth muscle. Nature. 1994;372:231–236. doi: 10.1038/372231a0. [DOI] [PubMed] [Google Scholar]
- 4.Pabelick C.M., Sieck G.C., Prakash Y.S. Invited review: significance of spatial and temporal heterogeneity of calcium transients in smooth muscle. J. Appl. Physiol. 2001;91:488–496. doi: 10.1152/jappl.2001.91.1.488. [DOI] [PubMed] [Google Scholar]
- 5.Kuo K.H., Dai J., van Breemen C. Relationship between asynchronous Ca2+ waves and force development in intact smooth muscle bundles of the porcine trachea. Am. J. Physiol. Lung Cell. Mol. Physiol. 2003;285:L1345–L1353. doi: 10.1152/ajplung.00043.2003. [DOI] [PubMed] [Google Scholar]
- 6.Prakash Y.S., Kannan M.S., Sieck G.C. Regulation of intracellular calcium oscillations in porcine tracheal smooth muscle cells. Am. J. Physiol. 1997;272:C966–C975. doi: 10.1152/ajpcell.1997.272.3.C966. [DOI] [PubMed] [Google Scholar]
- 7.Kannan M.S., Prakash Y.S., Sieck G.C. Role of ryanodine receptor channels in Ca2+ oscillations of porcine tracheal smooth muscle. Am. J. Physiol. 1997;272:L659–L664. doi: 10.1152/ajplung.1997.272.4.L659. [DOI] [PubMed] [Google Scholar]
- 8.Dai J.M., Kuo K.H., Lee C.H. Mechanism of ACh-induced asynchronous calcium waves and tonic contraction in porcine tracheal muscle bundle. Am. J. Physiol. Lung Cell. Mol. Physiol. 2006;290:L459–L469. doi: 10.1152/ajplung.00092.2005. [DOI] [PubMed] [Google Scholar]
- 9.Dai J.M., Kuo K.H., Lee C.H. Acetylcholine-induced asynchronous calcium waves in intact human bronchial muscle bundle. Am. J. Respir. Cell Mol. Biol. 2007;36:600–608. doi: 10.1165/rcmb.2006-0096OC. [DOI] [PubMed] [Google Scholar]
- 10.Perez J.F., Sanderson M.J. The frequency of calcium oscillations induced by 5-HT, ACh, and KCl determine the contraction of smooth muscle cells of intrapulmonary bronchioles. J. Gen. Physiol. 2005;125:535–553. doi: 10.1085/jgp.200409216. [DOI] [PMC free article] [PubMed] [Google Scholar]
- 11.Bai Y., Sanderson M.J. Airway smooth muscle relaxation results from a reduction in the frequency of Ca2+ oscillations induced by a cAMP-mediated inhibition of the IP3 receptor. Respir. Res. 2006;7:34. doi: 10.1186/1465-9921-7-34. [DOI] [PMC free article] [PubMed] [Google Scholar]
- 12.Bai Y., Sanderson M.J. The contribution of Ca2+ signaling and Ca2+ sensitivity to the regulation of airway smooth muscle contraction is different in rats and mice. Am. J. Physiol. Lung Cell. Mol. Physiol. 2009;296:L947–L958. doi: 10.1152/ajplung.90288.2008. [DOI] [PMC free article] [PubMed] [Google Scholar]
- 13.Bai Y., Edelmann M., Sanderson M.J. The contribution of inositol 1,4,5-trisphosphate and ryanodine receptors to agonist-induced Ca2+ signaling of airway smooth muscle cells. Am. J. Physiol. Lung Cell. Mol. Physiol. 2009;297:L347–L361. doi: 10.1152/ajplung.90559.2008. [DOI] [PMC free article] [PubMed] [Google Scholar]
- 14.Wang I., Politi A.Z., Sneyd J. A mathematical model of airway and pulmonary arteriole smooth muscle. Biophys. J. 2008;94:2053–2064. doi: 10.1529/biophysj.107.113977. [DOI] [PMC free article] [PubMed] [Google Scholar]
- 15.Sneyd J., Tsaneva-Atanasova K., Yule D.I. A method for determining the dependence of calcium oscillations on inositol trisphosphate oscillations. Proc. Natl. Acad. Sci. USA. 2006;103:1675–1680. doi: 10.1073/pnas.0506135103. [DOI] [PMC free article] [PubMed] [Google Scholar]
- 16.Macrez N., Mironneau J. Local Ca2+ signals in cellular signaling. Curr. Mol. Med. 2004;4:263–275. doi: 10.2174/1566524043360762. [DOI] [PubMed] [Google Scholar]
- 17.Coombes S., Hinch R., Timofeeva Y. Receptors, sparks and waves in a fire-diffuse-fire framework for calcium release. Prog. Biophys. Mol. Biol. 2004;85:197–216. doi: 10.1016/j.pbiomolbio.2004.01.015. [DOI] [PubMed] [Google Scholar]
- 18.Marchant J., Callamaras N., Parker I. Initiation of IP3-mediated Ca2+ waves in Xenopus oocytes. EMBO J. 1999;18:5285–5299. doi: 10.1093/emboj/18.19.5285. [DOI] [PMC free article] [PubMed] [Google Scholar]
- 19.Smith I.F., Wiltgen S.M., Parker I. Localization of puff sites adjacent to the plasma membrane: functional and spatial characterization of Ca2+ signaling in SH-SY5Y cells utilizing membrane-permeant caged IP3. Cell Calcium. 2009;45:65–76. doi: 10.1016/j.ceca.2008.06.001. [DOI] [PMC free article] [PubMed] [Google Scholar]
- 20.Falcke M. On the role of stochastic channel behavior in intracellular Ca2+ dynamics. Biophys. J. 2003;84:42–56. doi: 10.1016/S0006-3495(03)74831-0. [DOI] [PMC free article] [PubMed] [Google Scholar]
- 21.Keener J.P. Stochastic calcium oscillations. Math. Med. Biol. 2006;23:1–25. doi: 10.1093/imammb/dql002. [DOI] [PubMed] [Google Scholar]
- 22.De Young G.W., Keizer J. A single-pool inositol 1,4,5-trisphosphate-receptor-based model for agonist-stimulated oscillations in Ca2+ concentration. Proc. Natl. Acad. Sci. USA. 1992;89:9895–9899. doi: 10.1073/pnas.89.20.9895. [DOI] [PMC free article] [PubMed] [Google Scholar]
- 23.Keener J., Sneyd J. 2nd Ed. Springer-Verlag; New York: 2008. (Mathematical Physiology). [Google Scholar]
- 24.Stern M.D., Song L.S., Ríos E. Local control models of cardiac excitation-contraction coupling. A possible role for allosteric interactions between ryanodine receptors. J. Gen. Physiol. 1999;113:469–489. doi: 10.1085/jgp.113.3.469. [DOI] [PMC free article] [PubMed] [Google Scholar]
- 25.Roux E., Marhl M. Role of sarcoplasmic reticulum and mitochondria in Ca2+ removal in airway myocytes. Biophys. J. 2004;86:2583–2595. doi: 10.1016/S0006-3495(04)74313-1. [DOI] [PMC free article] [PubMed] [Google Scholar]
- 26.Friel D.D. [Ca2+]i oscillations in sympathetic neurons: an experimental test of a theoretical model. Biophys. J. 1995;68:1752–1766. doi: 10.1016/S0006-3495(95)80352-8. [DOI] [PMC free article] [PubMed] [Google Scholar]
- 27.Lukyanenko V., Györke I., Györke S. Regulation of calcium release by calcium inside the sarcoplasmic reticulum in ventricular myocytes. Pflugers Arch. 1996;432:1047–1054. doi: 10.1007/s004240050233. [DOI] [PubMed] [Google Scholar]
- 28.Shannon T.R., Wang F., Bers D.M. A mathematical treatment of integrated Ca dynamics within the ventricular myocyte. Biophys. J. 2004;87:3351–3371. doi: 10.1529/biophysj.104.047449. [DOI] [PMC free article] [PubMed] [Google Scholar]
- 29.Lytton J., Westlin M., MacLennan D.H. Functional comparisons between isoforms of the sarcoplasmic or endoplasmic reticulum family of calcium pumps. J. Biol. Chem. 1992;267:14483–14489. [PubMed] [Google Scholar]
- 30.Sneyd J., Tsaneva-Atanasova K., Shuttleworth T.J. Control of calcium oscillations by membrane fluxes. Proc. Natl. Acad. Sci. USA. 2004;101:1392–1396. doi: 10.1073/pnas.0303472101. [DOI] [PMC free article] [PubMed] [Google Scholar]
- 31.LeBeau A.P., Robson A.B., Sneyd J. Generation of action potentials in a mathematical model of corticotrophs. Biophys. J. 1997;73:1263–1275. doi: 10.1016/S0006-3495(97)78159-1. [DOI] [PMC free article] [PubMed] [Google Scholar]
- 32.Li Y.X., Rinzel J., Stojilković S.S. Spontaneous electrical and calcium oscillations in unstimulated pituitary gonadotrophs. Biophys. J. 1995;69:785–795. doi: 10.1016/S0006-3495(95)79952-0. [DOI] [PMC free article] [PubMed] [Google Scholar]
- 33.Sanderson M.J., Delmotte P., Perez-Zogbhi J.F. Regulation of airway smooth muscle cell contractility by Ca2+ signaling and sensitivity. Proc. Am. Thorac. Soc. 2008;5:23–31. doi: 10.1513/pats.200704-050VS. [DOI] [PubMed] [Google Scholar]
- 34.Marhl M., Noble D., Roux E. Modeling of molecular and cellular mechanisms involved in Ca2+ signal encoding in airway myocytes. Cell Biochem. Biophys. 2006;46:285–302. doi: 10.1385/CBB:46:3:285. [DOI] [PubMed] [Google Scholar]
- 35.Parthimos D., Edwards D.H., Griffith T.M. Minimal model of arterial chaos generated by coupled intracellular and membrane Ca2+ oscillators. Am. J. Physiol. 1999;277:H1119–H1144. doi: 10.1152/ajpheart.1999.277.3.H1119. [DOI] [PubMed] [Google Scholar]
- 36.Koenigsberger M., Sauser R., Meister J.J. Calcium dynamics and vasomotion in arteries subject to isometric, isobaric, and isotonic conditions. Biophys. J. 2008;95:2728–2738. doi: 10.1529/biophysj.108.131136. [DOI] [PMC free article] [PubMed] [Google Scholar]
- 37.Miftakhov R.N., Abdusheva G.R., Christensen J. Numerical simulation of motility patterns of the small bowel. 1. Formulation of a mathematical model. J. Theor. Biol. 1999;197:89–112. doi: 10.1006/jtbi.1998.0859. [DOI] [PubMed] [Google Scholar]
- 38.Imtiaz M.S., Smith D.W., van Helden D.F. A theoretical model of slow wave regulation using voltage-dependent synthesis of inositol 1,4,5-trisphosphate. Biophys. J. 2002;83:1877–1890. doi: 10.1016/S0006-3495(02)73952-0. [DOI] [PMC free article] [PubMed] [Google Scholar]
- 39.Lemon G., Brockhausen J., Bennett M.R. Calcium mobilization and spontaneous transient outward current characteristics upon agonist activation of P2Y2 receptors in smooth muscle cells. Biophys. J. 2005;88:1507–1523. doi: 10.1529/biophysj.104.043976. [DOI] [PMC free article] [PubMed] [Google Scholar]
- 40.Roux E., Noble P.J., Marhl M. Modeling of calcium handling in airway myocytes. Prog. Biophys. Mol. Biol. 2006;90:64–87. doi: 10.1016/j.pbiomolbio.2005.05.004. [DOI] [PubMed] [Google Scholar]
- 41.Fink C.C., Slepchenko B., Loew L.M. Determination of time-dependent inositol-1,4,5-trisphosphate concentrations during calcium release in a smooth muscle cell. Biophys. J. 1999;77:617–628. doi: 10.1016/S0006-3495(99)76918-3. [DOI] [PMC free article] [PubMed] [Google Scholar]
- 42.Cheng H., Lederer W.J., Cannell M.B. Calcium sparks: elementary events underlying excitation-contraction coupling in heart muscle. Science. 1993;262:740–744. doi: 10.1126/science.8235594. [DOI] [PubMed] [Google Scholar]
- 43.Klein M.G., Cheng H., Schneider M.F. Two mechanisms of quantized calcium release in skeletal muscle. Nature. 1996;379:455–458. doi: 10.1038/379455a0. [DOI] [PubMed] [Google Scholar]
- 44.Pabelick C.M., Prakash Y.S., Sieck G.C. Spatial and temporal aspects of calcium sparks in porcine tracheal smooth muscle cells. Am. J. Physiol. 1999;277:L1018–L1025. doi: 10.1152/ajplung.1999.277.5.L1018. [DOI] [PubMed] [Google Scholar]
- 45.ZhuGe R., Sims S.M., Walsh J.V., Jr. Ca2+ sparks activate K+ and Cl− channels, resulting in spontaneous transient currents in guinea-pig tracheal myocytes. J. Physiol. 1998;513:711–718. doi: 10.1111/j.1469-7793.1998.711ba.x. [DOI] [PMC free article] [PubMed] [Google Scholar]
- 46.Liu Q.H., Zheng Y.M., Wang Y.X. Two distinct signaling pathways for regulation of spontaneous local Ca2+ release by phospholipase C in airway smooth muscle cells. Pflugers Arch. 2007;453:531–541. doi: 10.1007/s00424-006-0130-1. [DOI] [PubMed] [Google Scholar]
- 47.Wang Y.X., Zheng Y.M., Kotlikoff M.I. FKBP12.6 and cADPR regulation of Ca2+ release in smooth muscle cells. Am. J. Physiol. Cell Physiol. 2004;286:C538–C546. doi: 10.1152/ajpcell.00106.2003. [DOI] [PubMed] [Google Scholar]
- 48.Ressmeyer A.R., Bai Y., Sanderson M.J. Human airway contraction and formoteriol-induced relaxation is determined by Ca2+ oscillations and Ca2+ sensitivity. Am. J. Respir. Cell Mol. Biol. 2009 doi: 10.1165/rcmb.2009-0222OC. In press. [DOI] [PMC free article] [PubMed] [Google Scholar]
- 49.Ventura A.C., Sneyd J. Calcium oscillations and waves generated by multiple release mechanisms in pancreatic acinar cells. Bull. Math. Biol. 2006;68:2205–2231. doi: 10.1007/s11538-006-9101-0. [DOI] [PubMed] [Google Scholar]
Associated Data
This section collects any data citations, data availability statements, or supplementary materials included in this article.