

Abstract
We used tapping mode atomic force microscopy to study the morphology of the amyloid protofibrils formed at fixed conditions (low pH with high ionic strength) by self-assembly of the N-terminal domain of the hydrogenase maturation factor HypF. Although all protofibrils in the sample share a beaded structure and similar values of height and width, an accurate analysis of contour length and end-to-end distance and the comparison of experimental data with theoretical predictions based on the worm-like chain model show that two different populations of protofibrils are present. These populations are characterized by different physical properties, such as persistence length, bending rigidity and Young's modulus. Fluorescence quenching measurements on earlier globular intermediates provide an independent evidence of the existence of different populations. The finding that differences in mechanical properties exist even within the same sample of protofibrils indicates the presence of different subpopulations of prefibrillar aggregates with potentially diverse tendencies to react with undesired molecular targets. This study describes a strategy to discriminate between such different subpopulations that are otherwise difficult to identify with conventional analyses.
Introduction
A number of severe pathological conditions are associated with the conversion of a specific protein or peptide from its soluble state into well organized fibrillar aggregates that accumulate in the extracellular space or inside the cells of fundamental tissues (1–3). These disorders include neurodegenerative conditions, such as Alzheimer's, Parkinson's and Creutzfeldt-Jacob disease, nonneuropathic systemic amyloidoses, such as senile systemic amyloidosis, light chain amyloidosis, and dialysis-related amyloidosis, and nonneuropathic localized diseases, such as type-II diabetes and atrial amyloidosis (1–3). The fibrillar assemblies, generally referred to as amyloid fibrils when they accumulate extracellularly, have the ability to bind specific dyes such as thioflavin T and Congo red (4). They consist of two to six protofilaments, each around 2–5 nm in diameter, that generally twist together to form fibrils that are typically 7–13 nm wide (5,6). In each individual protofilament the protein molecules are arranged to form β-strands that run perpendicular to the long axis of the fibril (7,8).
It is increasingly recognized that the small prefibrillar aggregates that accumulate before long mature fibrils are the species that play a key role in the pathogenesis of at least some protein deposition diseases (3). The recent technological progress has allowed the structure of some prefibrillar aggregates of the Alzheimer's Aβ peptide to be investigated in molecular depth by means of hydrogen/deuterium exchange in conjunction with mass spectrometry (9–11) and solid-state NMR (12). In a few cases information on the mechanical properties of some prefibrillar aggregates has also been reported (13). Nevertheless, as prefibrillar aggregates form only transiently and are characterized by a high structural heterogeneity, at present the information on their structure, dynamics, and properties remains poor. Among the various oligomers that have been so far observed in processes of amyloid formation reconstructed in vitro are the protofibrils (14–17). These have the appearance of chains of small spherical oligomers, each having a diameter of 2–5 nm; the chains are worm-like, i.e., they have a curvilinear beaded-like appearance; in addition, such structures contain significant β-sheet structure and are able to bind thioflavin T (14–17).
In this work, we investigate the worm-like protofibrils formed from the N-terminal domain of the Escherichia coli protein HypF (HypF-N) using atomic force microscopy (AFM). It was shown previously that incubation of this protein domain at low pH and high ionic strength promotes the conversion of its partially unfolded, premolten globule state into spherical oligomers that subsequently assemble to form worm-like protofibrils with the structural, morphological and tinctorial characteristics described above, thus similar to the protofibrils formed by other proteins and peptides (18–21). We will show that from a first inspection of the morphology, diameter, and length, such protofibrils seem to have uniform characteristics, differing only for their lengths according to a typical distribution of growing protofibrils. However, using a more sophisticated analysis based on the determination of protofibril contour length and end-to-end distance, it was possible to identify at least two different populations of protofibrils that differ for their persistence length and therefore for mechanical properties such as elasticity modulus and bending rigidity. The presence of different populations is confirmed independently by fluorescence quenching measurements on early spherical oligomeric aggregates. The observation of such a morphological and, more importantly, physico-mechanical heterogeneity within the same sample of protofibrils, will raise the point that subpopulations of prefibrillar aggregates may have completely different characteristics, even in terms of their biological effects in protein deposition diseases.
Materials and Methods
Expression and purification of wild-type and mutated HypF-N
HypF-N was expressed and purified as described previously (19). Protein concentration was assessed by optical absorption (ɛ280 = 12,490 M−1 cm−1) and stock solutions were stored at –20°C in 5 mM acetate buffer, 2 mM dithiothreitol, pH 5.5.
Mutated genes of HypF-N were obtained using the QuikChange site-directed mutagenesis kit from Stratagene (La Jolla, CA). The presence of the desired mutation was assessed by sequencing the entire gene. The gene for mutated HypF-N was cloned in a modified pQE30-Xa plasmid and the variant was expressed at 25°C in E. coli XL-1 Blue cells and purified similarly to the wild-type protein (19). Stock solutions were stored at –80°C in 100 mM potassium phosphate buffer, 2 mM Tris(2-carboxy-ethyl)phosphine hydrochloride, pH 7.1.
Tapping mode AFM
HypF-N was incubated at a concentration of 48 μM at 25°C in 20 mM trifluoroacetic acid (TFA), 330 mM NaCl, pH 1.7, corresponding to a total ionic strength of 350 mM. At fixed times, 20 μL aliquots of protein sample were withdrawn, deposited on a freshly cleaved mica substrate and dried under a gentle nitrogen flow. Before deposition, the sample was diluted from 330 to 1000 times to avoid salt crystallization. TM-AFM images were acquired in air using a Dimension 3100 microscope (Digital Instruments, Veeco, Santa Barbara, CA), equipped with a G scanning head (maximum scan size = 100 μm) and driven by a Nanoscope IIIa controller. Single beam uncoated silicon cantilevers (type RTESPA (Veeco), with nominal spring constant of 40 N/m and resonant frequency 300 kHz, and type OMCL-AC160TS (Olympus, Tokyo, Japan) with nominal spring constant 42 N/m and resonant frequency 300 kHz) were used. The drive frequency was between 260 and 320 kHz, the scan rate was between 1.0 and 1.5 Hz.
Aggregate sizes were obtained from the height in cross section of the topographic AFM images. Although the measured sizes are reduced with respect to fully hydrated conditions due to the drying procedure used to facilitate the sample adhesion to the mica substrate, the aggregate heights reported in the Results were not corrected for shrinking effects caused by sample dehydration. This choice is due to the need of an easier comparison with literature data. However, we have evaluated the shrinking factor by comparing the heights of HypF-N protofibrils measured under liquid and in air after drying under nitrogen; from these measurements we obtained a shrinking factor of 1.9 ± 0.1.
Protofibril apparent widths, wa, were measured from the width in cross section of the topographic AFM images. These values are affected by AFM tip effects, which cause a broadening of the imaged object in the scan plane (22). If the object profile can be modeled with a simple geometrical shape, such enlargement effect can be estimated with geometrical arguments once the tip radius Rt and the object height h are known (the latter is not affected by the tip size). For a semicircular object profile, the expected width w is given by the equation: . The values of w reported in Table 1 were obtained according to this equation.
Table 1.
Morphological and physical parameters of HypF-N protofibrils
| Population 1 | Population 2 | Total | |
|---|---|---|---|
| Protofibril height h (nm)∗ | 1.88 ± 0.02 | 1.92 ±0.02 | 1.89 ±0.01 |
| Raw protofibril width, wa (nm) | 38.8 ± 0.5 | 36.2 ± 0.7 | 38.2 ± 0.4 |
| Corrected protofibril width w (nm)† | 26 ± 1 | 23 ± 1 | 25 ± 1 |
| Contour length L (nm) | 198 ±7 | 390 ± 20 | 240 ± 8 |
| End-to-end distance R (nm) | 140 ± 5 | 99 ± 7 | 131 ± 4 |
| Persistence length P (nm) | 69 ± 3 | 10 ± 1 | 26 ± 2 |
| Bending modulus CB (N m2) | (2.9 ± 0.1) × 10−28 | (4.2 ± 0.4) × 10−29 | (1.1 ± 0.1) × 10−28 |
| Young's modulus Y (Pa) | 5 × 10⁸ | 6 × 10⁷ | 2 × 10⁸ |
Morphological and physical parameters of HypF-N protofibrils grown at 350 mM ionic strength, pH 1.7, 25°C. Standard errors are reported.
The height values reported in this table are not corrected for dehydration effects; height values under hydrated conditions can be obtained multiplying these values by a factor of 1.9 (see Materials and Methods).
Corrected for tip size effects (see Materials and Methods).
The protofibril length was measured from the topographic AFM images using a routine that we have implemented using MATLAB (The MathWorks, Natick, MA). Such routine approximates the fibril profile using a sequence of segments.
Labeling of mutated HypF-N with N-(1-pyrene)maleimide
Labeling of the C7S/C40S variant of HypF-N, carrying a single cysteine residue at position 65, was carried out overnight in the dark, under constant mechanical shaking, in 3 M guanidinium hydrochloride, 100 mM potassium phosphate, pH 7.1, 4°C. A 10-fold molar excess of N-(1-pyrene)maleimide from Invitrogen (Carlsbad, CA) dissolved in dimethyl sulfoxide was added to the protein sample in a final volume of 1 mL. The reaction was quenched by addition of 10 μL of TFA. The unbound dye was removed by dialysis using a dialysis membrane with a 3000 Da cut-off. The sample was then centrifuged for 5 min at 16,100 × g. The degree of labeling was determined by measuring the ratio between the concentration of bound probe (ɛ344 = 40,000 M−1 cm−1) and the concentration of protein determined at 280 nm, with the contribution of the probe at this wavelength duly subtracted (23). This was found to be 0.9.
Quenching of N-(1-pyrene)maleimide fluorescence
Samples of 48 μM HypF-N labeled with N-(1-pyrene)maleimide were incubated for 4 h in 20 mM TFA, 330 mM NaCl, pH 1.7, 25°C. The fluorescence was quenched by the progressive addition of small aliquots of a 7 M acrylamide solution in 20 mM TFA and 330 mM NaCl. Fluorescence spectra between 360 and 550 nm (344 nm excitation) were then acquired at 25°C at different acrylamide concentrations in the range 0.0–0.6 M. The final sample dilution was <10%. A Perkin-Elmer LS 55 spectrofluorimeter (Wellesley, MA) and a 4 × 10 mm path-length quartz cell were used.
Results and Discussion
Protofibril morphology indicates the coexistence of two populations
The incubation of HypF-N at pH 1.7, 350 mM ionic strength, 25°C resulted in the formation of worm-like protofibrils displaying a beaded structure, as shown by tapping mode AFM (Fig. 1, a and b). The distributions of protofibril height h, apparent width wa, contour length L and end-to-end distance R are reported in Fig. 1, a–d. The behavior of the height distribution reflects the beaded structure of the protofibrils with the larger values corresponding to the AFM probe located on top of the beads and the smaller ones corresponding to the probe located between adjacent beads (19,20). For sake of simplicity, the mean height value will be used in the following.
Figure 1.
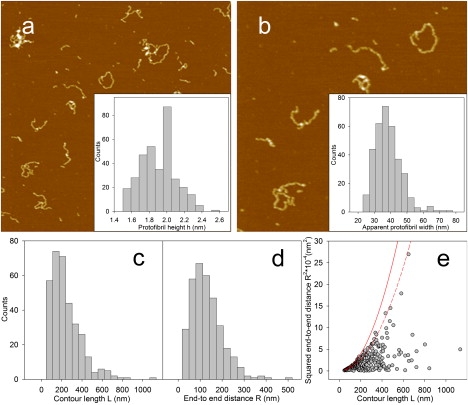
(a) Tapping mode AFM image (height data) of HypF-N protofibrils obtained at pH 1.7, 350 mM total ionic strength, 25°C after 23 days of incubation. Protein concentration was 48 μM. (b) A portion of the same image at higher magnification. Scan sizes, (a) 3.0 μm, (b) 1.7 μm. Z-range, 15 nm. Insets: distributions of protofibril heights h (for details see the text) (inset a) and protofibril apparent widths wa (inset b). (c and d) Distributions of protofibril (c) contour length L and (d) end-to-end distance R. All distributions were obtained from AFM images. (e) Plot of squared end-to-end distance (R2) versus contour length L. The solid and dashed lines are the curves obtained from Eq. 1 and Eq. 2, respectively, in the limit L ≪ P.
To evaluate the protofibril persistence length P, which is the length through which the memory of the protofibril initial orientation remains present, R2 was plotted as a function of L (Fig. 1 e). In principle, two models could be fitted to the experimental data to obtain the persistence length. The first one is based on the assumption that the protofibrils reach a conformational equilibrium in two dimensions subsequent to their deposition on the mica substrate. In such a case, their mean-square end-to-end distance attained on the two dimensions, , can be expressed as a function of the contour length and persistence length as follows (24):
| (1) |
In the second model, protofibrils are assumed to be trapped on the 2D mica without equilibrating on the surface. In this case their conformation is expected to resemble the projection on the surface of their previous 3D structure in solution. However, the protofibril conformation on the surface will generally not correspond exactly to a mathematical projection, which, depending on the spatial orientation of the object, generally does not maintain its length. By contrast, in this case, the protofibril contour length does not change during adsorption. In this case the mean-square end-to-end distance of the protofibril depends on its contour length according to the equation (24):
| (2) |
For both models, in the limit L ≪ P a limiting curve is obtained, corresponding to (Fig. 1 e, solid line) and (Fig. 1 e, dashed line), for the first and second model, respectively. These curves represent an upper limit for the experimental values and correspond to the case of straight protofibrils, where the contour length and the end-to-end distance in solution coincide. By contrast, for a curved protofibril, the end-to-end distance is obviously smaller than the contour length and therefore the experimental data should be located below the limiting curves. The data for protofibrils of contour length ≤400 nm do not fall below the limiting curve of the 3D model, thus indicating that this model does not properly fit these values; our experimental data are located either on the limiting curve of the 2D model or below it (Fig. 1 e). Therefore, the 2D model seems to be more suitable to describe HypF-N protofibrils, suggesting that they equilibrate on deposition on the mica surface and ruling out the presence of strong interactions with the substrate. Although based on different experimental findings, similar conclusions were reached by Hatters et al. (25), who used the 2D model to analyze the persistence length of apolipoprotein C-II fibrils.
A first procedure of best fitting of Eq. 1 to the experimental data provides a persistence length of 26 nm. However, the data are not distributed uniformly below the limiting curve especially at large contour lengths; this fact suggests that different protofibril populations might be present. To check this hypothesis, we introduced what we believe to be a new parameter η, defined as the difference between the contour length and the end-to-end distance, normalized to the contour length: η = (L − R)/L. When R is close to L, η approaches zero; η = 0 is typical of completely straight protofibrils. On the other hand, for curved protofibrils, R < L and η is between 0 and 1; the limiting case η = 1 corresponds to a closed loop. Therefore we expect η values approaching zero for rigid protofibrils and approaching 1 for flexible fibrils. Fig. 2 a reports the η distribution. Frequencies are multiplied by the corresponding L values; thus the height of the histogram at a given value of η is proportional to the protein mass contained in protofibrils presenting that value of η. The bimodality of this distribution suggests the existence of two protofibril populations of different rigidity.
Figure 2.
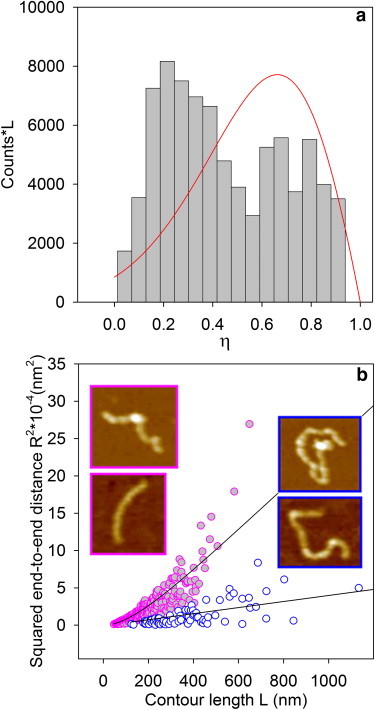
(a) Distribution of η-values for protofibrils obtained under the same conditions of Fig. 1. Frequencies are multiplied by the corresponding contour lengths; such values roughly represent the protofibril mass distribution (see text). The solid line is the theoretical curve predicted by the worm-like chain model assuming a single persistence length; it shows clearly that a single population cannot explain the experimental behavior. (b) Squared end-to-end distance (R2) versus contour length L of protofibrils corresponding to population 1 (η < η∗, solid symbols) and population 2 (η > η∗, open symbols). η∗ corresponds to the minimum value between the two peaks of the distribution in a. The solid lines are obtained by fitting Eq. 1 to the two experimental data sets. Insets, representative morphologies of (left frames) population 1 and (right frames) population 2.
To further prove that the observed bimodality cannot be explained by considering a single population with only one persistence length, we compared the experimental data with the theoretical distribution provided by the worm-like chain model with a given persistence length (26). The theoretical distribution of η is related to the probability distribution of R. We define G(R;L) as the conditional probability distribution of the values of R for a given L. The persistence length is a parameter of this function. In our calculation we used the analytical expression of the conditional distribution functions of the end-to-end vector R introduced recently by Mehraeen et al. (26) to obtain the radial distribution function G(R;L) that provides the probability of occurrence of an end-to-end distance R irrespective of the direction:
| (3) |
In Eq. 3 we used a persistence length of 26 nm, which is the value obtained fitting Eq. 1 to the whole data set (Table 1). From G(R;L) we derived the joint probability distribution W(R,L) = G(R;L)Z(L), where Z(L) is the experimental distribution of L values given in Fig. 1 c. In particular, Z(L) was obtained from an analytical asymmetric bell-shaped function fitted to the experimental data reported in Fig. 1 c. Changing the variable we get the function W(η,L) that must be integrated on L to obtain W(η). The latter is then multiplied by a function giving the average L for each η interval. is deduced from the experimental data. Finally, the resulting curve is compared with the experimental distribution in Fig. 2 a. The curve in Fig. 2 a shows a single maximum that shifts to the left or to the right as the persistence length increases or decreases; in any case, the overall shape of the curve is not altered. This result clearly shows that a single population cannot explain the observed behavior and that the peaks in the experimental data in Fig. 2 a must correspond to two populations of protofibrils, confirming the analysis carried out with the η parameter.
To discriminate the two populations we considered the value of η corresponding to the minimum between the two peaks of the distribution, η∗ = 0.58, and we separated the data with η < η∗ from those with η > η∗. These two different data sets are shown in the plot of R2 versus L (Fig. 2 b), with solid and open symbols indicating data for η < η∗ and η > η∗, respectively. Images of representative protofibrils for the first (η < η∗) and second (η > η∗) data sets are shown in the left and right insets of Fig. 2 b, respectively. From this analysis it emerges that two different populations of protofibrils with different features are present within the same sample. The mean protofibril contour length of population 1 is lower than that of population 2 by more than a factor of 2; the mean end-to-end distance of population 1 is significantly larger than that of population 2, although they are on the same order of magnitude; the persistence length obtained from Eq. 1 is very different in the two populations, with values differing by almost an order of magnitude (Table 1).
Such different features are not related to the presence of defects or kinks in the protofibrils. After an inspection of the AFM images, we have found that the number of kinks per unit length is comparable and very low for both populations (1.3 × 10⁻³ nm−1 and 1.8 × 10⁻³ nm−1 for populations 1 and 2, respectively). Such a low density of kinks, which may even be overestimated due to the difficulty in singling out a kink with certainty, corresponds to a separation between adjacent kinks much larger than the persistence length, thus suggesting that they do not alter the protofibril properties.
Mechanical properties of HypF-N protofibrils
We used the persistence length values to obtain information about the protofibril mechanical properties. In particular, the bending modulus CB, which is indicative of fibril flexibility, is related to the persistence length by the equation CB = kB T P (24). This equation yielded values of CB of (2.9 ± 0.1) × 10−28 and (4.2 ± 0.4) × 10−29 N m2 for populations 1 and 2, respectively (Table 1). The value obtained for population 1 is on the same order of magnitude as that measured for αB-crystallin and α-lactalbumin protofibrils (13). Interestingly, the bending modulus obtained for population 2 is an order of magnitude lower. Overall, these findings indicate that HypF-N protofibrils are indeed very flexible structures. On the other hand, mature fibrils are much stiffer. In fact, most of them, such as Aβ 1–42, lysozyme, β-lactoglobulin, and insulin fibrils, have bending moduli in the range 10−26–10−25 N m2, whereas transthyretin fibrils are even stiffer, with a bending modulus of 1.3 × 10⁻²⁴ N m2 (13,27).
A further insight into the protofibril mechanical properties can be obtained by evaluating the Young's modulus, or elasticity modulus, Y, which represents the mechanical resistance to elongation or compression, and is usually defined as the ratio of stress to strain. This parameter is given by Y = kB T P/I (24), where I is the second moment of area, which can be related, as a first approximation, to the protofibril radius r by the equation I = πr4/4. Our calculations have been carried out assuming that protofibrils are homogeneous; information about the protofibril ultrastructure would allow the development of a more detailed model. We estimated r from the protofibril half height obtained from the AFM images. This approach yielded Y values of 500 and 60 MPa for populations 1 and 2, respectively (Table 1). Such different values mainly reflect the difference in persistence length between the two populations. The Young's modulus obtained for population 1 is similar to that measured for αB-crystallin (13), whereas the value obtained for population 2 is one order of magnitude lower. By contrast, the Young's modulus of mature amyloid fibrils is higher, ranging from 2 to 14 GPa (13,27). Values of Young's modulus, bending modulus and persistence length for several biological and polymeric samples are reported in Table 2.
Table 2.
Persistence length P, bending modulus CB, and Young's modulus Y of different systems
| P (nm) | CB (N m2) | Y (Pa) | Reference | |
|---|---|---|---|---|
| HypF-N protofibrils (population 1) | 69 ± 3 | (2.9 ± 0.1) × 10−28 | 5 × 10⁸ | Present work |
| HypF-N protofibrils (population 2) | 10 ± 1 | (4.2 ± 0.4) × 10−29 | 6 × 10⁷ | Present work |
| α-Lactalbumin protofibrils | — | 1.4 × 10⁻²⁸ | 1.4 × 10⁸ | (13) |
| Insulin amyloid fibrils | 42 ± 30 | (1.7 ± 1.2) × 10−25 | (6.3 ± 4.5) × 109 | (27) |
| Sickle cell hemoglobin fibers | 2.4 × 10⁵ | 1.0 × 10⁻²⁴ | 1.0 × 10⁸ | (34) |
| DNA | 52 ± 2 (a) | — | 2.9 × 10⁸ (b) | (a) (35) |
| (b) (36) | ||||
| Collagen, single fibril | — | — | 1 − 5 × 10⁹ | (37) |
| Microtubules | 1 − 8 ×10⁶ (a) | — | 1 × 10⁸ (b) | (a) (38) |
| (b) (39) | ||||
| Vimentin intermediate filaments | 0.3 − 1 ×10³ (a) | — | 9 × 10⁸ (b) | (a) (38) |
| (b) (40) | ||||
| Yeast cells | — | — | 1 × 10⁶ | (41) |
| Bone | — | — | 1 × 10¹⁰ | (42) |
| Rubber | — | — | 1 × 10⁶ (a) | (a) (42) |
| 1 × 10⁷ (b) | (b) (13) |
Values of persistence length, bending rigidity, and Young's modulus obtained in this work for HypF-N protofibrils are compared with the values reported in the literature for several biological assemblies and bulk materials. Values labeled with (a) or (b) refer to the reference number labeled with (a) or (b) in the same row.
Fluorescence quenching of pyrene-labeled HypF-N oligomers
Fluorescence quenching experiments on oligomeric aggregates of HypF-N labeled with the fluorophore N-(1-pyrene)maleimide were carried out to obtain information on the presence of multiple conformers in the early stages (4 h) of protein aggregation. Fig. 3 a shows a tapping mode AFM image of these aggregates, whereas the inset shows the aggregates formed in the same conditions by wild-type HypF-N. In both cases aggregates appear as beads of variable size, indicating that mutation and labeling do not alter the oligomeric structure typical of early HypF-N aggregates. This result is in agreement with those obtained previously on wild-type and unlabeled HypF-N as well as on other HypF-N mutants labeled with pyrene at different positions (20,21). Fig. 3 b shows the Stern-Volmer plot obtained quenching pyrene fluorescence with acrylamide. The ratio between the fluorescence intensity in the absence (F0) and in the presence of quencher (F) is reported as a function of quencher concentration. At quencher concentrations higher than 0.2 M, a downward curvature in the plot is observed. Downward curvatures in the Stern-Volmer plot indicate the presence of multiple populations of aggregates that display different responses to the added quencher due to a different solvent exposure of the pyrene probe (28,29).
Figure 3.
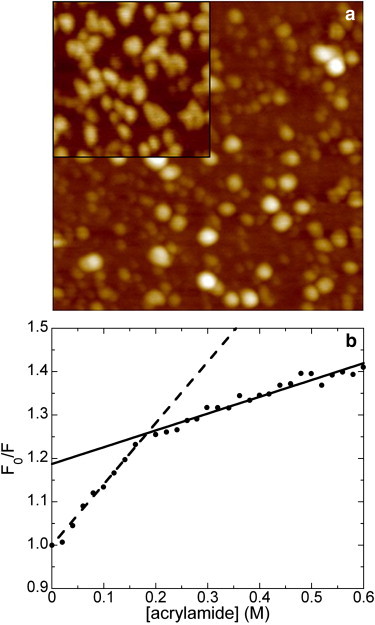
(a) Tapping mode AFM image (height data) of oligomeric aggregates formed after 4 h of incubation by HypF-N labeled with pyrene at position 65 of the amino acid chain. Aggregation conditions were those reported in Fig. 1. Scan size 500 nm; Z-range 8 nm. The inset shows a 250 nm ×250 nm portion of an image of oligomeric aggregates of wild-type, unlabeled HypF-N at the same magnification. (b) Stern-Volmer plot obtained from the aggregates imaged in a. F and F0 are measured at the emission wavelength of 375 nm. The dashed and solid lines represent linear best fits yielding different Stern-Volmer constants.
In this case the difference in the degree of exposure is so large that the different populations give rise to two distinct linear portions in the plot, rather than to the usual smooth curvature of the plot observed at high quencher concentration (28–30). Linear fitting of the two regions yielded Stern-Volmer constants (31) of 1.41 ± 0.03 M−1 and 0.39 ± 0.02 M−1 for the low and high concentration regions, respectively. The population quenched at low quencher concentration does not correspond to unfolded monomers possibly present in solution, as a control quenching experiment carried out at pH 1.7 without any added salt (conditions in which aggregation does not occur and HypF-N remains in a partially unfolded monomeric state (19)) resulted in a higher Stern-Volmer constant at low quencher concentration (data not shown).
These results add further evidence to the polymorphism observed after the AFM analysis, and indicate that even in the very early stages of aggregation at least two populations of oligomeric aggregates are present in the sample, having different solvent accessibility of the labeled position. These findings suggest that the different types of protofibrils observed at longer times result from different molecular arrangements of the polypeptide chains. The presence of different peptide configurations has also been proposed for mature amyloid fibrils, based on the analysis of torsional correlations along the fibrils (32) and solid state NMR measurements (33).
Conclusions
In this study, we have provided what we believe to be evidence indicating that structural degeneracy, already found in mature fibrils (32,33), is also present in prefibrillar aggregates. It has been recently shown that structural degeneracy of prefibrillar aggregates can be obtained by incubating HypF-N under different conditions, such as at low pH with high ionic strength (the same conditions used here) and at nearly neutral pH in the presence of trifluoroethanol (21). We have shown that structural degeneracy can be obtained for prefibrillar aggregates even under the same incubation conditions (low pH with high ionic strength) and within the same sample, resulting in different protofibril mechanical properties. From a mechanical point of view, longer protofibrils are more compliant with respect to bending and elastic elongation and, more generally, both populations exhibit a higher flexibility and plasticity with respect to mature fibrils. A higher plasticity and a lower resistance against elastic elongation and bending may increase considerably the reactivity and adaptability of these species to interact with undesired molecular targets, suggesting why protofibrils may be more detrimental than fibrils. More importantly, differences in mechanical properties exist even within the same sample of protofibrils, indicating that different subpopulations of apparently the same prefibrillar aggregates may have different physical properties and involvement in diseases.
Acknowledgments
We thank O. Cavalleri and T. Svaldo-Lanero for helpful discussions and D. Nichino for help in the AFM measurements.
This work was partially supported by grants from the Italian Ministero dellaUniversità e della Ricerca (PRIN 2007XY59ZJ_004, FIRB RBNE03PX83), Fondazione Cariplo, and University of Genoa (Fondi di Ateneo).
Footnotes
Silvia Campioni's present address is Department of Chemistry and Applied Biosciences, Laboratory of Physical Chemistry, ETH Zurich, Wolfgang Pauli Str. 10, 8093 Zurich, Switzerland.
References
- 1.Selkoe D.J. Folding proteins in fatal ways. Nature. 2003;426:900–904. doi: 10.1038/nature02264. (Erratum in: Selkoe, D. J. 2004. Nature 428:445) [DOI] [PubMed] [Google Scholar]
- 2.Merlini G., Bellotti V. Molecular mechanisms of amyloidosis. N. Engl. J. Med. 2003;349:583–596. doi: 10.1056/NEJMra023144. [DOI] [PubMed] [Google Scholar]
- 3.Chiti F., Dobson C.M. Protein misfolding, functional amyloid and human disease. Annu. Rev. Biochem. 2006;75:333–366. doi: 10.1146/annurev.biochem.75.101304.123901. [DOI] [PubMed] [Google Scholar]
- 4.Nilsson M.R. Techniques to study amyloid fibril formation in vitro. Methods. 2004;34:151–160. doi: 10.1016/j.ymeth.2004.03.012. [DOI] [PubMed] [Google Scholar]
- 5.Serpell L.C., Sunde M., Fraser P.E. The protofilament substructure of amyloid fibrils. J. Mol. Biol. 2000;300:1033–1039. doi: 10.1006/jmbi.2000.3908. [DOI] [PubMed] [Google Scholar]
- 6.Relini A., Cavalleri O., Gliozzi A. What can atomic force microscopy say about amyloid aggregates? In: Bushan B., Fuchs H., Tomitori M., editors. Applied Scanning Probe Methods IX—Characterization. Springer; Heidelberg: 2008. pp. 177–206. [Google Scholar]
- 7.Sunde M., Blake C. The structure of amyloid fibrils by electron microscopy and X-ray diffraction. Adv. Protein Chem. 1997;50:123–159. doi: 10.1016/s0065-3233(08)60320-4. [DOI] [PubMed] [Google Scholar]
- 8.Tycko R. Insights into the amyloid folding problem from solid-state NMR. Biochemistry. 2003;42:3151–3159. doi: 10.1021/bi027378p. [DOI] [PubMed] [Google Scholar]
- 9.Kheterpal I., Lashuel H.A., Wetzel R. Aβ protofibrils possess a stable core structure resistant to hydrogen exchange. Biochemistry. 2003;42:14092–14098. doi: 10.1021/bi0357816. [DOI] [PubMed] [Google Scholar]
- 10.Williams A.D., Sega M., Wetzel R. Structural properties of Aβ protofibrils stabilized by a small molecule. Proc. Natl. Acad. Sci. USA. 2005;102:7115–7120. doi: 10.1073/pnas.0408582102. [DOI] [PMC free article] [PubMed] [Google Scholar]
- 11.Kheterpal I., Chen M., Wetzel R. Structural differences in Aβ amyloid protofibrils and fibrils mapped by hydrogen exchange—mass spectrometry with on-line proteolytic fragmentation. J. Mol. Biol. 2006;361:785–795. doi: 10.1016/j.jmb.2006.06.066. [DOI] [PubMed] [Google Scholar]
- 12.Chimon S., Shaibat M.A., Ishii Y. Evidence of fibril-like beta-sheet structures in a neurotoxic amyloid intermediate of Alzheimer's beta-amyloid. Nat. Struct. Mol. Biol. 2007;14:1157–1164. doi: 10.1038/nsmb1345. [DOI] [PubMed] [Google Scholar]
- 13.Knowles T.P., Fitzpatrick A.W., Welland M.E. Role of intermolecular forces in defining material properties of protein nanofibrils. Science. 2007;318:1900–1903. doi: 10.1126/science.1150057. [DOI] [PubMed] [Google Scholar]
- 14.Harper D.J., Wong S.S., Lansbury P.T., Jr. Observation of metastable amyloid protofibrils by atomic force microscopy. Chem. Biol. 1997;4:119–125. doi: 10.1016/s1074-5521(97)90255-6. [DOI] [PubMed] [Google Scholar]
- 15.Walsh D.M., Lomakin A., Teplow D.B. Amyloid beta-protein fibrillogenesis—detection of protofibrillar intermediate. J. Biol. Chem. 1997;272:22364–22372. doi: 10.1074/jbc.272.35.22364. [DOI] [PubMed] [Google Scholar]
- 16.Conway K.A., Harper D.J., Lansbury P.T., Jr. Fibrils formed in vitro from α-synuclein and two mutant forms linked to Parkinson's disease are typical amyloid. Biochemistry. 2000;39:2552–2563. doi: 10.1021/bi991447r. [DOI] [PubMed] [Google Scholar]
- 17.Gosal W.S., Morten I.J., Radford S.E. Competing pathways determine fibril morphology in the self-assembly of β2-microglobulin into amyloid. J. Mol. Biol. 2005;351:850–864. doi: 10.1016/j.jmb.2005.06.040. [DOI] [PubMed] [Google Scholar]
- 18.Relini A., Canale C., Stefani M. Monitoring the process of HypF fibrillization and liposome permeabilization by protofibrils. J. Mol. Biol. 2004;338:943–957. doi: 10.1016/j.jmb.2004.03.054. [DOI] [PubMed] [Google Scholar]
- 19.Campioni S., Mossuto M.F., Chiti F. Conformational properties of the aggregation precursor state of HypF-N. J. Mol. Biol. 2008;379:554–567. doi: 10.1016/j.jmb.2008.04.002. [DOI] [PubMed] [Google Scholar]
- 20.Calloni G., Lendel C., Chiti F. Structure and dynamics of a partially folded protein are decoupled from its mechanism of aggregation. J. Am. Chem. Soc. 2008;130:13040–13050. doi: 10.1021/ja8029224. [DOI] [PubMed] [Google Scholar]
- 21.Campioni S., Mannini B., Chiti F. A causative link between the structure of aberrant protein oligomers and their toxicity. Nat. Chem. Biol. 2010;6:140–147. doi: 10.1038/nchembio.283. [DOI] [PubMed] [Google Scholar]
- 22.Griffith J.E., Grigg D.A. Dimensional metrology with scanning probe microscopes. J. Appl. Phys. 1993;74:R83–R109. [Google Scholar]
- 23.Haugland R.P. 10th ed. Molecular Probes; Eugene, OR: 2005. The Handbook: A Guide to Fluorescent Probes and Labeling Technologies. [Google Scholar]
- 24.Rivetti C., Guthold M., Bustamante C. Scanning force microscopy of DNA deposited onto mica: equilibration versus kinetic trapping studied by statistical polymer chain analysis. J. Mol. Biol. 1996;264:919–932. doi: 10.1006/jmbi.1996.0687. [DOI] [PubMed] [Google Scholar]
- 25.Hatters D.M., Mac Raild C.A., Howlett G.J. The circularization of amyloid fibrils formed by apoliprotein C–II. Biophys. J. 2003;85:3979–3990. doi: 10.1016/S0006-3495(03)74812-7. [DOI] [PMC free article] [PubMed] [Google Scholar]
- 26.Mehraeen S., Sudhanshu B., Spakowitz A.J. End-to-end distribution for a wormlike chain in arbitrary dimensions. Phys. Rev. E Stat. Nonlin. Soft Matter Phys. 2008;77:061803. doi: 10.1103/PhysRevE.77.061803. [DOI] [PubMed] [Google Scholar]
- 27.Smith J.F., Knowles T.P., Welland M.E. Characterization of the nanoscale properties of individual amyloid fibrils. Proc. Natl. Acad. Sci. USA. 2006;103:15806–15811. doi: 10.1073/pnas.0604035103. [DOI] [PMC free article] [PubMed] [Google Scholar]
- 28.Eftink M.R., Ghiron C.A. Exposure of tryptophanyl residues in proteins. Quantitative determinations by fluorescence quenching studies. Biochemistry. 1976;15:672–680. doi: 10.1021/bi00648a035. [DOI] [PubMed] [Google Scholar]
- 29.Lakowicz J. 2nd ed. Kluwer Academic/Plenum; New York: 1999. Principles of Fluorescence Spectroscopy. 237–265. [Google Scholar]
- 30.Wasylewski Z., Poloczek H., Wasniowska A. Fluorescence-quenching resolved spectroscopy of proteins. Eur. J. Biochem. 1988;172:719–724. doi: 10.1111/j.1432-1033.1988.tb13948.x. [DOI] [PubMed] [Google Scholar]
- 31.Birks J.B. Wiley-InterScience; New York: 1970. Photophysics of Aromatic Molecules. 433–447. [Google Scholar]
- 32.Knowles T.P.J., Smith J.F., Welland M.E. Spatial persistence of angular correlations in amyloid fibrils. Phys. Rev. Lett. 2006;96:238–301. doi: 10.1103/PhysRevLett.96.238301. [DOI] [PubMed] [Google Scholar]
- 33.Petkova A.T., Leapman R.D., Tycko R. Self-propagating, molecular-level polymorphism in Alzheimer's β-amyloid fibrils. Science. 2005;307:262–265. doi: 10.1126/science.1105850. [DOI] [PubMed] [Google Scholar]
- 34.Wang J.C., Turner M.S., Briehl R.W. Micromechanics of isolated sickle cell hemoglobin fibers: bending moduli and persistence lengths. J. Mol. Biol. 2002;315:601–612. doi: 10.1006/jmbi.2001.5130. [DOI] [PubMed] [Google Scholar]
- 35.Strick T.R., Dessinges M.-N., Croquette V. Stretching of macromolecules and proteins. Rep. Prog. Phys. 2003;66:1–45. [Google Scholar]
- 36.Noy A., Vezenov D.V., Lieber C.M. Stretching and breaking duplex DNA by chemical force microscopy. Chem. Biol. 1997;4:519–527. doi: 10.1016/s1074-5521(97)90324-0. [DOI] [PubMed] [Google Scholar]
- 37.Yang L., van der Werf K.O., Feijen J. Micromechanical bending of single collagen fibrils using atomic force microscopy. J. Biomed. Mater. Res. A. 2007;82A:160–168. doi: 10.1002/jbm.a.31127. [DOI] [PubMed] [Google Scholar]
- 38.Mücke N., Kreplak L., Langowski J. Assessing the flexibility of intermediate filaments by atomic force microscopy. J. Mol. Biol. 2004;335:1241–1250. doi: 10.1016/j.jmb.2003.11.038. [DOI] [PubMed] [Google Scholar]
- 39.Kis A., Kasas S., Forró L. Nanomechanics of microtubules. Phys. Rev. Lett. 2002;89:248101. doi: 10.1103/PhysRevLett.89.248101. [DOI] [PubMed] [Google Scholar]
- 40.Guzmán C., Jeney S., Forró L. Exploring the mechanical properties of single vimentin filaments by atomic force microscopy. J. Mol. Biol. 2006;360:623–630. doi: 10.1016/j.jmb.2006.05.030. [DOI] [PubMed] [Google Scholar]
- 41.Lanero T.S., Cavalleri O., Gliozzi A. Mechanical properties of single living cells encapsulated in polyelectrolyte matrixes. J. Biotechnol. 2006;124:723–731. doi: 10.1016/j.jbiotec.2006.02.016. [DOI] [PubMed] [Google Scholar]
- 42.Radmacher M. Measuring the elastic properties of biological samples with the AFM. IEEE Eng. Med. Biol. Mag. 1997;16:47–57. doi: 10.1109/51.582176. [DOI] [PubMed] [Google Scholar]