

Abstract
The kinetics of aggregation of α-synuclein are usually studied by turbidity or Thio-T fluorescence. Here we follow the disappearance of monomers and the formation of early oligomers using fluorescence correlation spectroscopy. Alexa488-labeled A140C-synuclein was used as a fluorescent probe in trace amounts in the presence of excess unlabeled α-synuclein. Repeated short measurements produce a distribution of diffusion coefficients. Initially, a sharp peak is obtained corresponding to monomers, followed by a distinct transient population and the gradual formation of broader-sized distributions of higher oligomers. The kinetics of aggregation can be followed by the decreasing number of fast-diffusing species. Both the disappearance of fast-diffusing species and the appearance of turbidity can be fitted to the Finke-Watzky equation, but the apparent rate constants obtained are different. This reflects the fact that the disappearance of fast species occurs largely during the lag phase of turbidity development, due to the limited sensitivity of turbidity to the early aggregation process. The nucleation of the early oligomers is concentration-dependent and accompanied by a conformational change that precedes β-structure formation, and can be visualized using fluorescence resonance energy transfer between the donor-labeled N-terminus and the acceptor-labeled cysteine in the mutant A140C.
Introduction
Parkinson's disease is one of the most common neurodegenerative disorders. Though the cause of the disease is still unknown, substantial evidence suggests that aggregation of α-synuclein plays a critical role in the etiology of the disease (1). Fibrillar aggregates of α-synuclein are found in Lewy bodies in the brain of Parkinson patients (2,3). These Lewy bodies are spherical protein inclusions found in the cytoplasm of surviving nigral neurons. However, growing evidence suggests that early intermediary oligomers, rather than mature fibrils of α-synuclein, are the pathogenic species (1,4,5).
Alpha-synuclein is a small (14.460 Da), abundant presynaptic protein that displays remarkable structural versatility. It is an intrinsically disordered or naturally unfolded protein at physiological conditions, but it can readily adopt an α-helical structure when bound to membranes (6,7) or a β-sheet structure in fibrillar aggregates (8,9). The early oligomeric intermediates before formation of the fibrillar structure are also assumed to be very toxic to the cell (10,11) and are able to induce leakage in vesicles. Due to their heterogeneity and their transient nature, the identification and characterization of early oligomers in terms of size and conformation is very difficult.
Fluorescence correlation spectroscopy is a technique that allows us to determine the size of molecules by analyzing their diffusion. The diffusion of a relatively low number of fluorescent molecules through the focal volume of a confocal microscope causes intensity fluctuations in the detector. Autocorrelation analysis and the construction of an autocorrelation curve represents one way of statistically processing the fluctuating fluorescence trace, and from the autocorrelation curve the average diffusion time of the molecules can be obtained. When the autocorrelation curve can be fitted to one diffusing component, the average diffusion time of the molecules allows the calculation of the diffusion coefficient, which corresponds nicely with the diffusion coefficients obtained from other techniques such as dynamic light scattering (12). Fluorescence correlation spectroscopy (FCS) has been applied for the quantitative analysis of oligomer formation of tubulin (12), the study of the aggregate formation of β-amyloid peptide (13), and of α-synuclein (14,15).
To apply the technique of FCS to an aggregating system, trace amounts of fluorescently labeled molecules can be used, in the presence of a large excess of unlabeled molecules. It is then expected that during the course of aggregation, the number concentration of fluorescent species will remain constant (due to the large excess of unlabeled molecules), and the diffusion time will gradually increase. This application of the FCS technique has the inherent problem that the sampling time should be increased with the polymerization time to allow us to observe sufficient fluctuations from the slower moving big aggregates. Here we show that by using short sampling times, the heterogeneity of the early oligomers can be revealed, while bigger aggregates do not contribute to the fluctuations. This method is analogous to bootstrapping in statistics.
In this study, the kinetics of the aggregation process are quantitatively analyzed by following the decrease of the number concentration of fast diffusing species. The same information can also be obtained directly from the fluctuating signal, i.e., from the average count rate of the fluctuating signal measured in-between the big spikes observed when big aggregates pass through the confocal volume (16,17). The kinetics of the disappearance of oligomers can be described using the kinetic equation of the Finke-Watzky two-step, two-state model for an initiation by monomolecular isomerization followed by an autocatalytic conformational switching coupled to aggregation (18–20), but the phenomenon occurs almost completely during the lag phase of the turbidity appearance, demonstrating the insensitivity of turbidity for these early events. This is in agreement with other spectroscopic observations (21). Independent evidence for a conformational change during oligomer formation is also presented here, based on intramolecular fluorescence resonance energy transfer (FRET) signals.
Materials and Methods
Construction α-synuclein expression plasmid and its point mutant A140C
The wild-type α-synuclein (140aa) and A140C mutant of α-synuclein was expressed and purified as described before (22). The aggregation rate of A140C mutant of α-synuclein was measured by turbidity and Thio-T signal and is comparable to WT-SYN (23). Aggregation is induced by increasing the temperature to 37°C or 45°C as indicated, and applying magnetic stirring at 500 rpm.
Labeling of purified protein
The Cysteine residue at C-terminal of A140C-synuclein (200 μM) was labeled with a 20-fold molar excess of Alexa488 C5 maleimide in 20 mM HEPES buffer of pH 8.8. The protein was incubated for 2 h at 20°C with magnetic stirring. Labeled protein was separated from free dye by gel chromatography using a double PD-10 column. C-terminal Alexa-labeled synuclein (C-Alexa-SYN) was used for FCS measurements.
FRET measurements were done with double-labeled synucleins (DAL-SYN). First, the C-terminal Cysteine of A140C-synuclein was labeled similarly as described above using tetra-methyl rhodamine (TMRh) as acceptor. Then the pH was adjusted to pH 6.5–6.8 by adding HCl (0.06 N) for specific N-terminal (α-amine) labeling with twofold molar excess of Alexa-fluor 488 carboxylic acid succinimidyl ester as donor. After incubation at 20°C for 2 h with magnetic stirring, free dyes were removed using a PD-10 column. Alpha-synuclein was also labeled separately with donor Alexa-488 at N-terminal (DL-SYN) and acceptor TMRh at C-terminal (AL-SYN) similarly by above described methods. The concentration of donor/acceptor labeled-synuclein was calculated by correcting for the contribution of the dyes to the absorbance at A277,
The following molar extinction coefficients were used: α-synuclein ɛ277(synuclein) = 5800 M−1 cm−1; Alexa-488 ɛ277 (Donor) = 638 M−1 cm−1; TMRh ɛ277(Acceptor) = 1740 M−1 cm−1; TMRh ɛ493(Acceptor) = 11,900 M−1 cm−1; Alexa-488 ɛ493(Donor) = 72,000 M−1 cm−1; and TMRh ɛ553(Acceptor) = 85,000 M−1 cm−1 (24,25).
The stoichiometry of the Alexa-488 and TMRh in double-labeled protein (DAL-synuclein) were 30 ± 2% and 65 ± 3%, respectively. Although α-synuclein contains 15 Lys residues, at neutral pH the labeling of the α-amino group, with an average pKa ∼7.6, is more efficient than the ɛ-amino groups with pKa ∼10.5 (26,27). Therefore, by lowering the labeling pH to pH 6.5–6.8 and with a labeling stoichiometry <1, we expect mainly N-terminal labeling but cannot exclude the presence of a small fraction of protein with labeled lysine residue. As we use the FRET signal only pragmatically and not to calculate distances, this is not a problem.
Alexa-488 and TMRh is a well-known FRET pair, and significantly photostable and insensitive to pH 4–10 (Molecular Probes, Invitrogen, Carlsbad, CA) (28). We have also tested it at pH 11, where it shows no change in fluorescence intensity and lifetime.
The kinetics of fibril formation of α-synuclein with labeled proteins were compared using Thio-T fluorescence (Fig. S1) at pH 7.4 and 37°C, with continuous shaking (270 rpm) in a Spectra Fluor Plus or Safire2 (TECAN, Mechelen, Belgium). The half-life of aggregation is almost the same in labeled and unlabeled α-synuclein. The kinetics of double-labeled synuclein (DAL-synuclein) is significantly faster (half-life 23 ± 4 h) compared to unlabeled (half-life 40 ± 3 h), but similar to the kinetics of singly labeled α-synuclein that has undergone the same treatment (multiple pH changes) except for the labeling itself.
Fluorescence correlation spectroscopy (FCS)
Fluorescence correlation spectroscopy (FCS) measurements were performed on the laser-scanning microscope (i.e., LSM) LSM 510/ConfoCor II combination (Carl Zeiss, Jena, Germany). Experiments were done at a concentration of 3–4 nM labeled protein (C-Alexa-SYN) mixed with different concentration of unlabeled protein, to ensure that number of fluorescent molecules in the confocal volume (0.312 fL) is limited to 1–4. The FCS measurements reveal the presence of a small fraction (<20%) of free dye, probably due to the presence of nonspecifically bound dye molecules that are not fully removed by the gel chromatography at 100 μM, but are released upon dilution to nanomolar concentrations. For experiments, 100 measurements of 10 s duration were performed, and each curve was fitted using the two-component model (Fig. S2),
where GT is the part of the autocorrelation curve at a fast timescale, representing the photodynamics; GD is the concentration-dependent part representing diffusion; τ is correlation time; TR and τx are the amplitude and the relaxation time of the photodynamic process; N is the average number of particles in the confocal volume; τ1 (F1) and τ2(1-F1) are, respectively, the diffusion time (fraction) of free Alexa dye and dye bound to α-synuclein; and ωx and ωz are the radial and axial radii of the confocal volume, which are determined by a calibration with Alexa-488 of known diffusion coefficient 300 μm2 s−1 (29) and are fixed throughout the fitting.
Images of fluorescent aggregates using laser-scanning microscopy (LSM)
Confocal images of the bottom of the glass slide and of the solution (100 μm from the glass bottom) were made using an LSM 510 (Carl Zeiss) after every hour of FCS measurements. Fluorescently labeled (Alexa-488) α-synuclein was used with unlabeled protein at a dilution of 2.5 × 10⁴-fold to visualize aggregates. A picture was also obtained in the differential interference contrast microscopy.
Circular dichroism (CD)
Alpha-synuclein was centrifuged for 30 min at 13,400 rpm (18,500g, in a Galaxy 14D centrifuge; Sorvall, VWR, Belgium) to remove preexisting aggregates. Samples were incubated at 45°C under continuous stirring. Far-ultraviolet circular dichroism (CD) spectra were recorded on a model No. 810 spectrophotometer (JASCO, Oklahoma City, OK) in a 1-mm path-length cuvette at room temperature. Spectra were recorded from 195 to 260 nm with a step size of 1 nm and a scanning speed of 20 nm/min. On average, three scans were recorded. All spectra were corrected by subtracting the background spectrum of the buffer. Samples were prepared by diluting the stock solution to 0.2 mg/mL (20 mM Tris HCl, 100 mM NaCl, pH 7.4).
Turbidity measurements
Turbidity was measured at 350 nm with different concentration of unlabeled α-synuclein mixed with trace amount of labeled proteins, at 45°C in 20 mM HEPES buffer, pH 7.4 and 150 mM NaCl with constant magnetic stirring (500 rpm). The unlabeled α-synuclein was centrifuged for 30 min at 13,400 rpm/(18,500g) in a Galaxy 14D centrifuge (Sorvall) before experiments.
Steady-state and time-resolved fluorescence spectroscopy
Steady-state fluorescence measurements were done in a spectrofluorimeter (Photon Technology International, Birmingham, NJ) equipped with a water bath and thermostated cell holder for temperature control. All measurements were done by exciting the donor Alexa-488 at Exmax 495 nm, and acceptor TMRh at Exmax 557 nm with a slit-width of 2 nm.
Time-resolved fluorescence measurements were done in the microscope, using a 466-nm pulsed laser head (model No. LDH-P-C-470; PicoQuant, Berlin, Germany) coupled to a polarization-maintaining single-mode fiber. The fiber is coupled to a commercially available FCS instrument, the ConfoCor I microscope (Carl Zeiss) and the compact time-correlated single photon counting (TCSPC) electronics of the TimeHarp 200 TCSPC board (PicoQuant, Berlin-Adlershof, Germany) were used to control the data acquisition. The detailed setup has been described elsewhere (30). Measurements were done with a dichroic mirror of 470 nm, an excitation wavelength filter of 467 ± 5 nm and emission filter at 520 ± 20 nm, and a 16 MHz laser frequency with 70% efficiency (laser power 5 μW). Light scattered at 467 nm by a D-glycogen suspension in distilled water was collected to obtain the instrument response function. Fluorescence decay was measured by keeping the polarizer oriented at the magic angle (54.7° with respect to the vertical) to eliminate anisotropy decay artifacts.
Data analysis
The observed time-resolved decay data were deconvoluted with the instrument response function. The fluorescence decay is expressed as a sum of discrete exponentials as (31)
where n is the number of discrete exponentials required to fit the decay profile, i is the index, and αi and τi are the amplitudes and lifetimes, respectively. Average lifetimes were calculated by the equation
Decay parameters were obtained after iterative reconvolution using a nonlinear least-square fit (Fig. S3). The goodness of the fit is judged by the reduced χ2 and the randomness of the distribution of the weighted residuals W(t).
Results
Concentration-dependent early oligomer formation measured by FCS
Repetitive FCS measurements with a short sampling time of 10 s were used to follow the concentration-dependent early aggregation process. Alexa488-labeled A140C-synuclein (C-Alexa-SYN) was used as a fluorescent probe in trace amount (3–4 nM) with different excess concentrations of unlabeled α-synuclein. The aggregation reaction was initiated at 45°C with magnetic stirring in HEPES buffer of pH 7.4 and 150 mM NaCl with, respectively, 50 μM, 100 μM, and 200 μM of unlabeled monomer α-synuclein. Repeated FCS measurements (after cooling an aliquot to 20°C) of short sampling time and autocorrelation analysis produce a distribution of average diffusion coefficients (<D>) with a single sharp peak with diffusion coefficient of 114 ± 15 μm2/s during the initial hour, which is attributed to the monomers. Assuming a spherical structure, a hydrodynamic radius of 1.7–2.2 nm can be calculated. The initial monomeric state of the unlabeled α-synuclein was further checked using native PAGE and size exclusion chromatography. In PAGE, unlabeled α-synuclein shows almost a single band without any higher oligomers (Fig. S4). In size-exclusion chromatography (using a HiLoad 1660 Superdex 75 column; Amersham Pharmacia Biotech, Piscataway, NJ) initial material shows a single peak. After calibration of the column, a hydrodynamic radius of 2.75 ± 0.6 nm (Fig. S4) is calculated. In the literature the hydrodynamic radius varies from 2.5 to 3.7 depending on the technique used (32–35).
With increasing time of aggregation, higher oligomers with a heterogeneous distribution gradually appear. In between the sharp monomer peak and the broader distribution of higher oligomers, an intermediate sharp distribution appears with a diffusion coefficient of 78 ± 15 μm2/s (Fig. 1). Monomer disappearance and the formation of the transient intermediate and the heterogeneous higher oligomers are clearly concentration-dependent. The sharp concentration-dependent transition of the monomer and the transient intermediate are shown in Fig. 1. The diffusion coefficient of the linear oligomers (of size i) can be estimated from the empirical relation i = (D1 /Di)1.72 (formula 7 from (12)). Applying this formula for the dimer (i = 2) gives a calculated D2 = 76 μm2/s, which corresponds nicely to the experimentally observed diffusion coefficient of the transient. However, as each individual measurement produces an average diffusion coefficient, it is not possible to state with certainty that this transient is a pure dimeric species. For the longer timescales, <D> becomes widely distributed, and this distribution convincingly demonstrates the heterogeneity of the sample, but it is not possible to link this distribution to a unique collection of the species.
Figure 1.
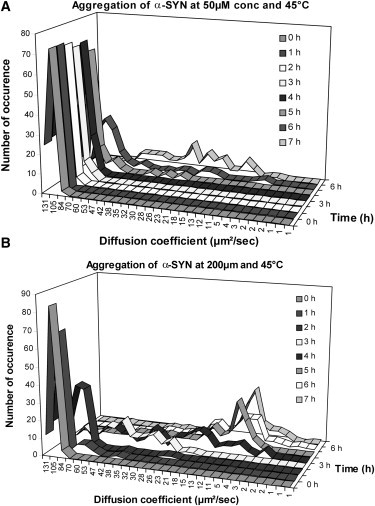
Concentration-dependent early oligomer formation of α-synuclein. Autocorrelation curves were obtained from repeated (100) measurements with short sampling time (10 s), using A140C-synuclein labeled with Alexa-488 as fluorescent probe in trace amount (3–4 nM) with excess unlabeled α-synuclein. The distribution of the average diffusion coefficient at different concentration of total protein (A) 50 μM and (B) 200 μM was plotted, as a function of aggregation time (h).
Correlation of oligomer formation with the reduction of the number of molecules in the confocal volume
Repeated FCS measurements of 10 s sampling time show autocorrelation curves at time zero that consistently can be fitted with one component (Fig. S2). With increasing time of aggregation, the repetitive measurements show a broader distribution (Fig. S5) and an increase in the amplitude. The amplitude reflects the inverse of the average number of fluorescent molecules in the focal volume. The analysis of the data shows that there is an increase of the fraction of free dye and a concomitant decrease of labeled α-synuclein fraction with aggregation time. In absolute terms, the number of free dye remains constant and can be used as a kind of internal standard. There is a significant decrease in the number of labeled α-synuclein molecules and this decrease is concentration-dependent (Fig. S6). It reflects the disappearance of labeled molecules in big aggregates that are excluded from the measurements. The number concentration of labeled α-synuclein molecules correlates nicely with the level of the fluctuating signal between the bright pulses that appear in the signal (Fig. 2). However, the reduction of the number concentration is not mainly due to the incorporation of multiple fluorescent molecules in big oligomers. FCS measurements were done after dilution (104–105 times) of labeled protein with unlabeled monomer α-synuclein. Therefore, the chance of having more than one labeled molecule in an oligomer is insignificant, when the aggregates are not too big. Experimentally this is confirmed by the fact that the brightness of the oligomers does not increase. The spikes are due to big oligomers with multiple labeling.
Figure 2.
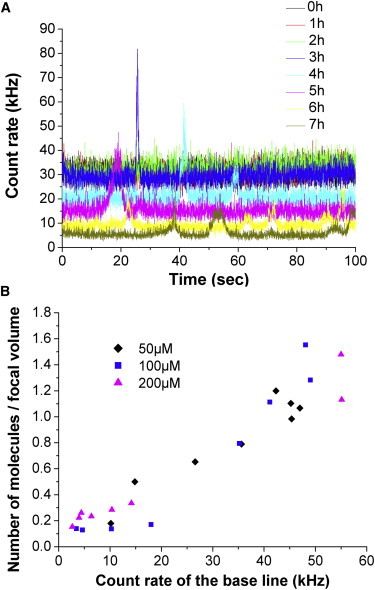
Decreasing count rate of fluorescence with oligomerization. (A) Gradual decrease of the count rate of the base line, with formation of big aggregates (spikes) with increasing time of aggregation. (B) The number of molecules (y axis), as obtained from the amplitude of the FCS curves, correlates nicely with the average intensity (count rate) of the fluctuating signal between the spikes.
Visualization of aggregates by laser-scanning microscopy (LSM)
Confocal images were taken at the bottom of the glass slide and in solution 100 μm above the glass slide after every FCS measurement. Results show precipitation of the large aggregates on the glass slide at later hours. Initially when the diffusion coefficients are corresponding to small oligomers, no big aggregates are visible on the glass slide or in solution (100 μm above the glass plate; Fig. 3, a and b). However, at 3.5 h significant precipitation on the glass plates is visible. Big, almost immobile, aggregates are also visible in solution (100 μm above the glass plate) at 3.5 h (Fig. 3, c–e). Most of the proteins are precipitated between 4 and 5 h at 100-μM concentration.
Figure 3.
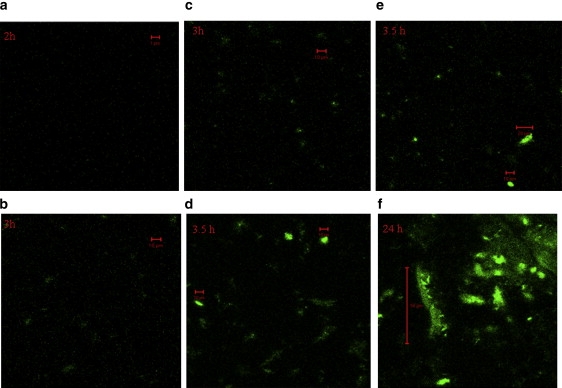
Visualization of aggregates by laser-scanning microscopy. Images were taken after each hour of aggregation of α-synuclein at 45°C with a concentration of 100 μM. (a) After 2 h of aggregation when the diffusion coefficient still corresponds to a monomer, no big aggregates are visible on the glass slide. (b) After 3 h, when FCS measurements show a transient intermediate corresponding to an average diffusion coefficient of 78 ± 15 μm2/s, a few big aggregates are seen in solution (100 μm above the glass slide) or (c) as precipitates on the bottom of the glass slide. (d) After 3.5 h, large (10 μm) aggregates are observed in solution and (e) as precipitates (10–20 μm) on the bottom of the glass slide. (f) After 24 h of aggregation, big aggregates of lengths >100 μm are precipitated on the glass slide.
The results seem to indicate that the sharp decrease of the number of molecules in the focal volume is due to the precipitation of big aggregates on the bottom of the glass slide. In addition, larger immobile big aggregates in solution pass less frequently through the focal volume. The aggregates are mostly globular in overall shape. Large fibrils are visible after 24 h of incubation at 45°C (Fig. 3 f).
Images were also taken by differential interference contrast microscopy to clearly visualize the precipitates on the glass slides (Fig. S7). Several aggregates are without fluorescent label, due to the high dilution (104–105 times) during measurements with unlabeled proteins. Fluorescent aggregates are detectable by FCS (after 3 h) earlier than the appearance of the turbidity signal. In the absence of magnetic stirring, no aggregation is visible by FCS in solution, nor in the image of the glass slide, even after 7 h of incubation at 45°C with 100 μM solution. With magnetic stirring, most of the samples show precipitated large aggregates after 5 h of incubation.
Aggregation kinetics by circular dichroism (CD)
Conformational studies were followed with aggregation at 100 μM concentration and 45°C using circular dichroism (CD) spectra. (For CD measurements, the samples were cooled to 20°C). The decrease of the CD spectra at 195 nm and increase at 218 nm with aggregation indicates the formation of β-sheet. The initial monomers are unstructured. No structural changes are visible in the CD spectra during the initial hours. The β-sheet structures are only visible at later hours. Intermediate spectra appeared after 4 h incubation in the case of the 100-μM solution at 45°C (Fig. 4), when, in FCS curves and LSM images, heterogeneous oligomeric aggregates appear with considerably larger sizes. The formation of β-sheets clearly occurs upon the formation of large aggregates. Electron microscopy pictures show formation of conventional fibers after 48 h of incubation at 45°C with magnetic stirring (Fig. S8).
Figure 4.
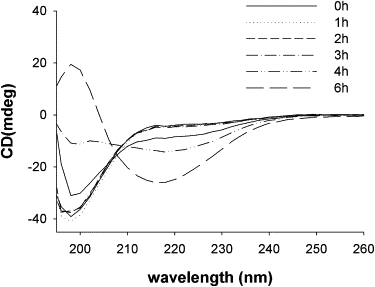
Conformational studies of aggregation using CD spectra. The initial random coil/unstructured protein starts to form β-structure after 4 h of incubation at a concentration of 100 μM and 45°C with stirring. After 6 h of aggregation, the characteristic β-sheet structure is visible.
Study of intramolecular fluorescence resonance energy transfer (FRET) signal in oligomers
The conformational change that accompanies oligomer formation was studied using fluorescence resonance energy transfer (FRET) between donor (Alexa-488) labeled N-terminus and an acceptor (TMRh)-labeled cysteine at position A140C. This dual-labeled α-synuclein (DAL-SYN) was used for FRET measurements. The time-resolved measurements on DAL-SYN showed a significant decrease in the mean lifetime τm ∼ 3.02 ns instead of ∼3.50 ns for DL-synuclein (Fig. 5 A). The fluorescence decay curve of DAL-SYN was fitted with a double-exponential with τ1 ∼ 1.55 ns (39–41% of amplitude fraction) and τ2 ∼ 4 ns (58–62%), and DL-SYN was also fitted with a double-exponential with τ1 ∼ 1.85 ns (22–24%) and τ2 ∼ 4 ns (77–79%). Donor and acceptor dyes dissolved in buffer have a single lifetime of τ ∼ 4 ns. This indicates that the bound donor experiences a complex environment on the protein. All curves were fitted with χ2 values in the range of 0.95–1.15. Although the reduction of the average lifetime in DAL-SYN compared to DL-SYN strongly suggests FRET (as well as the reduction of τ1 and its increased amplitude), the calculation of the FRET efficiency is quite uncertain due to the complexity of the lifetime data.
Figure 5.
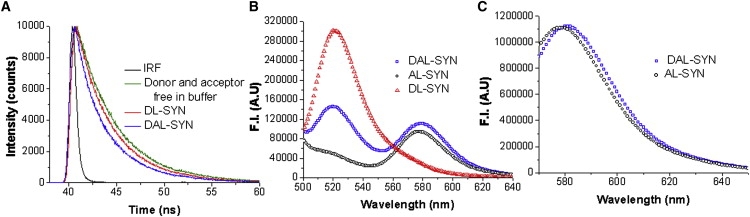
Measurements of FRET signals by time-resolved and steady-state fluorescence. (A) The decay curves show that the average lifetime of DAL-SYN (∼3.02 ns) is significantly shorter than DL-SYN (∼3.50 ns) and than that of the free donor and acceptor (1:1) in buffer (∼3.95 ns). (B) Steady-state fluorescence at Ex 480 nm with DAL-SYN shows significant quenching compared to DL-SYN at donor wavelength and enhancement compared to AL-WT-SYN at acceptor wavelength. (C) DAL and AL synucleins show almost overlapping emission spectra, when they were excited at acceptor wavelength (557 nm). Concentration of DL-SYN and DAL-SYN is 40 μM.
Steady-state fluorescence of DAL-SYN shows quenching of donor fluorescence and enhancement of acceptor fluorescence compared to DL-SYN and AL-SYN, respectively, upon oligomer formation (Fig. 5 B).
An important question is whether the FRET signal of DAL-synuclein is due to intra- or to intermolecular interactions. The previously measured diffusion coefficient of the monomers was 114 ± 15 μm2/s. However, DAL-SYN at pH 7.4 shows a distribution of diffusion coefficients with some higher oligomers. These oligomers are likely formed during the 2 h incubation at pH 6.5 for N-terminal donor labeling; this is suggested by the fact that DL-SYN treated in the same way, except for the presence of the N-terminal label, also shows the presence of oligomers.
The intramolecular origin of the FRET signal is shown by the fact that DAL-SYN shows only a small increase in the average lifetime when incubated with a 50-fold molar excess of unlabeled protein for 20 min (total concentration of mixture 100 μM) (Fig. S9). Assuming monomer exchange occurring in the oligomers, as evidenced by the decrease of the brightness of the particles, the fact that the FRET signal remains unchanged indicates its intramolecular origin. As a control, the fluorescence lifetime of DL-SYN remains also constant (but different) in the presence of different concentrations of unlabeled protein. The results convey that exchanging labeled protein for unlabeled protein does not abolish the FRET signal and that its origin is intramolecular.
Concentration-dependent conformational change studied by FRET
Dissociation of small aggregates/seeds of α-synuclein at alkaline pH (pH 10–11) is well known (36). The measurement of the size distribution at pH 11 showed a gradual dissociation of the oligomers (Fig. 6 A). Alkaline pH treatment also showed a gradual recovery of donor fluorescence (Ex/Em 490/520 nm) in time-resolved fluorescence measurements (Fig. 6 B). All measurements were done with 140 μM of total protein concentration with labeled/unlabeled synuclein (1:20). The results showed a gradual recovery of the average donor lifetime with time of pH treatment.
Figure 6.
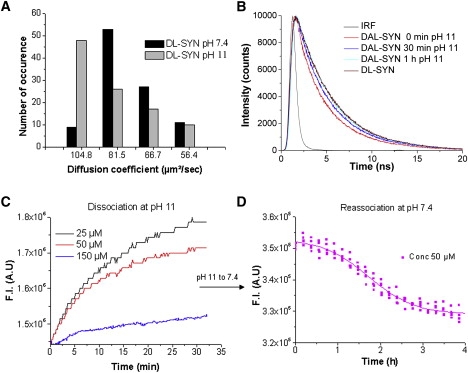
(A) Distribution of diffusion coefficients measured by FCS. DL-SYN was incubated for 20 min at pH 7.4 and pH 11, in the presence of 25-fold excess of unlabeled-SYN. The histograms were constructed from repeated (100 times) measurements during 10 s. (B) Recovery of the long donor lifetime in DAL-SYN after incubation at pH ∼ 11 and 20°C for increasing time intervals. The fluorescence decay was measured by TCSPC. All measurements were done with 140 μM of total concentration, where the ratio of unlabeled/DAL-SYN is 20:1. (C) Kinetics of dissolution of intermediates was measured by increase of the donor fluorescence signal (Ex 490 nm/Em 520 nm) using 4 μM of DAL-SYN at 37°C and pH ∼ 11 in presence of increasing concentration of unlabeled-SYN. (D) Reassociation kinetics measured by the decreasing donor fluorescence, due to FRET, at pH 7.4 after initial complete dissociation of DAL-SYN at pH 11 and 37°C at 50 μM total concentration.
The FRET results suggest dissociation of early intermediates/oligomers at pH ∼11, in agreement with the observed size distributions (Fig. 6 A). Intensity and lifetime of DL-synuclein is independent of pH 11. Because FRET is intramolecular, the result strongly suggests a strict linkage between the conformational change and the oligomerization.
Dissociation kinetics of early intermediates were also followed at steady state (Ex/Em at 490 nm/520 nm) from the increase of the donor signal at pH ∼11 and 37°C (Fig. 6 C). The result of the dissociation kinetics is concentration-dependent, where increasing concentrations of unlabeled-SYN were mixed with 4 μM of DAL-SYN. At higher concentrations, the dissociation rate is slower, and longer times are needed for complete dissociation of the intermediates.
The formation of the intermediates and the reassociation kinetics were followed at pH 7.4 for 4 h at 45°C with magnetic stirring, after initial dissociation of the intermediates at pH ∼11 (Fig. 6 D). It is assumed that after 30 min incubation at pH ∼11 of 50 μM α-synuclein, all molecules are dissociated into monomers. The results show that the FRET signal was not irreversibly lost at alkaline pH, and after returning to pH 7.4, a gradual decrease of donor signal during the early association process (initial 4 h) occurred. The concentration-dependency of the recovery of the FRET-signal at pH 11 further suggests a strong linkage between the conformational change and the association and dissociation of the protein.
Discussion
Early oligomers
In this study, we have been able to follow the initial steps of α-synuclein aggregation-forming early oligomers. Previously formation of higher oligomers and their heterogeneity was characterized, but by using different methods, such as AFM and FIDA (37). Here, FCS was used to follow the disappearance of the monomers and the concentration-dependent early oligomer formation and the development of their heterogeneity directly in solution during the process of aggregation. Immediately after the initiation of the reaction, repetitive FCS measurements with short sampling time reveal a very narrow distribution of diffusion times, indicating the presence of monomeric protein. An intermediate sharp distribution appears as a transient before the formation of significant heterogeneity (Fig. 1), with a diffusion coefficient of 78 ± 15 μm2/s. This value corresponds nicely with the diffusion coefficient of a linear dimer, but it cannot be excluded that this value represents a mixture of monomers and small oligomers.
In the later phase of the aggregation, the FCS measurements result in a broad distribution of average diffusion coefficients. The transition from the sharp initial distributions to the broad distribution of oligomers is relatively sharp and rapid (Fig. 1).
Kinetic analysis of early oligomer formation
The kinetic studies of many aggregating or polymerizing systems have been compared recently in a nice comprehensive overview (18–20) and most aggregation processes can be described by a simple two-state two-step model,
where A represents the protein in the nonpolymerized state in conformation A and B the monomers in conformation B. The second step is an autocatalytic step of induced conformational switching upon bimolecular interactions, and therefore B is a contagious state. The way that the model is usually used in data analysis implies that [B] represents the total concentration of protein in the polymeric state. The model assumes, further, that each monomer in a polymer is accessible for further aggregation.
The model can be described by rate equations that can be integrated, leading to the Finke-Watzky equation (18–20) describing the extent of the reaction as a function of time, either as the disappearance of A or the appearance of B:
The problem of linking the equation to experiments is to find a technique that produces a signal that measures uniquely and/or correctly [B]t or [A]t. The kinetic analysis is usually limited to the fitting of the [B]t equation to data concerning aggregate formation from turbidity or Thio T fluorescence. When plotting our data, i.e., the concentration of fast moving species as a function of time and the appearance of turbidity, S-shaped curves are obtained that can indeed be fitted to the two Finke-Watzky equations, but the rate constants obtained from fitting [A]t or [B]t are different (Table 1). This corresponds with the fact that the fast oligomers, as seen by FCS, disappear almost completely before the development of a significant signal from turbidity, or from CD (β-structure formation) (Fig. 7). This demonstrates the presence of an autocatalytic conformational change taking place in the oligomeric intermediates and before fibril formation with β-structures. Moreover the rate constant for the conformational switching (k1) is strongly concentration-dependent (Fig. 7), indicating that the conformational switching occurs upon molecular encounters. A more detailed kinetic analysis should involve a multistep process, describing explicitly the formation of early oligomers as distinct from the overall formation of B in the two-step model. However, such a detailed analysis is somewhat premature, as all the rate constants are so-called observed-rate constants, dependent on the rate of stirring.
Table 1.
Observed rate constants obtained from fitting [A]t or [B]t using Finke-Watzky equations
| Initial concentration of monomer | Appearance of polymer by turbidity |
Disappearance of monomer by FCS |
||
|---|---|---|---|---|
| k1 (h−1) | k2 (μM−1 h−1) | k1 (h−1) | k2 (μM−1 h−1) | |
| 50 μM | 0.0023 ± 0.0034 | 0.0096 ± 0.0045 | 0.014 ± 0.019 | 0.018 ± 0.008 |
| 100 μM | 0.0010 ± 0.0006 | 0.0081 ± 0.00081 | 0.045 ± 0.03 | 0.013 ± 0.003 |
| 200 μM | 0.0010 ± 0.0003 | 0.0043 ± 0.0002 | 0.34 ± 0.09 | 0.007 ± 0.002 |
The rate constants were obtained from fitting the model to the data collected at 45°C with continuous stirring (500 rpm).
Figure 7.
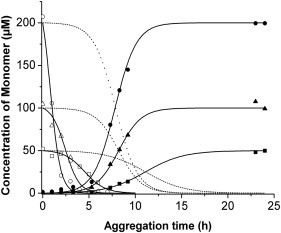
The kinetics of polymerization was fitted with Finke-Watzky equation describing the extent of reaction as a function of time. Curves (with open symbols) were fitted with the equation for the disappearance of the monomer (or A) at (□) 50 μM, (▵) 100 μM, and (○) 200 μM. The curves with the solid symbols were fitted with the equation for the appearance of polymer (or B) at the concentrations (▪) 50 μM, (▴) 100 μM, and (•) 200 μM dotted lines are the curves for the disappearance of monomers, calculated as the mirror image of the appearance of turbidity data fitted with equation B.
Further aggregation and β-sheet formation
Once the FCS measurements start to show broad heterogeneous distributions, large immobile aggregates are formed in solution and precipitates on the glass plates (2–10 μm) are clearly visible in the confocal images (Fig. 3). Aggregates are mostly globular in overall shape in the confocal microscope. Fibrillar structures are visible after 24 h of aggregation. Large precipitates and aggregates are almost immobile and pass through the confocal volume very infrequently (Fig. 2).
The time sequence of the CD spectra shows that the significant increase of β-structure only happens after the development of higher oligomers in FCS data (Fig. 4). Therefore, it can be concluded that the autocatalytic conformation does not yet have a β-structure.
Evidence for conformational switching from FRET studies
Conformational studies were done with oligomers, which are formed at pH 6 during the labeling with a donor at the N-terminal of the protein. These oligomers may not be exactly similar in size to those formed during our FCS studies with the singly (Alexa-488) labeled protein at the terminal cysteine. However, the measured diffusion coefficients reflect comparable sizes. Therefore, studies were done to see the effect of oligomerization on the conformation. In the past, formation of partially folded intermediates of α-synuclein were reported before structured fibrillation (21,34,38,39), which was based on a variety of techniques.
Our FRET study shows (Fig. 6 D) that aggregation of α-synuclein at early hours (<4 h) is accompanied by a conformational change. Dissociation of the oligomers (which formed at pH 6) at pH 11 causes recovery of the donor signal (Fig. 6). The concentration dependence of the recovery of the donor fluorescence with dissociation at alkaline pH (pH 11) suggests that the conformational change is strictly associated with oligomerization. Recently, evidence for a pH-dependent conformational change was also obtained by nuclear magnetic resonance techniques (39).
The formation of α-synuclein oligomeric species before the formation of larger structures and fibrils has been shown before (4,40) as well as their potential role in cell death (10,37). Therefore, the detection and the characterization of early oligomeric species is very important. Although this FCS method, using short sampling times, cannot detect the exact sizes of the species and their exact distribution, the method is quite sensitive to the formation of early aggregates and more sensitive than methods that only detect overall aggregate formation like turbidity, and Thio-T fluorescence. Moreover, these measurements are not suffering from the contribution of the big aggregates and their precipitation.
It is important to note that while this manuscript was in revision, a study by mass spectroscopy was published that also showed the presence of dimers and early oligomers (41).
Acknowledgments
The authors acknowledge the Research Foundation-Flanders (project No. G-0584-06N), the Belgian Federal Science council (contract No. IUAP P6/19), and the research fund of the Katholieke Universiteit Leuven (grant No. GOA 2006/02) for financial support.
The authors thank Prof. Thierry Verbiest (Department of Chemistry, University of Leuven) for the use of the CD-spectrometer, Prof. Vinod Subramaniam (University of Twente, Enschede, The Netherlands) for the help with the preparation of the protein, and Miloslav Korinek and Martin Hof (Academy of Sciences, Prague, Czech Republic) for the help with the building of the lifetime microscope. The authors thank the reviewers for constructive suggestions.
Supporting Material
References
- 1.Goedert M. Alpha-synuclein and neurodegenerative diseases. Nat. Rev. Neurosci. 2001;2:492–501. doi: 10.1038/35081564. [DOI] [PubMed] [Google Scholar]
- 2.Paleologou K.E., Kragh C.L., El-Agnaf O.M. Detection of elevated levels of soluble α-synuclein oligomers in post-mortem brain extracts from patients with dementia with Lewy bodies. Brain. 2009;132:1093–1101. doi: 10.1093/brain/awn349. [DOI] [PubMed] [Google Scholar]
- 3.Wakabayashi K., Tanji K., Takahashi H. The Lewy body in Parkinson's disease: molecules implicated in the formation and degradation of α-synuclein aggregates. Neuropathology. 2007;27:494–506. doi: 10.1111/j.1440-1789.2007.00803.x. [DOI] [PubMed] [Google Scholar]
- 4.Conway K.A., Lee S.J., Lansbury P.T., Jr. Acceleration of oligomerization, not fibrilization, is a shared property of both α-synuclein mutations linked to early-onset Parkinson's disease: implications for pathogenesis and therapy. Proc. Natl. Acad. Sci. USA. 2000;97:571–576. doi: 10.1073/pnas.97.2.571. [DOI] [PMC free article] [PubMed] [Google Scholar]
- 5.El-Agnaf O.M., Salem S.A., Allsop D. Detection of oligomeric forms of alpha-synuclein protein in human plasma as a potential biomarker for Parkinson's disease. FASEB J. 2006;20:419–425. doi: 10.1096/fj.03-1449com. [DOI] [PubMed] [Google Scholar]
- 6.Mihajlovic M., Lazaridis T. Membrane-bound structure and energetics of α-synuclein. Proteins. 2008;70:761–778. doi: 10.1002/prot.21558. [DOI] [PubMed] [Google Scholar]
- 7.Bussell R., Jr., Ramlall T.F., Eliezer D. Helix periodicity, topology, and dynamics of membrane-associated α-synuclein. Protein Sci. 2005;14:862–872. doi: 10.1110/ps.041255905. [DOI] [PMC free article] [PubMed] [Google Scholar]
- 8.Lin X.J., Zhang F., Hu H.Y. Secondary structural formation of α-synuclein amyloids as revealed by G-factor of solid-state circular dichroism. Biopolymers. 2006;83:226–232. doi: 10.1002/bip.20550. [DOI] [PubMed] [Google Scholar]
- 9.Vilar M., Chou H.T., Riek R. The fold of α-synuclein fibrils. Proc. Natl. Acad. Sci. USA. 2008;105:8637–8642. doi: 10.1073/pnas.0712179105. [DOI] [PMC free article] [PubMed] [Google Scholar]
- 10.Lashuel H.A., Petre B.M., Lansbury P.T., Jr. Alpha-synuclein, especially the Parkinson's disease-associated mutants, forms pore-like annular and tubular protofibrils. J. Mol. Biol. 2002;322:1089–1102. doi: 10.1016/s0022-2836(02)00735-0. [DOI] [PubMed] [Google Scholar]
- 11.Waxman E.A., Giasson B.I. Molecular mechanisms of α-synuclein neurodegeneration. Biochim. Biophys. Acta. 2009;15:32–39. doi: 10.1016/j.bbadis.2008.09.013. [DOI] [PMC free article] [PubMed] [Google Scholar]
- 12.Krouglova T., Vercammen J., Engelborghs Y. Correct diffusion coefficients of proteins in fluorescence correlation spectroscopy. Application to tubulin oligomers induced by Mg2+ and Paclitaxel. Biophys. J. 2004;87:2635–2646. doi: 10.1529/biophysj.104.040717. [DOI] [PMC free article] [PubMed] [Google Scholar]
- 13.Tjernberg L.O., Pramanik A., Rigler R. Amyloid β-peptide polymerization studied using fluorescence correlation spectroscopy. Chem. Biol. 1999;6:53–62. doi: 10.1016/S1074-5521(99)80020-9. [DOI] [PubMed] [Google Scholar]
- 14.Gerard M., Debyser Z., Engelborghs Y. The aggregation of α-synuclein is stimulated by FK506 binding proteins as shown by fluorescence correlation spectroscopy. FASEB J. 2006;20:524–526. doi: 10.1096/fj.05-5126fje. [DOI] [PubMed] [Google Scholar]
- 15.Giese A., Bader B., Kretzschmar H. Single particle detection and characterization of synuclein co-aggregation. Biochem. Biophys. Res. Commun. 2005;333:1202–1210. doi: 10.1016/j.bbrc.2005.06.025. [DOI] [PubMed] [Google Scholar]
- 16.Vercammen J., Maertens G., Engelborghs Y. DNA-induced polymerization of HIV-1 integrase analyzed with fluorescence fluctuation spectroscopy. J. Biol. Chem. 2002;277:38045–38052. doi: 10.1074/jbc.M205842200. [DOI] [PubMed] [Google Scholar]
- 17.Buyens K., Lucas B., Sanders N.N. A fast and sensitive method for measuring the integrity of siRNA-carrier complexes in full human serum. J. Control. Release. 2008;126:67–76. doi: 10.1016/j.jconrel.2007.10.024. [DOI] [PubMed] [Google Scholar]
- 18.Morris A.M., Finke R.G. Alpha-synuclein aggregation variable temperature and variable pH kinetic data: a re-analysis using the Finke-Watzky 2-step model of nucleation and autocatalytic growth. Biophys. Chem. 2009;140:9–15. doi: 10.1016/j.bpc.2008.11.003. [DOI] [PubMed] [Google Scholar]
- 19.Morris A.M., Watzky M.A., Finke R.G. Fitting neurological protein aggregation kinetic data via a 2-step, minimal/“Ockham's razor” model: the Finke-Watzky mechanism of nucleation followed by autocatalytic surface growth. Biochemistry. 2008;47:2413–2427. doi: 10.1021/bi701899y. [DOI] [PubMed] [Google Scholar]
- 20.Morris A.M., Watzky M.A., Finke R.G. Protein aggregation kinetics, mechanism, and curve-fitting: a review of the literature. Biochim. Biophys. Acta. Proteins Proteomics. 2009;1794:375–397. doi: 10.1016/j.bbapap.2008.10.016. [DOI] [PubMed] [Google Scholar]
- 21.Thirunavukkuarasu S., Jares-Erijman E.A., Jovin T.M. Multiparametric fluorescence detection of early stages in the amyloid protein aggregation of pyrene-labeled α-synuclein. J. Mol. Biol. 2008;378:1064–1073. doi: 10.1016/j.jmb.2008.03.034. [DOI] [PubMed] [Google Scholar]
- 22.van Raaij M.E., Segers-Nolten I.M., Subramaniam V. Quantitative morphological analysis reveals ultrastructural diversity of amyloid fibrils from α-synuclein mutants. Biophys. J. 2006;91:L96–L98. doi: 10.1529/biophysj.106.090449. [DOI] [PMC free article] [PubMed] [Google Scholar]
- 23.Kostka M., Högen T., Giese A. Single particle characterization of iron-induced pore-forming α-synuclein oligomers. J. Biol. Chem. 2008;283:10992–11003. doi: 10.1074/jbc.M709634200. [DOI] [PubMed] [Google Scholar]
- 24.Hamman B.D., Oleinikov A.V., Jameson D.M. Tetramethylrhodamine dimer formation as a spectroscopic probe of the conformation of Escherichia coli ribosomal protein L7/L12 dimers. J. Biol. Chem. 1996;271:7568–7573. doi: 10.1074/jbc.271.13.7568. [DOI] [PubMed] [Google Scholar]
- 25.Westphal A.H., Matorin A., Visser A.J. Real-time enzyme dynamics illustrated with fluorescence spectroscopy of p-hydroxybenzoate hydroxylase. J. Biol. Chem. 2006;281:11074–11081. doi: 10.1074/jbc.M600609200. [DOI] [PubMed] [Google Scholar]
- 26.Tynan-Connolly B.M., Nielsen J.E. Redesigning protein pKa values. Protein Sci. 2007;16:239–249. doi: 10.1110/ps.062538707. [DOI] [PMC free article] [PubMed] [Google Scholar]
- 27.Oganesyan A., Cruz I.A., Gutierrez C.G. High yield selective acylation of polyamines: proton as protecting group. Org. Lett. 2007;9:4967–4970. doi: 10.1021/ol702206d. [DOI] [PubMed] [Google Scholar]
- 28.Koch H.P., Larsson H.P. Small-scale molecular motions accomplish glutamate uptake in human glutamate transporters. J. Neurosci. 2005;25:1730–1736. doi: 10.1523/JNEUROSCI.4138-04.2005. [DOI] [PMC free article] [PubMed] [Google Scholar]
- 29.Doeven M.K., Folgering J.H., Poolman B. Distribution, lateral mobility and function of membrane proteins incorporated into giant unilamellar vesicles. Biophys. J. 2005;88:1134–1142. doi: 10.1529/biophysj.104.053413. [DOI] [PMC free article] [PubMed] [Google Scholar]
- 30.Benda A., Hof M., Kapusta P. TCSPC upgrade of a confocal FCS microscope. Rev. Sci. Instrum. 2005;76:1–4. [Google Scholar]
- 31.Maity H., Maiti N.C., Jarori G.K. Time-resolved fluorescence of tryptophans in yeast hexokinase-PI: effect of subunit dimerization and ligand binding. J. Photochem. Photobiol. B. 2000;55:20–26. doi: 10.1016/s1011-1344(00)00019-1. [DOI] [PubMed] [Google Scholar]
- 32.McNulty B.C., Tripathy A., Pielak G.J. Temperature-induced reversible conformational change in the first 100 residues of α-synuclein. Protein Sci. 2006;15:602–608. doi: 10.1110/ps.051867106. [DOI] [PMC free article] [PubMed] [Google Scholar]
- 33.Dedmon M.M., Lindorff-Larsen K., Dobson C.M. Mapping long-range interactions in α-synuclein using spin-label NMR and ensemble molecular dynamics simulations. J. Am. Chem. Soc. 2005;127:476–477. doi: 10.1021/ja044834j. [DOI] [PubMed] [Google Scholar]
- 34.Ferreon A.C.M., Gambin Y., Deniz A.A. Interplay of α-synuclein binding and conformational switching probed by single-molecule fluorescence. Proc. Natl. Acad. Sci. USA. 2009;106:5645–5650. doi: 10.1073/pnas.0809232106. [DOI] [PMC free article] [PubMed] [Google Scholar]
- 35.Uversky V.N., Li J., Fink A.L. Evidence for a partially folded intermediate in α-synuclein fibril formation. J. Biol. Chem. 2001;276:10737–10744. doi: 10.1074/jbc.M010907200. [DOI] [PubMed] [Google Scholar]
- 36.Cohlberg J.A., Li J., Fink A.L. Heparin and other glycosaminoglycans stimulate the formation of amyloid fibrils from α-synuclein in vitro. Biochemistry. 2002;41:1502–1511. doi: 10.1021/bi011711s. [DOI] [PubMed] [Google Scholar]
- 37.Danzer K.M., Haasen D., Kostka M. Different species of α-synuclein oligomers induce calcium influx and seeding. J. Neurosci. 2007;27:9220–9232. doi: 10.1523/JNEUROSCI.2617-07.2007. [DOI] [PMC free article] [PubMed] [Google Scholar]
- 38.Lee J.C., Langen R., Winkler J.R. Alpha-synuclein structures from fluorescence energy-transfer kinetics: implications for the role of the protein in Parkinson's disease. Proc. Natl. Acad. Sci. USA. 2004;101:16466–16471. doi: 10.1073/pnas.0407307101. [DOI] [PMC free article] [PubMed] [Google Scholar]
- 39.Cho M.K., Nodet G., Zweckstetter M. Structural characterization of α-synuclein in an aggregation prone state. Protein Sci. 2009;18:1840–1846. doi: 10.1002/pro.194. [DOI] [PMC free article] [PubMed] [Google Scholar]
- 40.Fink A.L. The aggregation and fibrillation of α-synuclein. Acc. Chem. Res. 2006;39:628–634. doi: 10.1021/ar050073t. [DOI] [PubMed] [Google Scholar]
- 41.Frimpong A.K., Abzalimov R.R., Uversky V.N., Kaltashov I.A. Characterization of intrinsically disordered proteins with electrospray ionization mass spectrometry: conformational heterogeneity of α-synuclein. Proteins. 2009;78:714–722. doi: 10.1002/prot.22604. [DOI] [PMC free article] [PubMed] [Google Scholar]
Associated Data
This section collects any data citations, data availability statements, or supplementary materials included in this article.