Abstract
Molecular probes with zinc(II)-(2,2’-dipicolylamine) coordination complexes associate with oxyanions in aqueous solution and target biomembranes that contain anionic phospholipids. This study examines a new series of coordination complexes with 2,6-bis(zinc(II)-dipicolylamine) phenoxide as the molecular recognition unit. Two lipophilic analogues are observed to partition into the membranes of zwitterionic and anionic vesicles and induce the transport of phospholipids and hydrophilic anions (carboxyfluorescein). These lipophilic zinc complexes are moderately toxic to mammalian cells. A more hydrophilic analogue does not exhibit mammalian cell toxicity (LD50 >50 µg/mL), but it is highly active against the Gram-positive bacteria Staphylococcus aureus (MIC of 1 µg/mL). Furthermore, it is active against clinically important S. aureus strains that are resistant to various antibiotics including vancomycin and oxacillin. The antibiotic action is attributed to its ability to depolarize the bacterial cell membrane. The intense bacterial staining exhibited by a fluorescent conjugate suggests that this family of zinc coordination complexes can be used as molecular probes for the detection and imaging of bacteria.
Keywords: antibiotics, phospholipid, fluorescent probes, zinc, transport
Introduction
Molecules with selective cell surface recognition properties are used extensively in cell biology, biotechnology, and medicine.[1] For example, high molecular weight antibodies are employed as reagents in purification processes, sensing assays, and imaging technologies.[2] They also have value as pharmaceutical agents.[3] Various small biomolecules, especially peptides, are known to exhibit selective cell targeting properties.[4] In addition, small molecules that target and disrupt the membranes of microorganisms are pursued as drug candidates for treating various infectious diseases.[5] As part of a program to develop molecular probes for imaging of infectious disease, we are investigating synthetic molecules that can differentiate between healthy mammalian cells and microorganisms.[6] The cell plasma membranes is a complicated supramolecular assembly of proteins and polar lipids, and there is a rich array of potential biomarkers for targeting. However, a notable difference between these two types of cells is the composition and charge of the polar lipids that decorate the cell surface. The plasma membrane outer leaflet of most mammalian cells is primarily composed of zwitterionic phospholipids such as sphingomyelin and phosphatidylcholine.[7] In contrast, the exterior surface of bacterial cells contains a high fraction of anionic phospholipids and related anionic amphiphiles.[8] This difference in surface charge helps explain why cationic compounds have an inherent selectivity for bacterial cells over mammalian cells. Indeed, most classes of antimicrobial peptides have a net positive charge.[9]
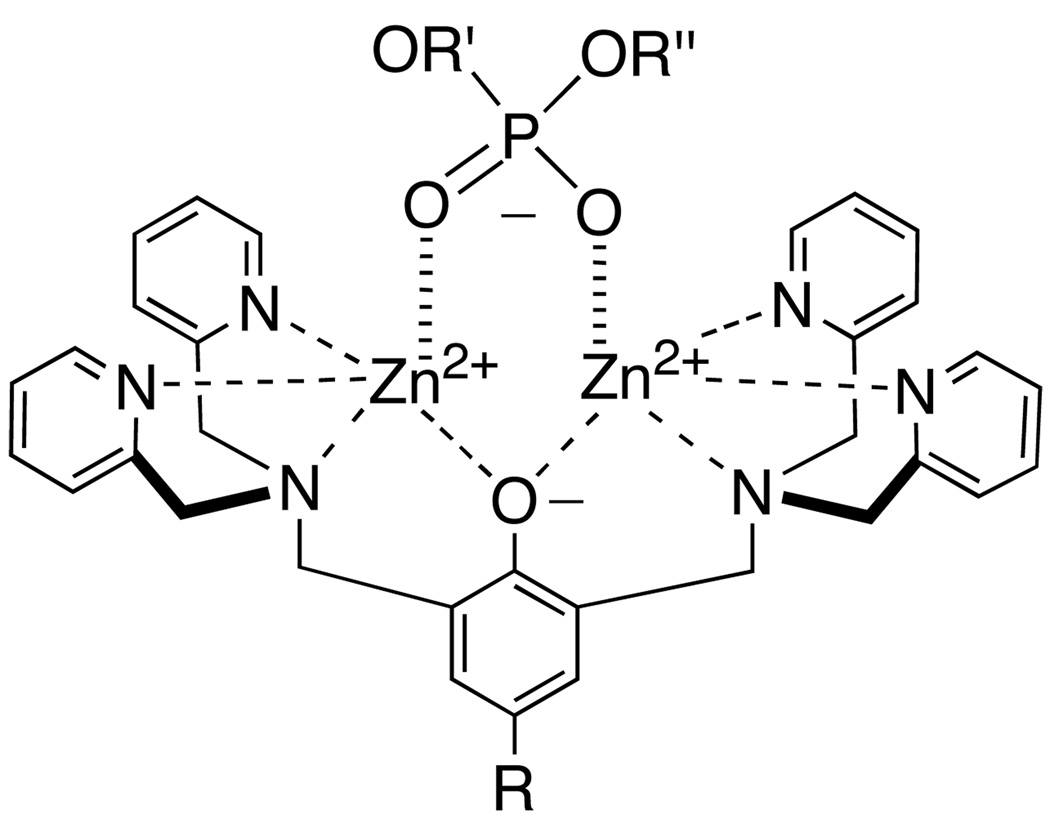
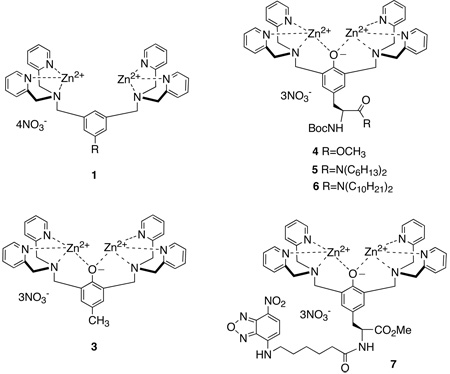
This study focuses on the cell recognition properties of synthetic zinc coordination complexes.[10] These compounds have been examined extensively as simplified models for various phosphate binding processes, and also as functional molecules such as catalysts, sensors, and receptor antagonists.[11] Recently, we discovered that fluorescent coordination complexes 1, with two zinc(II) 2,2’-dipicolylamine units, have a remarkable ability to selectively stain bacterial cells in preference to mammalian cells.[12] Furthermore, we have developed fluorescent near-infrared derivatives of 1 that can target and identify bacterial infection in living mice.[13] Here, we describe the cell recognition properties of a second-generation design, 2, which is based on 2,6-bis(zinc(II)-dipicolylamine) phenoxide as a synthetic anion binding receptor. This dinuclear zinc coordination complex associates strongly with phosphate derivatives in aqueous solution and to a lesser extent with carboxylates (Scheme 1).[14] We have previously reported the tyrosine derivative 4 and briefly described its vesicle binding properties.[15] The ease of synthetic manipulation makes 4 a versatile building block for conjugation.[16] The fluorescent conjugate 7 has negligible affinity for vesicle membranes that are composed only of zwitterionic phosphatidylcholine, but it associates strongly with vesicles that include anionic phospholipids and even penetrates into the bilayer membrane. We now describe in detail the vesicle and cell membrane recognition properties of this family of zinc coordination complexes. We find that lipophilic analogues 5 and 6 are able to partition into zwitterionic vesicles and promote the translocation of phospholipids and hydrophilic anions across the vesicle membrane. Furthermore, 5 and 6 are moderately toxic to mammalian cells. The more hydrophilic version 3 does not interact with mammalian cells but it exhibits potent and selective toxicity against the pathogenic bacterium Staphylococcus aureus. Mechanistic studies suggest that 3 depolarizes the bacterial membrane which explains why it is highly active against strains of S. aureus that are resistant to the important clinical drugs vancomycin and oxacillin.
Scheme 1.
Association of zinc complex 2 with phosphate anion
Results and Discussion
Vesicle Studies
Enhanced Phospholipid Flip-Flop
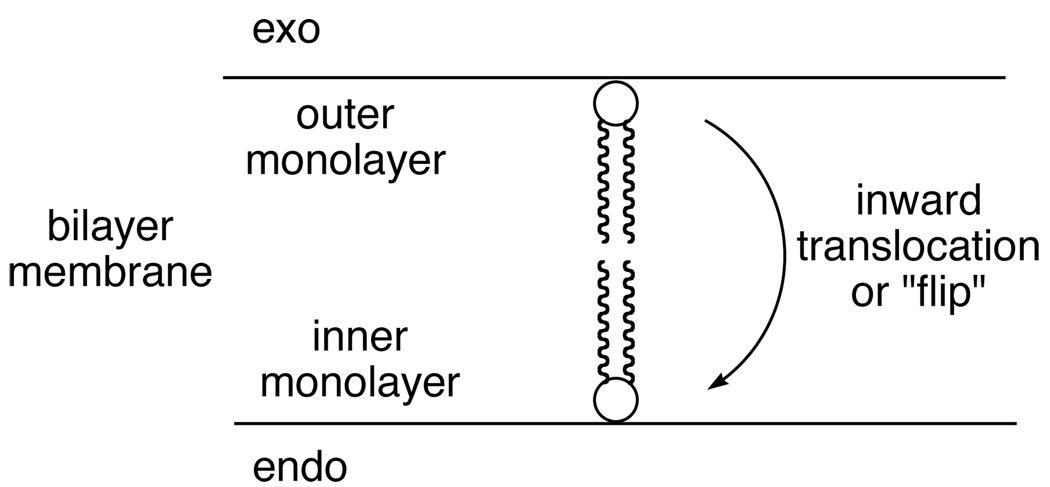
The ability of zinc complexes 3–6 to associate with vesicle membranes and promote inward phospholipid translocation (Scheme 2) was measured using fluorescent NBD-phospholipids and an established NBD/dithionite quenching assay.[17] The method is based on the ability of dithionite to chemically react with the NBD-chromophore to give a non-fluorescent product. Since dithionite anion diffuses very slowly through vesicle membranes it will only react and quench the fluorescence of an NBD-phospholipid in the outer monolayer of the membrane. The background translocation experiment starts by adding a small amount of NBD-phospholipid (0.5 % of total lipid) to a dispersion of vesicles. The NBD-phospholipid incorporates into the outer monolayer creating 100% exo-labeled vesicles. Every fifteen minutes an aliquot of vesicles is removed and treated with dithionite, which allows the percent of exo NBD- phospholipid to be determined. The experiment progresses towards an equilibrated value of about 60% exo NBD-phospholipid. The half-life is the time to reach 80% exo NBD-phospholipid, and the unassisted background value is many hours.
Scheme 2.
Phospholipid translocation
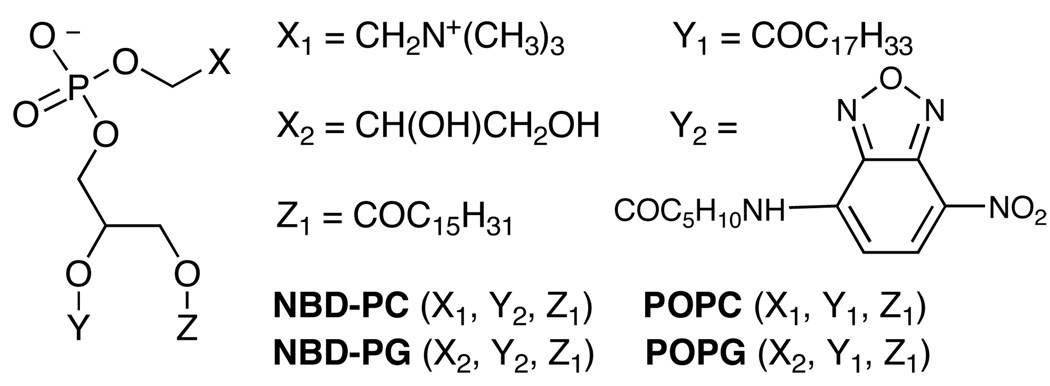
The structures of the probes and phospholipids are provided in Scheme 3 and the translocation half-lives induced by the presence of compounds 3–6 are given in Table 1. These experiments utilized two NBD-phospholipid probes (zwitterionic NBD-PC and anionic NBD-PG) with two types of vesicle systems (zwitterionic vesicles composed of 100 mol% POPC, and anionic vesicles composed of POPG:POPC, 1:9). To induce translocation of an NBD-phospholipid probe, the zinc complex must penetrate the vesicle membrane and also associate with the probe to make a charge-neutral aggregate that can diffuse across the membrane. Since all of the zinc complexes are cationic it is not surprising that they do not promote the translocation of zwitterionic probe, NBD-PC (translocation half-life >60 min) in any vesicle system. The relatively hydrophilic complexes 3 and 4 do not accelerate flip-flop of the anionic NBD-PG probe in POPC vesicles, presumably because these hydrophilic zinc complexes do not associate with the nearly neutral vesicles (the anionic probe is only present at 0.5% of total lipid). However, 3 and 4 do associate with anionic POPG:POPC (1:9) vesicles and shorten the translocation half-life of NBD-PG probe to 30 and 20 min, respectively. In contrast to this vesicle selectivity, the more lipophilic zinc complexes 5 and 6 partition into both the uncharged and anionic vesicle systems and strongly promote NBD-PG flip-flop. Literature evidence suggests that the anionic phosphate diester head group of the PG probe is chelated to both zinc cations (Scheme 1),[14] and the aggregate diffuses across the bilayer membrane. Since each of these zinc complexes has a net +3 charge, the requirement for charge balance requires simultaneously transport of several anions across the membrane.[18]
Scheme 3.
Table 1.
Effect of zinc complexes on membrane translocation half-lives.
| Probe Translocation Half-Life (min)[a] | |||
|---|---|---|---|
| Vesicles: 100% POPC |
Vesicles: 1:9 POPG:POPC |
||
| Complex (1 µM) |
NBD-PG | NBD-PC | NBD-PG |
| 3 | >60 | >60 | 30 |
| 4 | >60 | >60 | 20 |
| 5 | 12 | >60 | 20 |
| 6 | 20 | >60 | >60 |
Time to reach 80% exo-NBD-phospholipid, average half-life error ± 33%.
Enhanced Carboxyfluorescein Transport
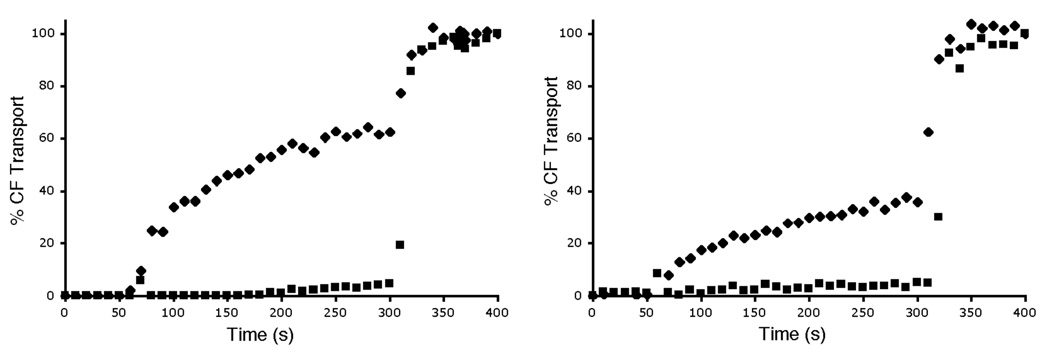
The carboxyfluorescein (CF) leakage assay was employed to determine if the zinc complexes could transport hydrophilic anions across vesicle membranes. [19] CF was encapsulated inside vesicles at high, self-quenching concentrations. Transport out of the vesicles leads to dilution of the dye and a large increase in fluorescence intensity. In agreement with the phospholipid translocation data, the hydrophilic zinc complexes 3 and 4 did not induce CF leakage from zwitterionic POPC vesicles and produced only slight leakage from anionic POPG:POPC, 1:9 vesicles (data not shown). The more lipophilic zinc complexes 5 and 6 were much more effective at promoting CF leakage. Shown in Figure 1 is the leakage induced upon addition of complex 6. The data highlights two trends, (a) almost twice as much leakage occurs from zwitterionic, POPC vesicles than from anionic, POPG:POPC, 1:9 vesicles, and (b) CF leakage is completely inhibited when the external vesicle solution is changed from 5 mM TES in 100 mM NaCl, to 5 mM TES in 75 mM Na2SO4. These two results are consistent with a membrane transport process that involves direct coordination of the CF to the zinc complex. Thus, CF leakage from the anionic, POPG:POPC vesicles is inhibited because the anionic POPG head group competes for the zinc coordination sites (Scheme 1). Similarly, CF release from the vesicles can only occur if there is concomitant entry of a counter anion, which is kinetically feasible when the external solution contains the relatively lipophilic chloride, but it becomes very unfavorable when the external solution only contains sulfate dianion. The sulfate dianion is extremely hydrophilic and transport into a membrane involves a major dehydration penalty. Sulfate-inhibited transport is a signature of anion counter-transport processes that involve intimate association between the anion and the transporter.[20]
Figure 1.
CF transport from vesicles induced by addition of zinc complex 6 (1 µM) at 50 s to vesicles in 5 mM TES (pH 7.4) buffer with either 100 mM NaCl (◆) or 75 mM Na2SO4 (■), followed by vesicle lysis with Triton X-100 at 300 s. (left) Zwitterionic vesicles composed of POPC; (right) Anionic vesicles composed of POPG:POPC (1:9).
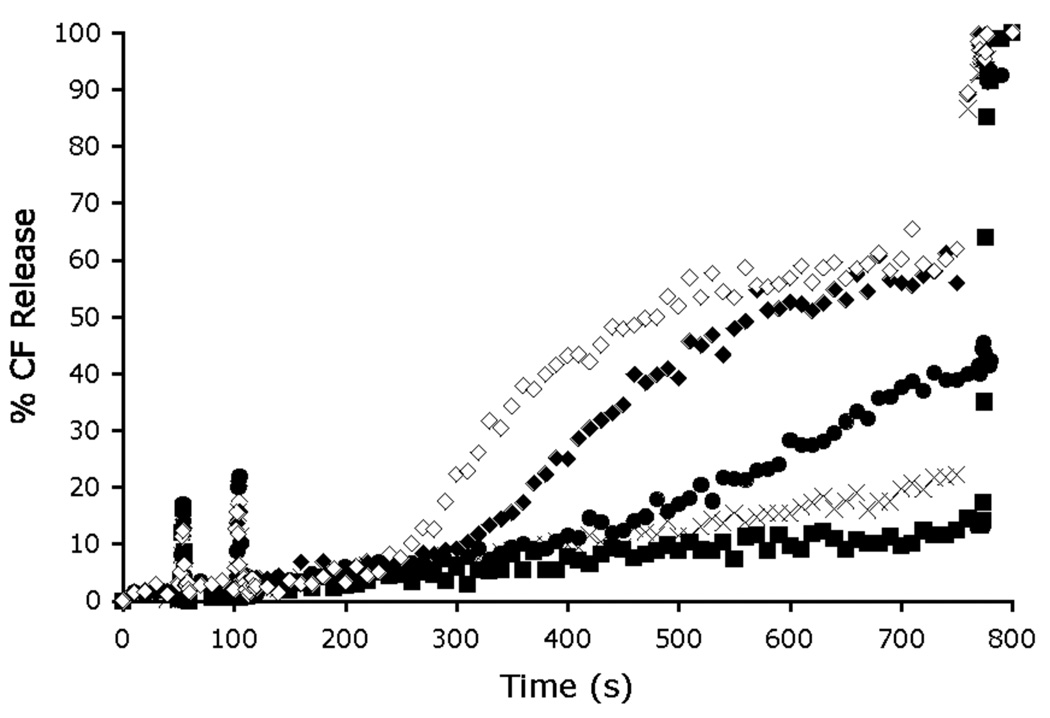
Proof that the zinc cations are critical for membrane transport was gained by measuring CF transport activity in the presence and absence of zinc cations. As shown in Figure 2, addition of 1 µM of apo-6 (i.e., the uncharged phenol version of 6 without the two zinc cations) at 50 s to vesicles containing CF does not produce CF leakage. However, if two-molar equivalents of Zn(NO3)2 are subsequently added to the vesicle dispersion at 100 s, extensive CF leakage begins to occur after a 150 s induction period (presumably the time period required to form the dinuclear zinc complex 6). The final amount of CF leakage is essentially the same as that observed when the same concentration of preformed zinc complex 6 (1 µM) is added to the vesicles (compare Figure 2 with Figure 1). The other leakage curves in Figure 2 show that the amount of transport is decreased and the induction time is increased with sub-stoichiometric amounts of added Zn(NO3)2. These features are additional evidence that a multicomponent association process is required to produce 6 as the kinetically active CF transporter. Finally, the dependence of CF transport was measured at different concentrations of preformed 6. As shown in Figure 3, the initial flux is directly proportional to the concentration of 6, which suggests that CF transport is produced by a stoichiometric recognition process and is not simply due to non-specific membrane disruption. Taken together, the CF leakage data presents a compelling kinetic case that a liphophilic dinuclear zinc complex is required for CF transport across uncharged POPC vesicles, and that transport likely involves direct coordination of the oxyanion to the two zinc cations.
Figure 2.
Dependence of CF release on zinc complexation to form transport active 6. Apo-6 (1 µM) was added at 50 s to POPC vesicles (25 µM). Inside the vesicles is 5 mM TES, 50 mM CF, 100 mM NaCl (pH 7.4) buffer; outside the vesicles is 5 mM TES, 100 mM NaCl (pH 7.4) buffer. Zn(NO3)2 (0 µM (■), 0.25 µM (×), 0.5 µM (●), 1 µM (◆) and 2 µM (◇)) was added at 100 s and the vesicles lysed with Triton X-100 at 750 s.
Figure 3.
Initial CF flux at different concentrations of 6. Vesicles [25 µM lipid, POPC: cholesterol 7:3, encapsulating 5 mM TES, 100 mM NaCl, 50 mM CF (pH 7.4) buffer] were dispersed in 5 mM TES, 100 mM NaCl (pH 7.4) buffer and treated with varying concentrations of 6. The initial flux is the % CF transport at 20 s after addition of 6. The error bars reflect the averages of three independent experiments.
The vesicles studies raise the following hypothesis. Lipophilic zinc complexes 5 and 6 can partition into mammalian and bacterial cell membranes and exhibit general cell toxicity by promoting anion transport and phospholipid flip-flop. In contrast, hydrophilic analogues 3 and 4 do not associate with the zwitterionic surfaces of mammalian cells, but they can partition into the anionic membranes of bacterial cells and thus exhibit selective cell toxicity. The following cell toxicity studies were conducted to confirm this hypothesis.
Mammalian Cell Toxicity
Compounds 3–6 were evaluated for toxicity against three human cancer cell lines; Jurkat (T-cell leukemia), PC3 (androgen-independent prostatic) and LNCaP (androgen-dependent prostatic) cells. The colorimetric MTT assay was used to determine cellular viability. Briefly, the cells were dispersed in 96-well plates and incubated at 37° C for 24 h. The growth media was exchanged with fresh media and then treated with MTT [3-(4,5-dimethylthiazol-2-yl)-2,5-diphenyltetrazolium bromide]. In healthy cells, with active mitochondrial systems, the MTT is reduced to formazan, a purple colored compound. The amount of formazan absorption is related to the number of viable cells. The toxicity of the zinc complexes was observed to be dose dependent and the LD50 values are listed Table 2. The hydrophilic zinc complexes 3 and 4 did not cause significant cell death at concentrations up to 50 µM. However, there was moderate toxicity with the more lipophilic complexes, 5 and 6 (LD50 values between 2 and 30 µM), a trend that correlates with membrane transport activity. Thus, it appears that mammalian cell toxicity increases with cell permeability of the zinc complex. While the precise cell death mechanism is not clear at present, it is relevant to note that a structurally related series of cell permeable zinc complexes was very recently shown to induce apoptosis by repression of bcl-2 expression. [21]
Table 2.
Mammalian cell toxicity
| Zinc Complex |
Jurkat cells | LD50 (µM)[a] PC3 cells |
LNCaP cells |
|---|---|---|---|
| 3 | >50 | >50 | >50 |
| 4 | >50 | >50 | >50 |
| 5 | 30 | 5 | 20 |
| 6 | 5 | 2 | 5 |
Concentration of zinc complex required to decrease cell viability to 50%.
Bacteria Cell Imaging and Toxicity
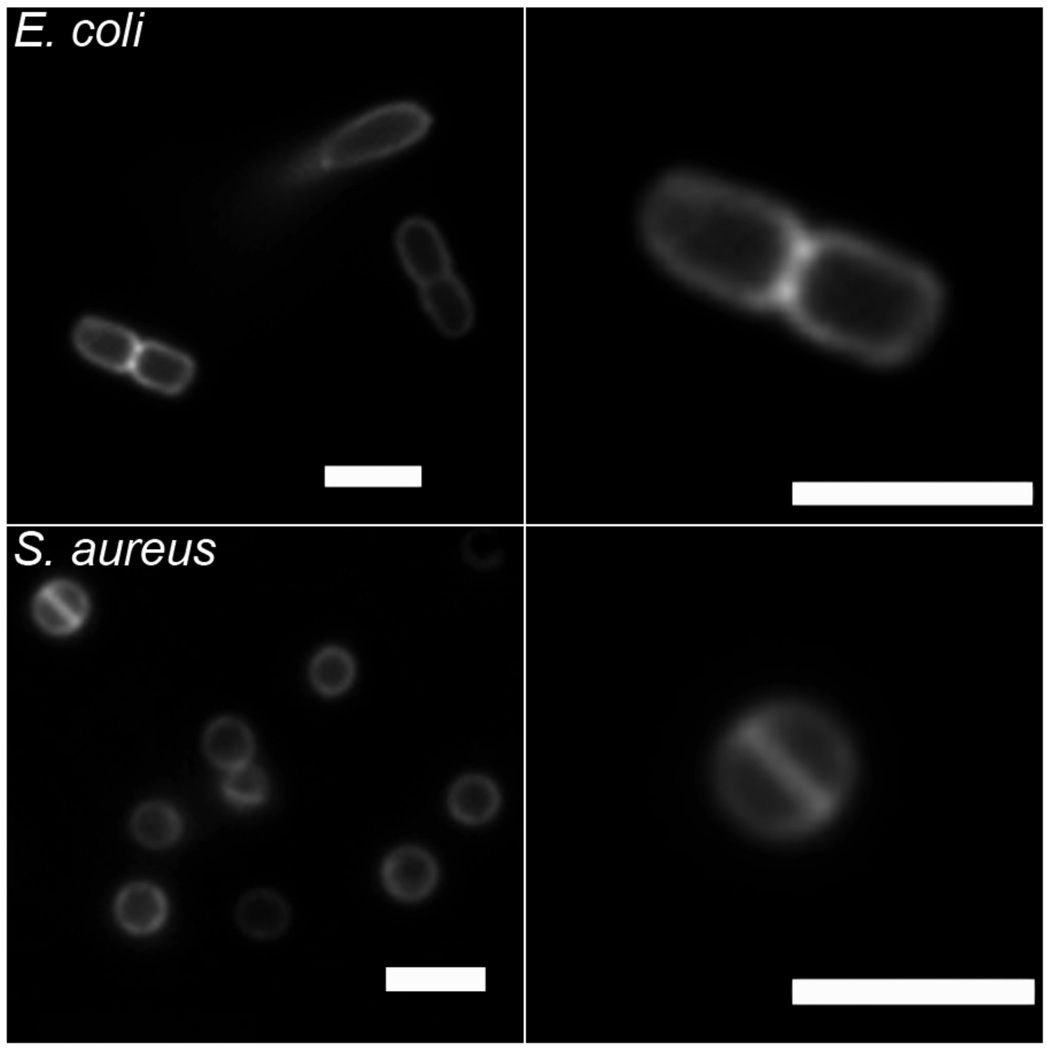
The ready availability of NBD-conjugate 7 allowed us to conduct bacterial cell imaging using fluorescence microscopy. In Figure 4 are fluorescence images of Escherichia coli and S. aureus that have been treated with 10 µM of 7, and subsequently washed twice with buffer. In both cases, the staining is localized to the cell walls, in agreement with previous imaging results obtained with fluorescent probes based on structure 1.[12] Also shown in Figure 4 are magnified examples of staining patterns that are consistent with cells undergoing the process of binary fission. Gram-positive bacteria like S. aureus are known to form an equatorial membrane that divides the cell into hemispheres before replication.[22] Meanwhile, Gram-negative bacteria like E. coli replicate by a symmetric invagination at the equator, which “pinches” the cell in half.[23] The NBD fluorophore is susceptible to photobleaching, which limits its utility in fluorescence microscopy. However, the intense staining exhibited by 7 is proof of concept that fluorescent conjugates of this family of zinc complexes should be useful additions to the small group of synthetic fluorescent probes that can target bacteria.[24]
Figure 4.
Fluorescence micrographs of E. coli (top row) and S. aureus (bottom row) cells, after treatment with zinc complex 7. The right panels are magnified to show single cells undergoing binary fission. Scale bar in each image represents 2 µm.
Since the hydrophilic zinc complex 3 was not toxic to mammalian cells, we evaluated its antibacterial activity against S. aureus and E. coli using the minimum inhibitory concentration (MIC) method.[25] The growth of E. coli was not prevented by the presence of 3 at the highest tested concentration of 100 µg/mL. However, S. aureus (ATCC 29213) cells were remarkably susceptible, with an MIC value of 1 µg/mL; a therapeutic index that is >50-fold selective for S. aureus over mammalian cells. This potent antibiotic activity contrasts with the low toxicity exhibited by 4-cresol (>100 µg/mL to inhibit S. aureus growth),[26] and the first-generation zinc complexes based on 1 (weakly toxic against E. coli or S. aureus). Bacterial growth inhibition assays were also conducted against two drug resistant strains of S. aureus. As listed in Table 3, the same MIC of 1 µg/mL was obtained against: (a) S. aureus (NRS100), a strain that is resistant to β-lactam antibiotics, including the drug oxacillin, and (b) S. aureus (VRS1) with resistance to both vancomycin and oxacillin. Additional experiments were performed to determine if zinc complex 3 can act in synergy with known antibiotics; however, sub-lethal concentrations of 3 did not significantly affect the activity of vancomycin or oxacillin.
Table 3.
Minimum inhibitory concentration (MIC).
| Antibiotic MIC (µg/mL)[a] | |||||
|---|---|---|---|---|---|
| 0.1 µg/mL 3 + |
|||||
| Microorganism | 3 | Van[b] | Oxa[c] | Van | Oxa |
| S. aureus 29213 | 1 | 1 | 0.3 | 1 | 0.1 |
| S. aureus (NRS 100) | 1 | 2 | 256 | 2 | 256 |
| S. aureus VRS1 (NARSA) | 1 | 1,000 | 256 | 1,000 | 256 |
Minimum inhibitory concentration,
Vancomycin,
Oxacillin
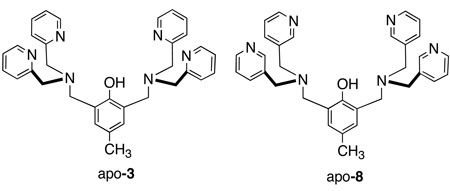
Evidence that metal coordination is necessary for antibiotic activity is the large difference in MIC values for the uncomplexed apo-3 and it isomer apo-8. Against S. aureus, the MIC values were 1 µg/mL for apo-3 and >40 µg/mL for apo-8. Since apo-8 has two 3,3’-picolylamine units, it cannot form stable metal coordination complexes, and it exhibits a high MIC value that is typical for a simple phenol.[26] In contrast, there is little doubt that apo-3 is rapidly converted into a metal complex as seen in the vesicle studies (Figure 2). Since the concentration of zinc(II) in the testing media was around 15 µM,[27] the formation of zinc complex 3 is highly favored, however, we cannot rule out the possibility that other metal complexes may also be formed, especially copper(II). Even if these other metal complexes are formed they are likely to have similar oxyanion recognition properties.[28]
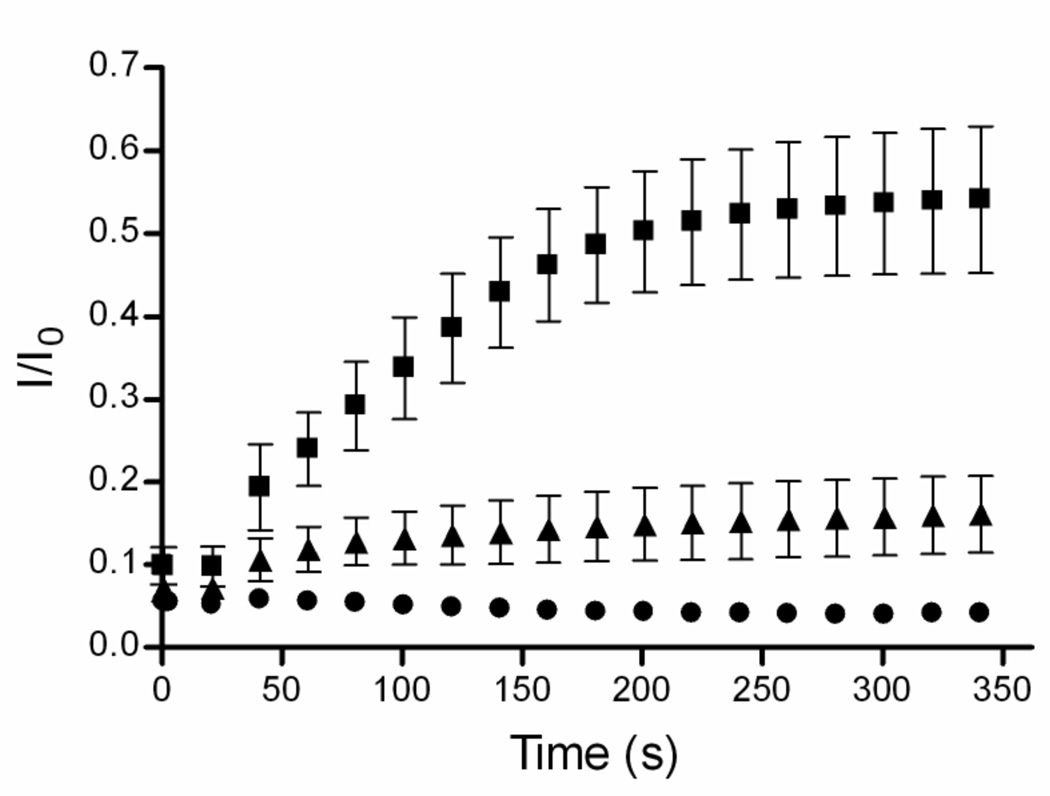
The vesicle studies and the bacteria imaging suggest that the antibiotic activity of 3 is due to its ability to selectively associate with the surface of the Gram-positive bacteria and possibly disrupt membrane function. Therefore, 3 was tested for its ability to depolarize the S. aureus membrane. An established assay was employed using DiSC3(5), a fluorescent dye that is sensitive to membrane potential.[29] Healthy bacterial cells have an inside negative membrane potential due to potassium efflux through leakage channels, as well as active proton efflux. The cationic dye DiSC3(5) inserts into the membranes of these healthy cells, where it is concentrated and becomes self quenched. Upon membrane depolarization, the dye is released into the extracellular solution and exhibits a marked increase in fluorescence intensity. The experimental data is provided in Figure 5. S. aureus cells (OD is 0.05) were suspended in a salt free buffer with DiSC3(5). NaCl (60 mM final) was added to the extracellular solution, followed by 3 (10 or 1 µg/mL). Sodium chloride itself does not affect the cells since it has essentially no permeability at the resting state of healthy bacteria. However, the addition of 3 (10 µg/mL) caused a rapid increase in fluorescence intensity of the dye. At the MIC concentration of 1 µg/mL, the DiSC3(5) fluorescence increase is smaller but still above background. Since zinc complex 3 is only weakly amphiphilic, it is remarkable that it can depolarize bacterial membranes at such a low concentration. The data does not allow an atomic level explanation of the membrane disruption caused by 3. However, we note that 3 is a densely charged, cationic molecule that targets the anionic phospholipid head groups in the bacterial membrane, a process that produces large fluctuations in local charge. Recently, high-level MD simulations of bilayer membranes have lead to the proposal of a field-induced pore model.[30] The simulations suggest that a localized charge imbalance, which would occur when several copies of 3 associate to a patch of bacterial membrane, can create a transmembrane electric field which induces a transient water pore, and as a consequence ion transport and membrane depolarization.
Figure 5.
Membrane depolarization of S. aureus cells induced by 3 at 10 µg/mL (■), 1 µg/mL (▲), and buffer control (●).
Although 3 is inactive against E. coli, it is still a promising antibiotic lead because it is easy to produce and highly active against S. aureus, a significant human pathogen that is responsible for many common nosocomial infections. Indeed, 3 may be a cheap alternative to vancomycin for treating clinical MRSA infection.[31] Furthermore, it is very hard for bacteria to become highly resistant against membrane active antibiotics. For example, S. aureus resistance to the membrane active biocide, Triclosan, which is employed extensively in many consumer products, only increases MICs to the range of 2–4 µg/mL.[32]
Conclusions
As shown in Scheme 1, the dinuclear zinc complex 2 is a synthetic anion receptor that associates strongly with phosphate and to a lesser extent carboxylate anions in aqueous solution. The lipophilic versions 5 and 6 are able to partition into the membranes of zwitterionic and anionic vesicles and induce the transport of phospholipids and hydrophilic anions (carboxyfluorescein). These lipophilic zinc complexes are moderately toxic to mammalian cells, and thus they are unlikely to be useful as cell-selective antibiotic drugs. However, the more hydrophilic zinc complex 3 selectively associates with anionic membranes. As a result it does not exhibit mammalian cell toxicity, but it is highly active against the Gram-positive bacterium S. aureus, including clinically important strains that are resistant to the antibiotics, vancomycin and oxacillin. The antibiotic action of 3 appears to be due to its ability to depolarize the bacterial cell membrane. The impressive bacterial staining ability of fluorescent conjugate 7 suggests that this family of zinc coordination complexes may be very useful as cell targeting probes for the detection and imaging of bacteria.
Experimental
Synthesis
The preparation of zinc complexes 3, 4, and 7 has been described previously.[14a,15,33] Zinc complexes 5 and 6 were prepared from the carboxylic acid form of tyrosine derivative, apo-4-COOH, using the following procedures.
Apo-4-COOH
To a round bottom flask was added 4, methanol, and an equal volume of aqueous 1 M NaOH solution. The reaction was stirred for 2 hours at room temperature, neutralized with 2 M HCl, and extracted into chloroform. The chloroform extracts were washed three times with an equal volume of water and brine. The combined organic layer was dried with Na2SO4 and evaporated to leave apo-4-COOH (85% yield) which was used without further purification.
Zinc complex 5
To a round bottom flask was added 500 mg of apo-4-COOH (1.0 molar eqiv.) and anhydrous DMF. To the solution was added 158 mg N,N’-dihexylamine (1.2 molar eqiv.), 136 mg EDC (1.0 molar eqiv.), 115 mg HOBt (1.2 molar eqiv.), and 0.20 ml triethylamine. The reaction was stirred for 24 hours at room temperature, then eavporated to yield a brown semi-solid which was resuspended in chloroform and washed three times with equal volumes of water followed by brine. The organic layer was then evaporated and purified on a silica gel column using 2% methanol in chloroform as eluent to give apo-5 as a pale yellow semi-solid in 88% yield. 1H NMR (300 MHz, CDCl3): δ 10.95 (1H, br), 8.48 (4H, d, J=5.1 Hz), 7.56 (4H, td, J=7.8, 1.6 Hz), 7.45 (4H, d, J=7.8 Hz), 7.08 (4H, m), 7.03 (2H, s), 5.35 (1H, d, J=9.0 Hz), 4.63 (1H, m), 3.80 (8H, s), 3.72 (4H, s), 3.15 (1H, m), 2.95 (1H, m), 2.84 (4H, m), 1.86 (4H, m), 1.33 (9H, s), 0.95–1.30 (12H, br), 0.69–0.88 (6H, m). 13C NMR (75 MHz, CDCl3): δ 171.5, 166.9, 159.2, 154.9, 148.8, 136.5, 130.4, 126.4, 124.0, 123.0, 121.9, 59.6, 54.7, 51.6, 47.8, 47.6, 46.2, 38.7, 31.5, 31.4, 31.2, 28.9, 28.3, 27.5, 26.6, 26.5, 26.3, 25.8, 22.5, 22.4, 14.0, 13.9. Single peak in HPLC-MS (reverse phase column; mobile phase gradient of 5% to 80% acetonitrile in 10 mM ammonium acetate over 10 minutes at 0.7 mL/min) with ES-MS m/z 872 [M + H]+. Subsequent treatment with two molar equivalents of Zn(NO3)2 in aqueous methanol, followed by evaporation gave the zinc complex 5 which was used without further purification.
Zinc complex 6
The above procedure was used to make apo-6 in 88% yield. 1H NMR (300 MHz, CDCl3): δ 10.95 (1H, br), 8.38 (4H, d, J=5.1 Hz), 7.49 (4H, td, J=8.0, 1.5 Hz), 7.36 (4H, d, J=7.8 Hz), 7.00 (4H, m), 6.93 (2H, s), 5.31 (1H, d, J=9.2 Hz), 4.58 (1H, m), 3.72 (8H, s), 3.64 (4H, s), 3.07 (1H, m), 2.88 (1H, m), 2.75 (4H, m), 1.69 (4H, m), 1.27 (9H, s), 0.95–1.26 (28H, br), 0.74 (6H, t, J=7.2 Hz). 13C NMR (75 MHz, CDCl3): δ 171.4, 166.9, 159.0, 154.8, 148.7, 136.5, 130.3, 126.2, 123.9, 122.9, 121.9, 59.5, 54.7, 47.9, 40.8, 31.7, 29.5, 29.4, 29.1, 29.0, 28.2, 27.5, 26.8, 26.5, 26.3, 22.5, 14.0. HPLC-MS: Single peak in the HPLC trace, ES-MS m/z 984 [M + H]+. Subsequent treatment with two molar equivalents of Zn(NO3)2 in aqueous methanol, followed by evaporation gave the zinc complex 6 which was used without further purification.
Vesicle Preparation
All phospholipids were purchased from Avanti Polar Lipids. An appropriate mixture of phospholipid was dried as a film in vacuo for 1 h. A stock solution of vesicles (10 mM phospholipid) was made by rehydration at room temperature with the appropriate buffer. Multilamellar vesicles were extruded to form unilamellar vesicles with a Basic LiposoFast device purchased from Avestin, Incorporated. The vesicles were extruded 29 times through a 19-mm polycarbonate Nucleopore filter with 100-nm diameter pores.
Phospholipid Translocation Assay
The 7-nitrobenz-2-oxa-1,3-diazol-4-yl (NBD)/dithionite assay has been described previously. Briefly, exo-labeled vesicles were prepared by slowly injecting a concentrated ethanolic solution of NBD-phospholipid into a stirring solution (35 mL) of vesicles (25 µM). An appropriate aliquot of the zinc complex in DMSO was added at 50 s, and translocation rates were determined from the subsequent change in % exo NBD-phospholipid over time. Every 15 min, a 3 mL sample was removed and treated with sodium dithionite solution (60 mM) and then Triton X-100 (final concentration of 0.5%). The % exo probe = (Fi – Ff)/Fi where Fi and Ff are the NBD-phospholipid fluorescence intensities just prior to the addition of dithionite and Triton X-100, respectively. Excitation was set at 470 nm, and fluorescence emission was measured at 530 nm using a 515 nm filter. The half-lives are the time periods to reach 80% exo probe and the values listed in Table 1 are the averages of 3 independent experiments.
Carboxyfluorescein Leakage Assay
Vesicles were prepared in the presence of rehydration buffer containing 5 mM TES, 100 mM NaCl, 50 mM carboxyfluorescein (CF) buffer (pH 7.4). Unencapsulated CF was separated from the vesicles by filtration through a Sephadex-G50 column in TES buffer or overnight dialysis (12–14000 MWCO tubing from Sigma-Aldrich) and a buffer containing 5 mM TES, 100 mM NaCl (pH 7.4) buffer. From this stock solution of vesicles, 3 mL samples were assayed for leakage (ex: 495 nm, em: 520 nm) upon the addition of an aliquot of zinc complex in DMSO at 50 s and Triton X-100 (20 µL of 20% v/v) at 750 s. The % CF release was calculated by the following equation:
Where Fi, Ft and Ff are the fluorescence intensities just prior to the additions of zinc complex and Triton X-100, and at the end of the experiment, respectively. All leakage experiments were reproduced at least three times.
Mammalian Cell Toxicity-MTT Assay
Jurkat and LNCaP cells were cultured in 75 mL tissue culture flasks using RPMI media with 10% fetal bovine serum (FBS). PC3 cells were cultured in 75 mL tissue culture flasks using Ham’s media with 10% FBS. All cells were grown at 37° C, 5% CO2 according to ATCC protocols.
MTT assays were run using the Vybrant MTT Cell Proliferation Assay Kit (Invitrogen, V-13154). A 200 µL mixture of cells (approximately 5 × 10⁴ cells/mL) in growth media were dispensed into each well of a 96-well plate and allowed to grow for 48 h. An aliquot of zinc complex in DMSO was administered to each well with serial 2-fold dilution. The wells were allowed to incubate for 24 h at 37° C, then the growth medium was changed and 10 µL of a 12 mM solution of [3-(4,5-dimethylthiazol-2-yl)-2,5-diphenyltetrazolium bromide] (MTT) in sterile PBS was added to each well. The cells were incubated at 37° C for 4 h then treated with 100 µL of an SDS-HCl solution to kill the cells, and dissolve the formazan product. The SDS-HCl solution was prepared by adding 10 mL of 0.01 M HCl to 1 g of SDS. The SDS-HCl/cell solution was then incubated for 24 h at 37° C, after which the absorbance of the cells was read at 570 nm. In order to determine the percentage of living cells in each sample the following equation was used:
Where Abs is the absorbance of the test well, AbsNeg is the absorbance of the negative control (no cells added) and AbsCon is the absorbance of the positive control (10 µL vehicle added to live cells). The listed LD50 values are the average of three independent experiments.
Minimum Inhibitory Concentration
The minimum inhibitory concentration (MIC) for 1 is reported as the lowest serial 2-fold dilution that prevented bacterial growth as outlined by the National Committee for Clinical Laboratory Standards (NCCLS). E. coli K12 cells were tested using a bacterial load of 5 × 10⁵ CFU/mL. Cells were grown at 37° C in 2 mL of Luria Bertani (LB) Miller media (10 g/L peptone, 5 g/L yeast extract, 10 g/L, NaCl) that were 2-fold serially diluted with zinc complex 3. S. aureus cells (listed in Table 1) were tested in similar fashion using regular Mueller Hinton II broth (300 g/L infusion from beef, 17.5 g/L casamino acids, 1.5 g/L bacto soluble starch) with the same microbial load. For S. aureus, the cells were grown in 96-well format using 100 µL of total media in each well. For both organisms, the MIC was taken as the lowest concentration that inhibited growth after 24 h as judged by visual turbidity. Each measurement of MIC was performed in triplicate.
Membrane Depolarization Studies
S. aureus cells were grown at 37° C in Luria Bertani (LB) Miller media to mid-log phase, centrifuged and the pellet washed once in 200 mM dextrose, 10 mM HEPES (pH = 7.5) buffer. The resulting suspension was centrifuged again and resuspended to an OD600 of 0.6 in the same buffer. A stock solution of dye was made by dissolving 1 mg of 3,3-dipropylthiadicarbocyanine iodide (DiSC3(5), Sigma-Aldrich) in 50 mL of DMSO in a foil protected falcon tube. Fluorescence emission from DiSC3(5) was detected at 670 nm using an excitation wavelength of 640 nm. A typical experiment began by adding 50 µL of dye solution to 3 mL of buffer in a disposable cuvette with continuous stirring throughout the experiment. Addition of the dye produced a sharp increase in fluorescence intensity which quickly leveled off. This baseline was taken as the initial fluorescence value, Io, for the data presented in Figure 5. Next, 300 µL of the S. aureus stock solution was added to give a final OD600 of 0.05. The fluorescence rapidly decreased and was allowed to stabilize and reach a new baseline, with an I/Io value of ~0.1). An aliquot of stock NaCl solution was added to give a 30 mM final concentration, followed by zinc complex 3 which produced a time-dependent increase in fluorescence intensity. The data (n=3) were analyzed in Microsoft Excel 2003 and the average plus standard error of the mean (SEM) plotted using the GraphPad Prism V 4.0.
Acknowledgements
This work was supported by the NIH (USA).
References
- 1.Choi S-K. Synthetic Multivalent Molecules, Concepts and Biomedical Applications. Hoboken: Wiley; 2004. [Google Scholar]
- 2.a) Howard GC, Kaser MR, editors. Making and Using Antibodies: A Practical Handbook. Boca Raton: CRC Press; 2006. [Google Scholar]; b) Mather SJ. Mol. Biosyst. 2007;3:30–35. doi: 10.1039/b611736h. [DOI] [PubMed] [Google Scholar]
- 3.Dübel S, editor. Handbook of Therapeutic Antibodies. Weinheim: Wiley-VCH; 2007. [Google Scholar]
- 4.a) Khandare JJ, Minko T. Crit. Rev. Therap. Drug Carriers. 2006;23:401–435. doi: 10.1615/critrevtherdrugcarriersyst.v23.i5.20. [DOI] [PubMed] [Google Scholar]; b) Jaracz S, Chen J, Kuznetsova LV, Ojima I. Bioorg. Med. Chem. 2005;13:5043–5054. doi: 10.1016/j.bmc.2005.04.084. [DOI] [PubMed] [Google Scholar]
- 5.a) Tew GN, Clements D, Tang H, Arnt H, Scott RW. Biochim. Biophys. Acta. 2006;1758:1387–1392. doi: 10.1016/j.bbamem.2006.03.001. [DOI] [PubMed] [Google Scholar]; b) Epand RF, Schmitt MA, Gellman SH, Epand RM. Biochim. Biophys. Acta. 2006;1758:1343–1350. doi: 10.1016/j.bbamem.2006.01.018. [DOI] [PubMed] [Google Scholar]; c) Rausch JM, Marks JR, Wimley WC. Proc. Natl. Acad. Sci. USA. 2005;102:10511–10515. doi: 10.1073/pnas.0502013102. [DOI] [PMC free article] [PubMed] [Google Scholar]; d) Odds FC, Brown AJP, Gow NAR. Trends Microbiol. 2003;11:272–279. doi: 10.1016/s0966-842x(03)00117-3. [DOI] [PubMed] [Google Scholar]
- 6.Leevy WM, Serazin N, Smith BD. Drug Discovery Today: Disease Models. doi: 10.1016/j.ddmod.2007.07.001. doi: 10.1016/j.ddmod.2007.07.001. [DOI] [PMC free article] [PubMed] [Google Scholar]
- 7.Boon JM, Smith BD. Med. Res. Rev. 2002;22:251–281. doi: 10.1002/med.10009. [DOI] [PubMed] [Google Scholar]
- 8.Ratledge C, Wilkinson SG. Microbial Lipids. Vol 1. San Diego: Harcourt Brace Jovanovich; 1988. [Google Scholar]
- 9.a) Giuliani A, Pirri G, Nicoletto SF. Central Euro. J. Biol. 2007;2:1–33. [Google Scholar]; b) Lowik DWPW, van Hest JCM. Chem. Soc. Rev. 2004;33:234–245. doi: 10.1039/b212638a. [DOI] [PubMed] [Google Scholar]; c) Jelinek R, Kolusheva S. Curr. Prot. Pept. Sci. 2005;6:103–114. doi: 10.2174/1389203053027511. [DOI] [PubMed] [Google Scholar]
- 10.a) Lambert TN, Smith BD. Coord. Chem. Rev. 2003;240:129–141. [Google Scholar]; b) Lakshmi C, Hanshaw RG, Smith BD. Tetrahedron. 2004;60:11307–11315. [Google Scholar]; c) Hanshaw RG, Smith BD. Bioorg. Med. Chem. 2005;13:5035–5042. doi: 10.1016/j.bmc.2005.04.071. [DOI] [PubMed] [Google Scholar]
- 11.a) O’Neil EJ, Smith BD. Coord. Chem. Rev. 2006;250:3068–3080. [Google Scholar]; b) Ojida A, Inoue M, Mito-oka Y, Hamachi I. J. Am. Chem. Soc. 2003;125:10184–10185. doi: 10.1021/ja036317r. [DOI] [PubMed] [Google Scholar]; c) Ojida A, Mito-oka Y, Sada K, Hamachi I. J. Am. Chem. Soc. 2004;126:2456–2463. doi: 10.1021/ja038277x. [DOI] [PubMed] [Google Scholar]; d) Aoki S, Kimura E. Chem. Rev. 2004;102:769–788. doi: 10.1021/cr020617u. [DOI] [PubMed] [Google Scholar]; e) Ojida A, Mito-oka Y, Inoue M, Hamachi I. J. Am. Chem. Soc. 2002;124:6256–6258. doi: 10.1021/ja025761b. [DOI] [PubMed] [Google Scholar]; f) Molenveld P, Engbersen JFJ, Reindoudt DV. Chem. Soc. Rev. 2000;29:75–86. [Google Scholar]
- 12.Leevy WM, Johnson JR, Lakshmi C, Morris JD, Marquez M, Smith BD. Chem. Commun. 2006;15:1595–1597. doi: 10.1039/b517519d. [DOI] [PubMed] [Google Scholar]
- 13.(a) Leevy WM, Gammon ST, Jiang H, Johnson JR, Maxwell DJ, Jackson EN, Marquez M, Piwnica-Worms D, Smith BD. J. Am. Chem. Soc. 2006;128:16476–16477. doi: 10.1021/ja0665592. [DOI] [PMC free article] [PubMed] [Google Scholar]; b) Johnson JR, Fu N, Arunkumar E, Leevy WM, Gammon ST, Piwnica-Worms D, Smith BD. Angew. Chem. Int. Ed. 2007;46:5528–5531. doi: 10.1002/anie.200701491. [DOI] [PMC free article] [PubMed] [Google Scholar]
- 14.a) Han MS, Kim DH. Angew. Chem. Int. Ed. 2002;41:3809–3811. doi: 10.1002/1521-3773(20021018)41:20<3809::AID-ANIE3809>3.0.CO;2-N. [DOI] [PubMed] [Google Scholar]; b) Lee DH, Im JH, Son SK, Chung YK, Hong J. J. Am. Chem. Soc. 2003;125:7752–7753. doi: 10.1021/ja034689u. [DOI] [PubMed] [Google Scholar]; c) Lee DH, Kim SY, Hong J. Angew. Chem. Int. Ed. 2004;43:4777–4780. doi: 10.1002/anie.200453914. [DOI] [PubMed] [Google Scholar]; d) Hanshaw RG, Hilkert S, Jiang H, Smith BD. Tetrahedron Lett. 2004;45:8721–8724. [Google Scholar]
- 15.Jiang H, O’Neil EJ, DiVittorio KM, Smith BD. Org. Lett. 2005;7:3013–3017. doi: 10.1021/ol0510421. [DOI] [PubMed] [Google Scholar]
- 16.a) Honda K, Fujishima S-H, Ojida A, Hamachi I. ChemBioChem. 2007;8:1370–1372. doi: 10.1002/cbic.200700146. [DOI] [PubMed] [Google Scholar]; b) Ojida A, Honda K, Shinmi D, Kiyonaka S, Mori Y, Hamachi I. J. Am. Chem. Soc. 2006;128:10452–10459. doi: 10.1021/ja0618604. [DOI] [PubMed] [Google Scholar]; c) Honda K, Ojida A, Hamachi I. Chem. Comm. 2006:4024–4026. doi: 10.1039/b608684e. [DOI] [PubMed] [Google Scholar]
- 17.Sasaki Y, Shukla R, Smith BD. Org. Biomol. Chem. 2004;2:214–219. doi: 10.1039/b314006g. [DOI] [PubMed] [Google Scholar]
- 18.The structure and stoichiometry of anion coordination to these zinc complexes will be described in a future publication.
- 19.Smith BD, Lambert TN. Chem. Comm. 2003:2261–2268. doi: 10.1039/b303359g. [DOI] [PubMed] [Google Scholar]
- 20.a) Smith BD, Davis AP, Shephard D. Chem. Soc. Rev. 2007;36:348–357. doi: 10.1039/b512651g. [DOI] [PMC free article] [PubMed] [Google Scholar]; b) McNally BA, Leevy WM, Smith BD. Supramol. Chem. 2007;19:29–37. doi: 10.1080/10610270600902332. [DOI] [PMC free article] [PubMed] [Google Scholar]
- 21.Gao J, Liu Y-G, Zhou Y, Boxer LM, Woolley FR, Zingaro RA. ChemBioChem. 2007;8:332–340. doi: 10.1002/cbic.200600299. [DOI] [PubMed] [Google Scholar]
- 22.Goehring NW, Beckwith J. Curr. Biol. 2005;15:R514–R526. doi: 10.1016/j.cub.2005.06.038. [DOI] [PubMed] [Google Scholar]
- 23.Pinho MG, Errington J. FEMS Microbiol. Lett. 2004;240:145–149. doi: 10.1016/j.femsle.2004.09.038. [DOI] [PubMed] [Google Scholar]
- 24.a) Tiyanont K, Doan T, Lazarus MB, Fang X, Rudner DZ, Walker S. Proc. Natl. Acad. Sci. USA. 2006;103:11033–11038. doi: 10.1073/pnas.0600829103. [DOI] [PMC free article] [PubMed] [Google Scholar]; b) Glukhov E, Stark M, Burrows LL, Deber CM. J. Biol. Chem. 2005;280:33960–33967. doi: 10.1074/jbc.M507042200. [DOI] [PubMed] [Google Scholar]; c) Disney MW, Zheng J, Swager TM, Seeberger PH. J. Am. Chem. Soc. 2004;126:13343–13346. doi: 10.1021/ja047936i. [DOI] [PubMed] [Google Scholar]
- 25.National Committee for Clinical Laboratory Standards. Methods for Dilution Antimicrobial Susceptibility Tests for Bacteria that grow Aerobically. 5th edn. Wayne, Pennsylvania: NCCLS; 2000. M7-A5. [Google Scholar]
- 26.Al-Masaudi SB, Day MJ, Russel AD. J. Appl. Bacteriol. 1988;65:329–337. doi: 10.1111/j.1365-2672.1988.tb01899.x. [DOI] [PubMed] [Google Scholar]
- 27.Rayner MH, Sadler PJ. FEMS Microbiol. Lett. 1990;71:253–258. doi: 10.1111/j.1574-6968.1990.tb04152.x. [DOI] [PubMed] [Google Scholar]
- 28.Kruppa M, Burkhard B. Chem. Rev. 2006;106:3520–3560. doi: 10.1021/cr010206y. [DOI] [PubMed] [Google Scholar]
- 29.Arnt L, Rennie JR, Linser S, Willumeit R, Tew GN. J. Phys. Chem. 2006;110 doi: 10.1021/jp054339p. 3527-3523. [DOI] [PubMed] [Google Scholar]
- 30.Gurtovenko AA, Vattulainen L. J. Am. Chem. Soc. 2005;127:17570–17571. doi: 10.1021/ja053129n. [DOI] [PubMed] [Google Scholar]
- 31.Zafar AB, Butler RC, Reese DJ, Gaydos LA, Menonna PA. Amer. J. Infect. Control. 1995;23:200–208. doi: 10.1016/0196-6553(95)90042-x. [DOI] [PubMed] [Google Scholar]
- 32.Suller MTE, Russell AD. J. Antimicro. Chemo. 2000;46:11–18. doi: 10.1093/jac/46.1.11. [DOI] [PubMed] [Google Scholar]
- 33.Torelli S, Belle C, Gautier-Luneau I, Pierre JC. Inorg. Chem. 2003;39:3526–3536. doi: 10.1021/ic991450z. [DOI] [PubMed] [Google Scholar]


