Abstract
Magnetic resonance elastography (MRE) is a noninvasive imaging technique capable of quantifying and spatially resolving the shear stiffness of soft tissues by visualization of synchronized mechanical wave displacement fields. However, MRE inversions generally assume that the measured tissue motion consists primarily of shear waves propagating in a uniform, infinite medium. This assumption is not valid in organs such as the heart, eye, bladder, skin, fascia, bone and spinal cord in which the shear wavelength approaches the geometric dimensions of the object. The aim of this study was to develop and test mathematical inversion algorithms capable of resolving shear stiffness from displacement maps of flexural waves propagating in bounded media such as beams, plates and spherical shells using geometry-specific equations of motion. MRE and finite element modeling (FEM) of beam, plate, and spherical shell phantoms of various geometries were performed. Mechanical testing of the phantoms agreed with the stiffness values obtained from FEM and MRE data and a linear correlation of r2 ≥ 0.99 was observed between the stiffness values obtained using MRE and FEM data. In conclusion, we have demonstrated new inversion methods for calculating shear stiffness that may be more appropriate for waves propagating in bounded media.
Keywords: MRE Inversions, Bounded media, MRE
Introduction
It is generally appreciated that the intrinsic mechanical properties of soft tissues provide insight into a variety of disease processes including liver fibrosis (1), breast lesions (2), myocardial infarction (3), hypertension (4), diastolic dysfunction (5), arterial stiffness (6), and muscle function (7). While in clinical practice the assessment of tissue stiffness using palpation has proven effective, this technique is limited due to its superficial and subjective nature. As such, there exists a continuing need for the improved noninvasive detection, assessment, and quantification of tissue mechanical properties.
In response to the need for improved methods of assessment of tissue elasticity, several imaging based approaches have been developed. Techniques such as ultrasound elastography based on cross-correlation analysis (8), transient elastography (9), as well as magnetic resonance elastography (MRE) (10–13) are capable of quantifying the stiffness of soft tissues noninvasively and are based on imaging tissue response to intrinsic or extrinsic motion sources. A drawback of ultrasound-based techniques is that they are limited to imaging within a given acoustic window, cannot measure the full 3D displacement of the tissue, and provide only a global measure of stiffness. MRE (14,15) on the other hand, is a MRI-based, phase-contrast imaging technique that is capable of producing images of the shear modulus distribution within tissue. By synchronizing motion-encoding gradients (MEG) in the MR pulse sequence with externally applied motion, the full 3D tissue displacement field can be encoded into the phase of the MR image. These wave images are then processed using a so-called inversion algorithm to obtain spatially resolved shear stiffness maps.
Existing MRE-based methods for calculating the shear modulus generally assume that the measured tissue motion consists primarily of shear waves propagating in a uniform, infinite medium (15). However, this assumption is not valid in many organs, such as the heart, eye, spinal cord, bone and bladder, where the shear wavelength can be of the order of the dimensions of the organ. Although, finite element methods have been proposed for inverting MRE wave displacements (16) and optical coherence tomography images (17) that include geometric effects in the inversions, these techniques are computationally very intensive. Therefore, a more efficient inversion analysis that takes into account the geometric and boundary conditions is required.
The purpose of this work is to demonstrate new MRE inversion techniques for estimating shear modulus that from waves propagating in bounded media such as beams, plates and spherical shells, using geometry-specific equations of motion.
Theory
In order to apply MRE-based methods for resolving the shear modulus of organs, in which geometric considerations must be taken into account, three separate models are considered. In this work, the models considered are thin beams, plates and spherical shells. The appropriate geometric conditions, mathematical descriptions of wave propagation, and method of calculating shear modulus for each model is described.
Beam Inversion
Beams can respond not only to longitudinal but also to transverse vibrations. In an elastic beam whose length is greater than its thickness, these vibrations give rise to flexural waves (i.e., the wavelength of the vibrations is greater than the thickness of the beam). The basic hypothesis (from the Bernoulli-Euler theory of beams) involved in deriving the equations of motion is that cross-sectional planes initially perpendicular to the axis of a uniform, homogenous, isotropic beam remain planar and perpendicular to the neutral axis during bending (18). When the forces and moments acting on a small differential element experiencing these flexural vibrations are balanced, the result gives rise to Eq.1 (18), where I = moment of inertia, E = Young’s modulus of the material, x = distance along the length of the beam, w = displacement in the transverse direction, S = cross-sectional area of the beam, ρ = density of the material (assumed to 1000 kg/m3) and ω = rotational frequency.
| (1) |
MRE can be used to determine the mechanical properties of a beam by encoding the transverse component of displacement (w), which is input to Eq.1 to determine E. E is then converted to shear modulus (μ) using the relationship μ = E/2(1+ν), where ν = Poisson’s ratio.
Plate Inversion
Thin plates are a 2D extension of thin beams. As with the beam analysis, the analysis of flexural motion in a uniform, homogenous, isotropic plate adheres to the Bernoulli-Euler theory and is obtained by balancing the forces and moments on all sides of a small differential element. The resulting equation of motion is shown in Eq. 2 (19), where h = thickness of the plate, ρ = density of the material (assumed to 1000 kg/m3), w = transverse displacement in the direction of the plate thickness, x and y = in-plane directions perpendicular to w, and D = bending stiffness of the plate, which is related to Young’s modulus (E) by Eq. 3. This equation fails when thickness exceeds λs/20, where λs is the shear wavelength.
| (2) |
| (3) |
To assess the mechanical properties of a plate, MRE can be used to encode the through-plane component of displacement (w), which is input to Eq. 2. E is calculated from D, which is converted to the shear modulus (μ) using the relationship μ = E/2(1+ν).
Spherical Shell Inversion
The vibrations of a spherical shell include flexural effects that result in wave propagation guided by the boundary conditions of the sphere. The equations of motion can be obtained by applying Hamilton’s variational principle (18) and by assuming mid surface deflections and nontorsional axisymmetric motions. Other assumptions made during the derivation of the equation of motion include; 1) the displacement of the shell is small in comparison to its thickness, 2) the thickness of the shell is small compared with the smallest radius of curvature, 3) “fibers” or elements of the shell initially perpendicular to the middle surface remain so after deformation and are themselves not subject to elongation, and 4) the normal stress acting on planes parallel to the shell middle surface is negligible in comparison with other stresses. Expressed in the polar coordinate system, the flexural motion is described by Eq. 4 (18), where a = shell inner radius, u = circumferential component of displacement, w = radial component of displacement, cp = flexural plate speed (cp2 = E/(1−ν2)ρ), E = Young’s modulus, ρ = density (assumed to be 1000 kg/m3), ν = Poisson’s ratio, β = h2/12a2, h = thickness of the shell, θ = angular position around the shell, double dots above a variable indicate differentiation with respect to time, and pa = applied load. If the circumferential and radial displacements are known, Eq. 4 can be solved for E. The shear modulus (i.e. shear stiffness or stiffness) of the material can then be calculated according to the relationship μ = E/ 2(1+ν).
| (4) |
In this application, MRE techniques can be used to quantify the in-plane Cartesian components of displacement, which can be converted to circumferential and radial components of the displacement for use in Eq. 4.
Methods
Experimental Setup
To investigate the ability of MRE to determine the intrinsic mechanical properties of materials in the presence of significant geometric effects, several phantom experiments were performed to test the above equations of motion in beams, plates, and spherical shells.
Beam MRE
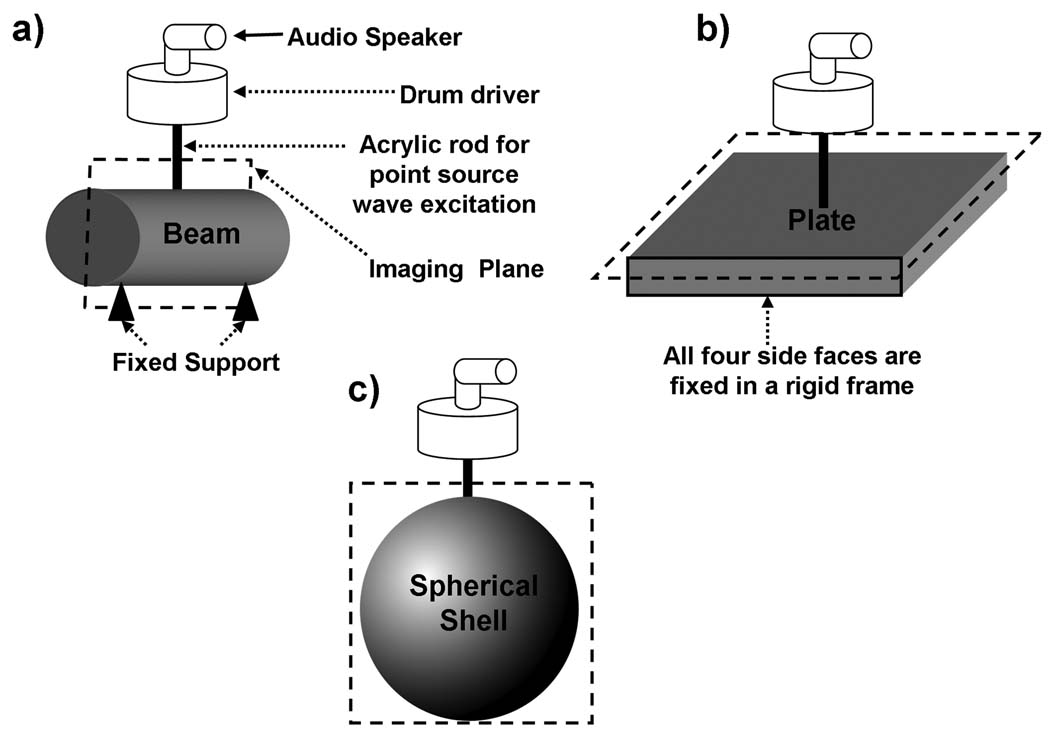
Three cylindrical beams of diameters 2.25 cm, 2.5 cm, and 3.7 cm and lengths of 16.3 cm, 16.7 cm and 18.5 cm, respectively, and Poisson’s ratio of 0.49 (20) (obtained from a mechanical pull test performed using a servo hydraulic MTS testing machine (Model 810, MTS testing system, Eden Prairie, MN)) were constructed with silicone rubber (Wirosil, BEGO, Germany). As shown in figure 1(a), the beams were supported and fixed at the ends and a pneumatic driver was used to produce vertical displacements at the center of the beam.
Figure 1.
Schematic diagrams of the experimental models and the driver locations for inducing mechanical motion in each type of phantom with imaging plane shown in dashed line.
Plate MRE
Two plates 1 cm thick × 17.0 cm length × 17.0 cm breadth and 2 cm thick × 17.0 cm length × 17.0 cm breadth and Poisson’s ratio of 0.49 (20) (obtained from a mechanical pull test performed using servo hydraulic MTS testing machine (Model 810, MTS testing system, Eden Prairie, MN)) were constructed with silicone rubber (Wirosil, BEGO, Germany). As shown in figure 1(b), the plates were placed in a rigid frame with the top and bottom surfaces open to generate fixed boundary conditions at the edges. The phantom and the frame were then rigidly mounted in the scanner 1 cm above the surface of the scanner table and a pneumatic driver was used to produce vertical displacements at the center of the plate.
Spherical Shell MRE
Two spherical shells of 10 cm diameter, thicknesses of 1 cm and 1.5 cm, and Poisson’s ratio of 0.45 (20) (obtained from a mechanical pull test performed using servo hydraulic MTS testing machine (Model 810, MTS testing system, Eden Prairie, MN)) were constructed with silicone rubber (Wirosil, BEGO, Germany). The mixing ratios of the two components of the rubber were adjusted to make a softer rubber than was used for the beams and plates for easier construction of the spherical shell. A pneumatic driver was used to produce vertical displacements at the top of the shell as shown in the figure 1(c). The shell was placed on a flat surface in the MR scanner for data acquisition.
Image Acquisition
All imaging was performed on a 1.5 Tesla MRI scanner (Signa, GE Health Care, Milwaukee, WI). A standard gradient-recalled echo (GRE) MRE sequence equipped with first-order gradient moment nulled MEG was used to image induced displacements within the beams, plates and shells.
Beam MRE
Data acquisition was performed on the three beams at three different frequencies of excitation (200 Hz, 250 Hz, and 300 Hz). Additional GRE MRE imaging parameters included TR: 150 ms, TE: 15.7 ms (200 Hz), 14.7 ms (250 Hz) and 14.6 ms (300 Hz), slice thickness: 10 mm, FOV: 18 cm for the 2.25 cm and 2.5 cm beams, 20 cm for the 3.7 cm beam, acquisition matrix: 256×64, flip angle: 30°, receiver bandwidth: 15.63 kHz, and imaging plane: axial (shown in figure 1(a) as a dotted line). MEG durations of 5 ms (200 Hz), 4 ms (250 Hz), and 3.33 ms (300 Hz) were applied to encode the 200 Hz, 250 Hz and 300 Hz motion, respectively.
Plate MRE
For each plate external motion at 60 Hz, 75 Hz and 100 Hz was applied. GRE MRE imaging parameters were the same as for the beam acquisitions except for TE: 27.7 ms (60 Hz), 24.3 ms (75 Hz) and 21 ms (100 Hz), FOV: 20 cm, MEG durations of 16.67 ms (60 Hz), 13.33 ms (75 Hz), and 10 ms (100 Hz), and imaging plane: coronal (shown in figure 1(b) with dotted line).
Spherical Shell MRE
The two spherical shells were vibrated each at a frequency of 200 Hz. The in-plane components of displacement were encoded using the GRE MRE sequence with 5 ms duration MEG. The imaging parameters were the same as for the plates and beams except for TE: 15 ms, FOV: 14 cm, and imaging plane: axial (shown in figure 1(c) as the dotted line).
Finite Element Modeling
Finite element modeling (FEM) was performed to validate the inversion equations in beams, plates and spherical shells and to compare the stiffness estimates from FEM to those from the MRE experiments. All FEM was performed in beams, plates and spherical shells using COMSOL Multiphysics (3.4v, COMSOL AB, Stockholm, Sweden). A 3D frequency-response analysis with a quadratic discretization consisting of the degrees of freedom and number of mesh elements tabulated in Table 1 was performed on beams, plates and shells assuming a homogeneous, isotropic material with Poisson’s ratio of 0.49 for beams and plates and 0.45 for shells, density of 1000 kg/m3, and Young’s modulus ranging from 210–600 kPa as described below. This yields complex valued displacements at every point on the grid. The frequency-response equation for solving the FE models is given in Eq.5 (21), which was based on principle of virtual work and Newton’s equation of motion, where ω = rotational frequency, ρ = density, η = loss factor (assumed to be 0.05), c = stiffness tensor and u = displacement vector. When the loss factor in Eq. 5 approaches zero, the equation deduces to Helmholtz’s wave equation.
| (5) |
Table: 1.
Mesh statistics including mesh type and number of points, elements and degrees of freedom used in FEM for each model.
| FEM Mesh Statistics | ||||
|---|---|---|---|---|
| Model | Mesh Type | # Points | # Elements | # Degrees of freedom |
| Beam: 2.25 cm Dia | Tetrahedral | 1528 | 64344 | 278400 |
| Beam: 2.5 cm Dia | Tetrahedral | 1543 | 66423 | 287022 |
| Beam: 3.7 cm Dia | Tetrahedral | 429 | 51970 | 224310 |
| Plate: 1 cm Thick | Tetrahedral | 2492 | 29382 | 136803 |
| Plate: 2 cm Thick | Tetrahedral | 590 | 66710 | 294705 |
| Shell: 1 cm Thick | Tetrahedral | 1068 | 29994 | 142041 |
| Shell: 1.5 cm Thick | Tetrahedral | 1412 | 56911 | 255501 |
Beam FEM
A 3D FEM was developed of each of the three beams with the same dimensions as the constructed beams described in the MRE experimental setup. A frequency-response analysis was performed at frequencies of 200 Hz, 250 Hz, and 300 Hz using E = 429 kPa (obtained from mechanical testing described following). Additional simulations were performed with the Young’s modulus for the 2.5 cm diameter beam set to several values including 210 kPa, 300 kPa, 390 kPa, 510 kPa, and 600 kPa. A frequency-response analysis was performed at 200 Hz in each case to compare the stiffness estimates provided in the FEM to those obtained by inverting Eq. 1. For all models, the ends of the beams were fixed to match the experimental setup.
Plate FEM
A 3D FEM of plates was performed using the same dimensions as the constructed plates described in the MRE experimental setup. A frequency-response analysis was performed at frequencies of 60 Hz, 75 Hz, and 100 Hz with E = 429 kPa (obtained from mechanical testing described following) and with the edges of the plates fixed. Additional simulations were performed with the Young’s modulus for the 2 cm thick plate set to several values including 210 kPa, 300 kPa, 429 kPa, 525 kPa, and 600 kPa. A frequency-response analysis was performed at 75 Hz to compare the true stiffness estimates provided in the FEM to those obtained by inverting Eq. 2.
Spherical Shell FEM
A 3D FEM for each spherical shell was performed using the same dimensions as the constructed shells described in the MRE experimental setup. A frequency-response analysis was performed at frequencies of 200 Hz, 250 Hz, and 300 Hz with E = 210 kPa. Additional simulations were performed with the Young’s modulus for the shell of 1 cm thickness and 5 cm radius set to several values including 210 kPa, 300 kPa, 390 kPa, 510 kPa, and 600 kPa. A frequency-response analysis was performed at 200 Hz to compare the true stiffness estimates provided in the FEM to those obtained by inverting Eq. 4. Furthermore, a frequency response analysis at 200 Hz was performed on shells with 5 cm radius and varying thickness from 0.75 to 4.5 cm (in increments of 0.25 cm up to 1 cm thickness, then in increments of 0.5 cm thereafter) and E = 150 kPa, 300 kPa and 450 kPa to determine the effect on the stiffness estimates as the radius-to-thickness ratio is changed.
Mechanical Testing
A 3-point bending test was performed on the 2.5 cm diameter beam used for the MRE experiments using a servo hydraulic MTS testing machine (Model 810, MTS testing system, Eden Prairie, MN). The beam was supported at both ends and the loading was applied at the center of the beam. The sample was deformed with a known load (i.e., force) at the rate of 10 mm/min until the beam was visibly deformed. The displacement due to the deforming force was recorded. The slope of force versus displacement (i.e., F/D) was calculated and input into Eq. 6 (22) to obtain the stiffness of the material, where F = applied force (N), L = distance between the two supports (m), r = radius of the beam, D = displacement (m), and E = Young’s modulus of the material. Once E is determined from Eq. 6 the shear modulus can be calculated using the relationship μ = E/2(1+ν).
| (6) |
Image Analysis
MRE and FEM provide Cartesian displacements within the beams, plates and shells, which are then input to Eq. 1, Eq. 2, and Eq. 4, respectively. Because these displacements are spatially resolved, they also provide stiffness maps of the object under investigation. For the shells, the Cartesian displacements were first converted to radial and circumferential components of displacements using a polar coordinate transformation. The load pa, which describes the externally applied vibration of the shell was modeled as a Gaussian function with a standard deviation of 0.005 radians and a pressure amplitude of 105 Pa. Derivative estimates of the displacement data were performed using Savitzky-Golay filters (23–25) with filter size equal to 0.67 times the wavelength and an order of 3. To demonstrate the biases that can arise when analyzing displacement data in bounded media using algorithms which assume an unbounded geometry, 2 dimensional phase gradient (PG), local frequency estimation (LFE), and direct inversion (DI) (15) inversions on the MRE data from beams, plates and shells were also performed and compared to the results from Eq. 1, Eq. 2 and Eq. 4. As part of the PG, LFE, and DI inversions, directional filtering (26) was performed in 8 directions with a Butterworth bandpass radial filter (cutoff frequencies of 2–40 cycles/FOV). The PG and DI inversions were performed on each directionally filtered dataset using 5×5 and 11×11 local windows respectively.
Noise Analysis
Noise was added to the FEM displacements obtained for the beams, plates and shells to investigate the robustness of the inversions. Gaussian white noise with a standard deviation of 1–25% of the displacement amplitude was added to the transverse component of displacement for one of the beam models (2.5 cm diameter, frequency = 200 Hz, and E = 429 kPa) and to the through-plane direction for one of the plate models (2 cm thick, frequency = 75 Hz, and E = 429 kPa). Noise with a standard deviation of 1–25% of the displacement amplitude was added to the radial and circumferential components of motion for one of the spherical shell models (5 cm radius and 1 cm thick, frequency = 200 Hz, and E=210 kPa). For each model and each noise level, the displacement data were input to their respective inversion equations and the mean and variance of the stiffness maps were recorded to determine the sensitivity of the stiffness estimates to noise.
Statistical Analysis
Stiffness estimates obtained from the inversion equations for the beams, plates and shells were validated against estimates obtained from FEM data. To determine any statistically significant difference in the MRE and FEM stiffness estimates, a least-squares linear regression was performed using the stiffness estimates, which were input to the FEM and those obtained from the MRE inversion equations.
Results
Mechanical Testing
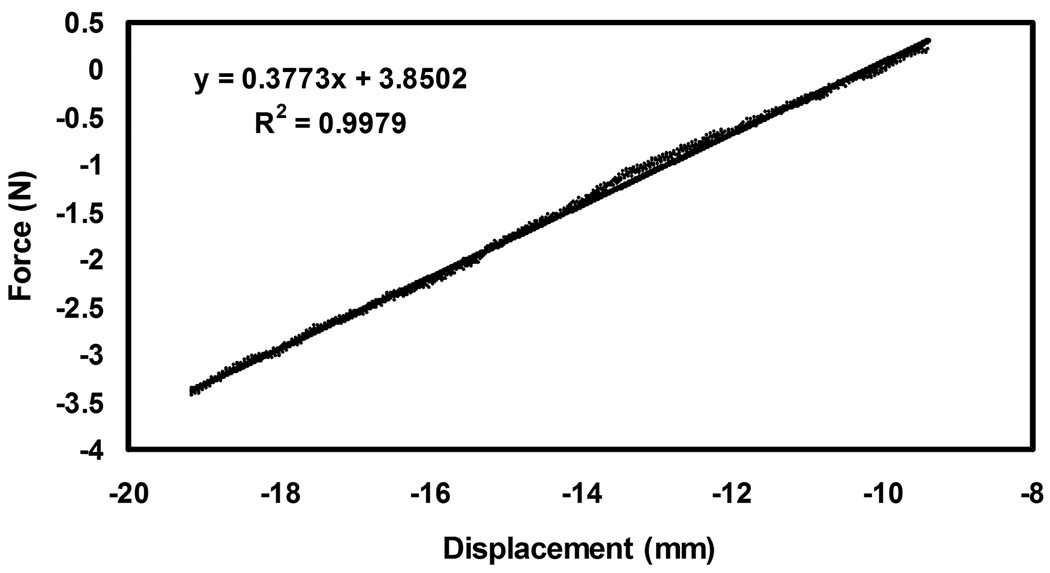
Figure 2 shows the plot of force versus displacement obtained from the 3-point bending experiment performed on a beam of 2.5 cm diameter. The slope was provided as an input to Eq. 6 to determine that the shear stiffness of the beam was 143 kPa.
Figure 2.
Force versus displacement data obtained from the 3-point bending experiment. The slope of this fit was used to calculate stiffness using Eq.6.
Beams
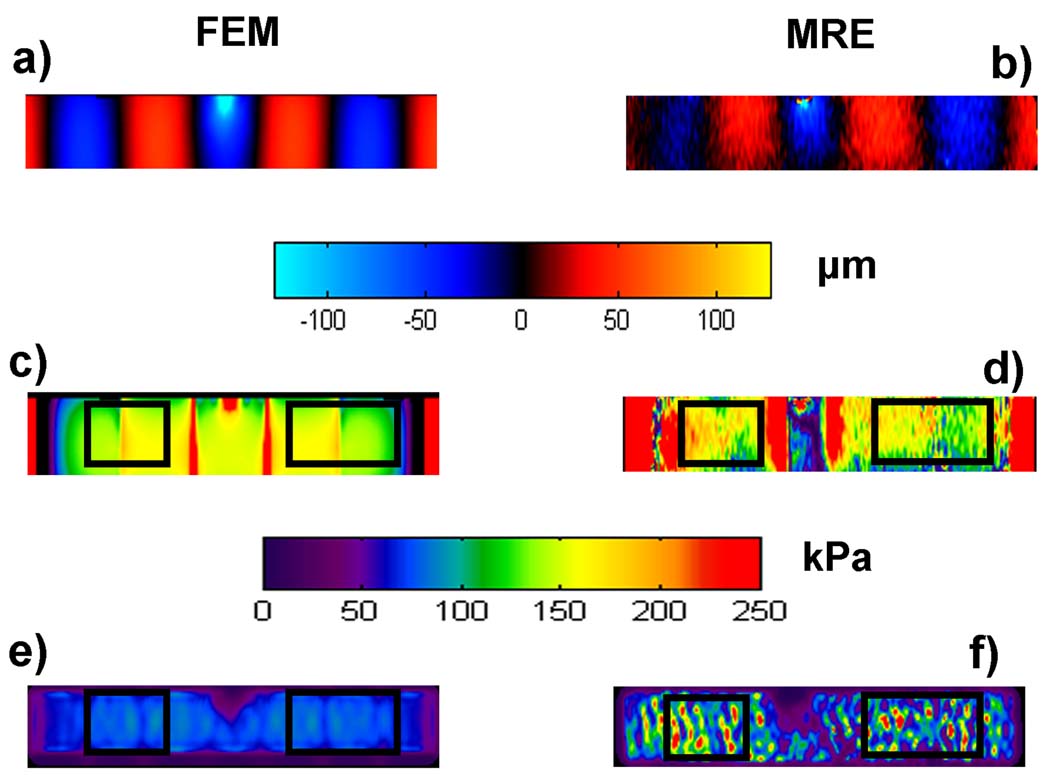
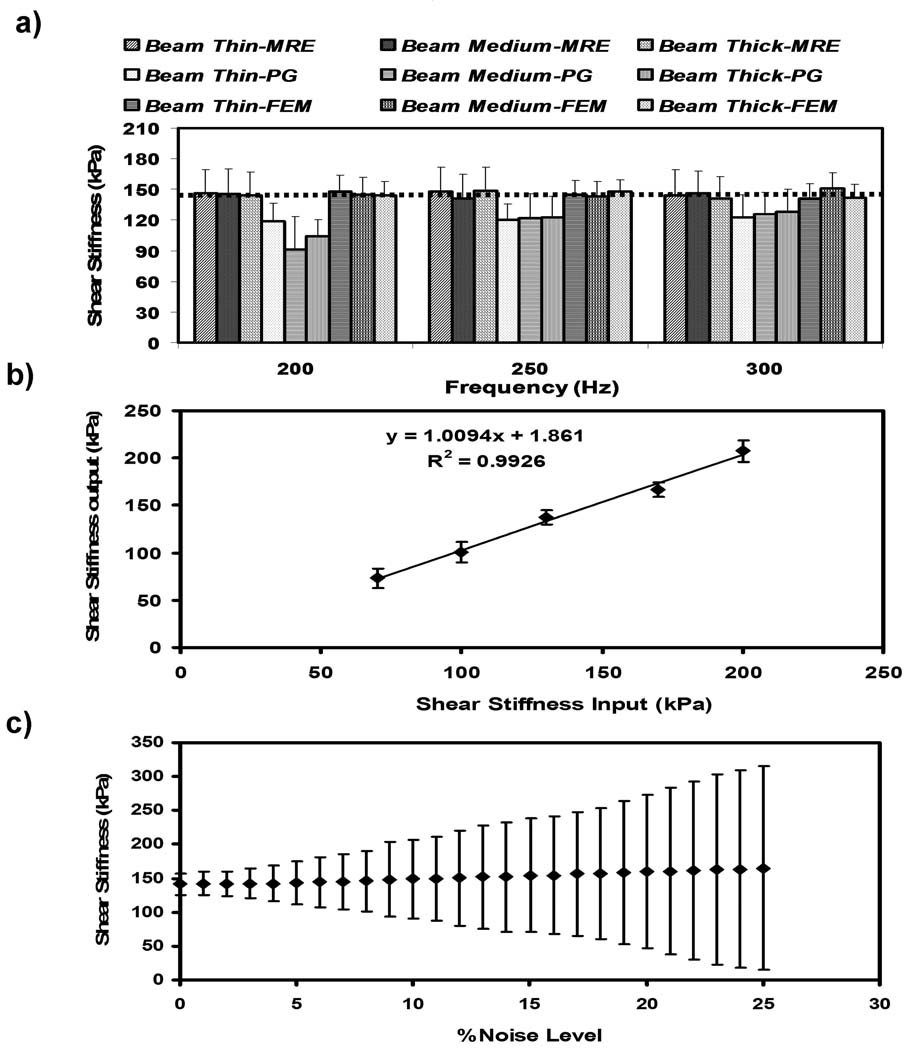
Figure 3(a,b) show the transverse component of displacement at one time point in the wave cycle obtained from FEM and MRE, respectively, for a 2.5 cm diameter beam vibrated at a frequency of 200 Hz. In the FEM, the shear modulus was assumed to be 143 kPa, the result obtained from the mechanical testing. The corresponding stiffness maps obtained using Eq. 1 and using a phase gradient (PG) inversion algorithm (15) are shown in figure 3(c,d) and figure 2(e,f) respectively. The mean MRE stiffness values obtained from the regions of interest (ROIs) shown in black using Eq. 1 and the PG algorithm were 145.9±24 kPa and 91.3±31 kPa, respectively. The results for the FEM were 141.2±16.2 kPa using Eq. 1 and 84.1±7 kPa using the PG inversion algorithm. Similarly, the mean MRE stiffness values obtained using LFE and DI were 76.7±13.7 kPa, and 81.2±22.1 kPa respectively. And the mean FEM stiffness values obtained using LFE and DI were 74.2±12.4 kPa, 72.6±8.9 kPa respectively. Figure 4(a) shows the stiffness values obtained from the MRE experimental data and from the FEM simulation data using Eq. 1, and the values obtained from the MRE data processed with the PG method, for different sized beams at different frequencies. Only the PG results are shown because the LFE and DI results behaved similarly. The expected shear stiffness for the FEM data was 143 kPa and from the figure it can be seen that the beam inversion produced precise stiffness estimates, whereas the other unbounded inversions such as PG, LFE and DI methods were biased, underestimating the stiffness measurements in all three beams and at all three frequencies. However, PG, LFE and DI estimates of stiffness improved as the shear wavelength decreased with increasing frequency and beam diameter. Figure 4(b) shows a plot of the shear stiffness values provided as an input to the FEM compared to the stiffness estimates obtained from Eq.1 for a beam of 2.5 cm diameter. A linear correlation coefficient (R2) of 0.99 was determined between the input stiffness values and the stiffness estimates obtained by solving Eq. 1. Figure 4(c) shows the variation in stiffness measurements obtained using Eq.1 with the amount of noise added for the 2.5 cm diameter beam at a frequency of 200 Hz. The mean stiffness remains unbiased with the increase in noise level, but the uncertainty in the stiffness estimates as represented by the error bars (±1 SD) increases with increasing noise level.
Figure 3.
(a, b) Transverse displacement maps obtained from FEM and MRE experiments at one time point in the wave cycle, respectively, in a beam of 2.5 cm diameter at a vibrating frequency of 200 Hz. (c, d) Corresponding stiffness maps obtained from using Eq. 1 with a mean stiffness of 141.2±16.2 kPa and 145.9±24 kPa, respectively, in the ROIs shown with the black solid line. (e, f) Corresponding stiffness maps obtained using PG with a mean stiffness of 84.1±7 kPa and 91.3±31 kPa, respectively.
Figure 4.
(a) Compiled shear stiffness results from the MRE and FEM analysis of the 3 beams at 3 different frequencies. The results include the MRE and FEM data processed using Eq. 1, and the MRE data processed with PG. The dashed line indicates the true shear stiffness value of 143 kPa. (b) A plot showing the correlation between the shear stiffnesses provided as inputs to the FEM and the shear stiffness estimates obtained using Eq. 1 with the transverse displacement data obtained from the FEM in a beam of 2.5 cm diameter at a frequency of 200 Hz. (c) A plot of shear stiffness versus the noise level added to the transverse displacement data from the FEM of a beam 2.5 cm in diameter vibrated at a frequency of 200 Hz. The error bars represent ±1 SD.
Plates
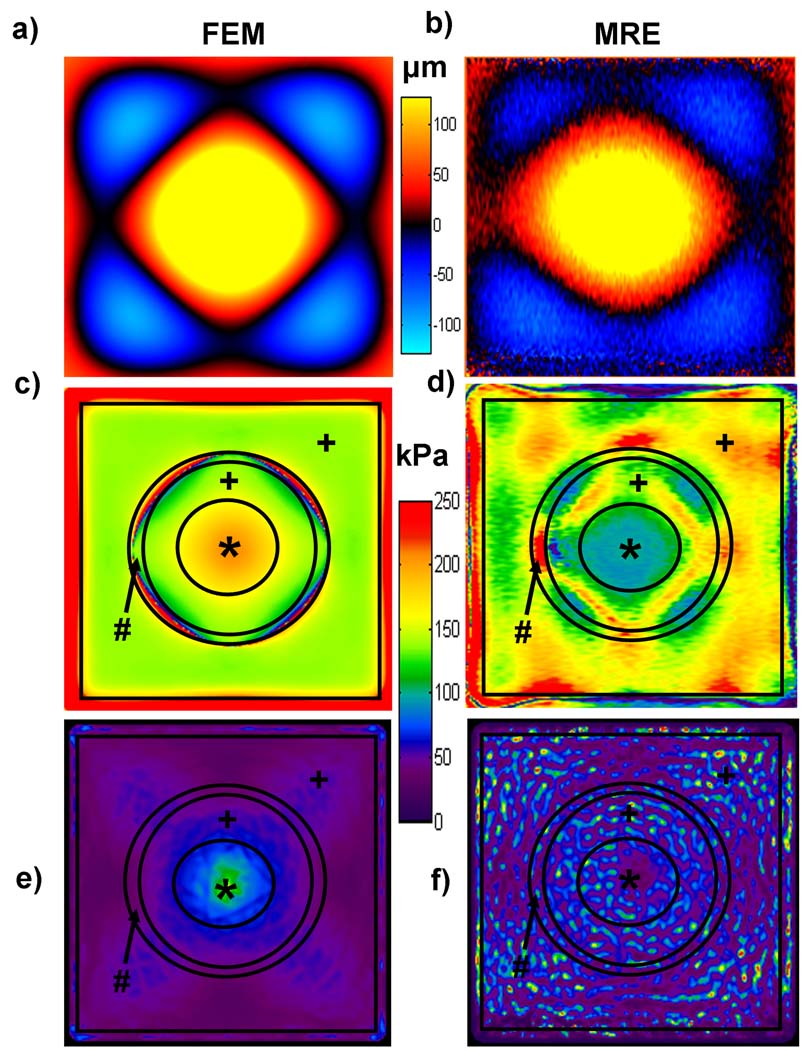
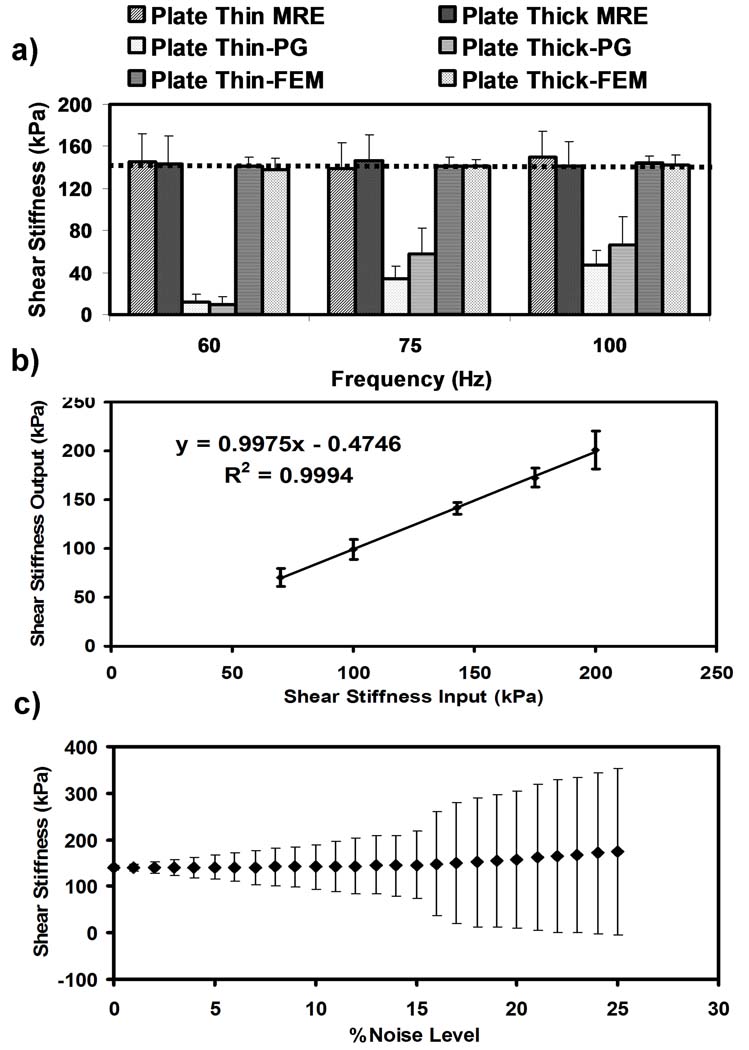
Figure 5(a,b) show the through-plane component of displacement at one time point in the wave cycle obtained from the FEM simulations and MRE experiments for a 2 cm thick plate vibrated at a frequency of 75 Hz. The corresponding stiffness maps obtained using Eq. 2 are shown in figure 5(c,d) and those obtained from using the PG MRE inversion algorithm are shown in figure 5(e,f). The mean MRE stiffness values obtained from the ROIs shown (regions indicated by “+” and avoiding the numerically unstable regions shown by “*, #”) using Eq. 2 and the PG algorithm were 146.5±24.3 kPa and 57.4±24.8 kPa, respectively. The results for the FEM were 141.2±6.1 kPa using Eq.2 and 42.8±8.3 kPa using the PG inversion algorithm. Similarly, the mean MRE stiffness values obtained using LFE and DI were 53.4±4.5 kPa, and 68.7±18.2 kPa respectively. The mean FEM stiffness values obtained using LFE and DI were 41.4±4.4 kPa, and 42.1±4.2 kPa respectively. Figure 6(a) shows the stiffness values obtained from the MRE experimental data and the FEM simulation data for the two different sized plates at different frequencies using Eq. 2 and the PG method. Only the PG results are shown because the LFE and DI results behaved similarly. The input shear stiffness for the FEM was 143 kPa, the result of the mechanical testing. The results from the inversion of Eq. 2 agree well with the known stiffness values, whereas the other unbounded inversions such as PG, LFE and DI techniques underestimated the stiffness in both plates and at all frequencies. As with the beam data, PG, LFE and DI estimates of stiffness improved as the shear wavelength decreased with increasing frequency and plate thickness. Figure 6(b) shows a plot of different shear stiffness values provided as an input to the FEM compared to the stiffness estimates obtained from Eq. 2 for the 2 cm thick plate vibrated at 75 Hz, yielding a linear correlation with R2 = 0.99. Figure 6(c) shows the variation in stiffness measurements obtained using Eq. 2 with the amount of noise added to the displacement data for the same plate. As the noise level was increased, the mean stiffness estimate remained unbiased while the uncertainty increased, as indicated by the error bars (±1 SD).
Figure 5.
(a, b) The through-plane displacement maps obtained from the FEM simulations and MRE experiments at one time point in the wave cycle, respectively, in a 2 cm thick plate at a vibration frequency of 75 Hz. (c, d) The corresponding stiffness maps obtained using Eq. 2 with a mean stiffness of 141.2±6.1 kPa and 146.5±24.3 kPa, respectively, in the ROI shown (between the black solid lines indicated by “+”). The “*” indicated at the center is an unstable region because the source of motion is located there. (e, f) Corresponding stiffness maps obtained using the PG with a mean stiffness of 42.8±8.3 kPa and 57.4±24.8 kPa, respectively.
Figure 6.
(a) Compiled shear stiffness results from the MRE and FEM analysis of the 2 plates at 3 different frequencies. The results include the MRE and FEM data processed using Eq. 2, and the MRE data processed with PG. The dashed line indicates the true shear stiffness value of 143 kPa. (b) A plot of the shear stiffnesses provided as inputs to the FEM versus the shear stiffness estimates obtained using Eq. 2 on the displacement data generated from the FEM of the 2 cm thick plate at a frequency of 75 Hz. (c) A plot of shear stiffness versus the noise level added to the FEM displacement data generated for the 2 cm thick plate vibrated at a frequency of 75 Hz. The error bars represent ±1 SD.
Spherical Shells
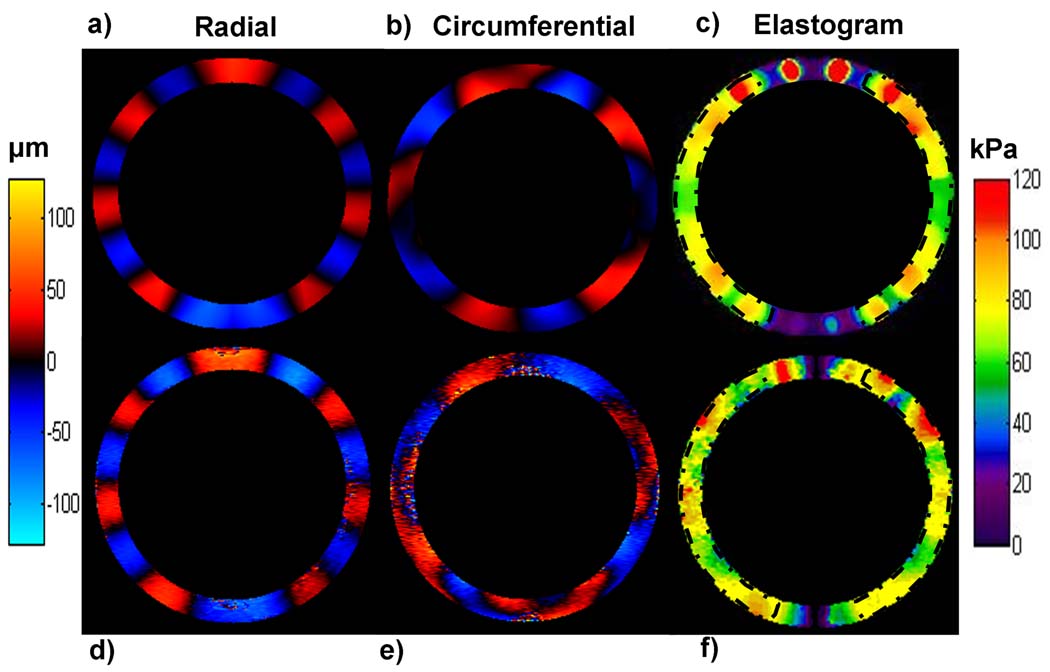
Figure 7(a, b, d, e) show the radial (first column) and circumferential (second column) components of the displacement field at one time point in the wave cycle produced in a spherical shell 10 cm in diameter and 1 cm thick obtained from FEM (top row) and MRE (bottom row) experiments at a vibration frequency of 200 Hz. The corresponding stiffness maps obtained by inverting Eq. 4 are shown in figure 7(c, f) for the FEM and MRE data, respectively. The mean stiffness values obtained from the ROIs described by the black dotted lines are 71±14 kPa and 71.6±14.3 kPa for the FEM and MRE data, respectively. The input shear stiffness for the FEM was 70 kPa. The MRE results obtained by application of the PG inversion method on the radial and circumferential components of displacement separately (not shown) were 30.8±10.3 kPa and 15.1±10.6 kPa, respectively. The results from applying the LFE inversion method on the radial and circumferential displacements were 9.9± 4.8 kPa, and 8.9±3.9 kPa, and with the DI method were 45.1± 16.5 kPa, and 39±14.2 kPa respectively. Furthermore, the spherical shell inversion was performed on MRE data acquired using the thicker shell (not shown) 10 cm in diameter and 1.5 cm thick, yielding a stiffness value of 65.8±17 kPa. For the same shell, the PG analysis reported a mean stiffness of 28.8±16.9 kPa and 11.6±11.5 kPa for the radial and circumferential displacements, respectively. Similarly, using LFE, the stiffness measurements were 12.31±5.3 kPa, and 10.23±6.1 kPa for the radial and circumferential displacements respectively. For the DI method, the stiffness measurements were 48.3±22.1kPa and 43.5±18.3 kPa respectively. The results indicate that unbounded inversions such as PG, LFE and DI are significantly biased and underestimated the stiffness measurements in both shells.
Figure 7.
(a, b, d, e) The radial and circumferential components of motion from the FEM and MRE experiments at one time point in the wave cycle, respectively, for the 1 cm thick shell vibrated at a frequency of 200 Hz. (c, f) The corresponding stiffness maps obtained from Eq. 4 with a mean stiffness of 71.6±14.3 kPa and 71±14 kPa within the ROIs outlined by the dotted black lines for the FEM and MRE data, respectively.
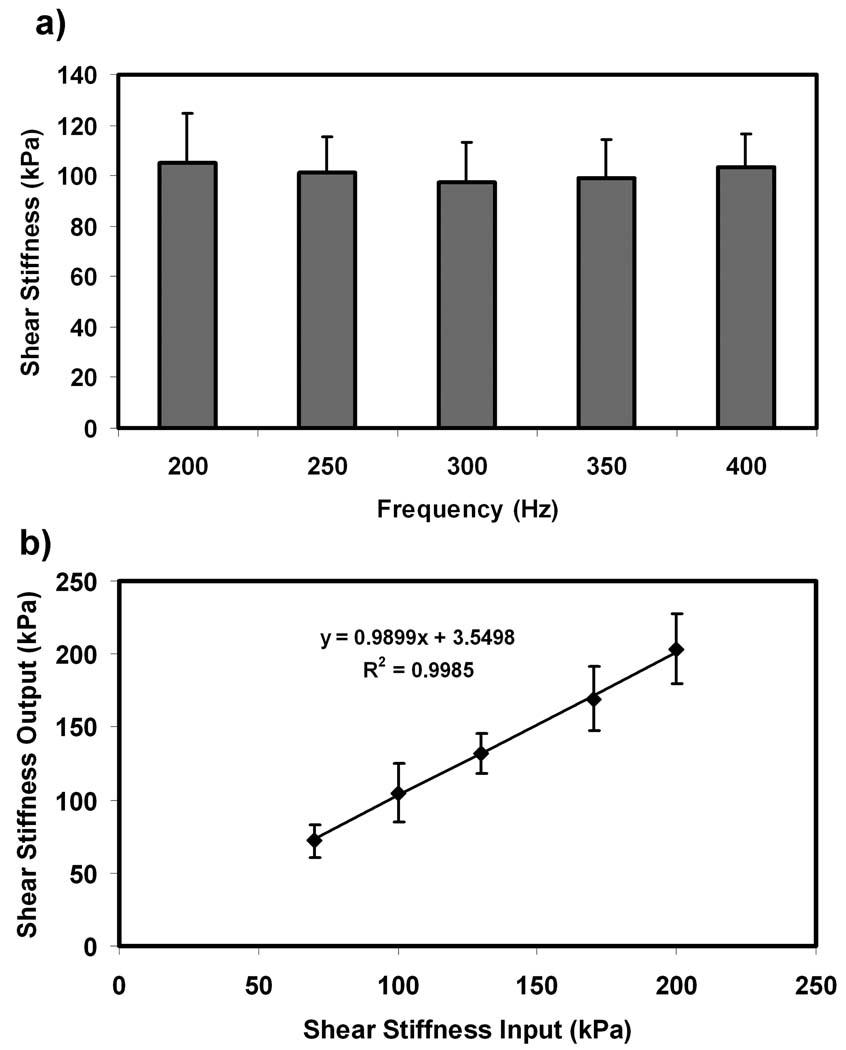
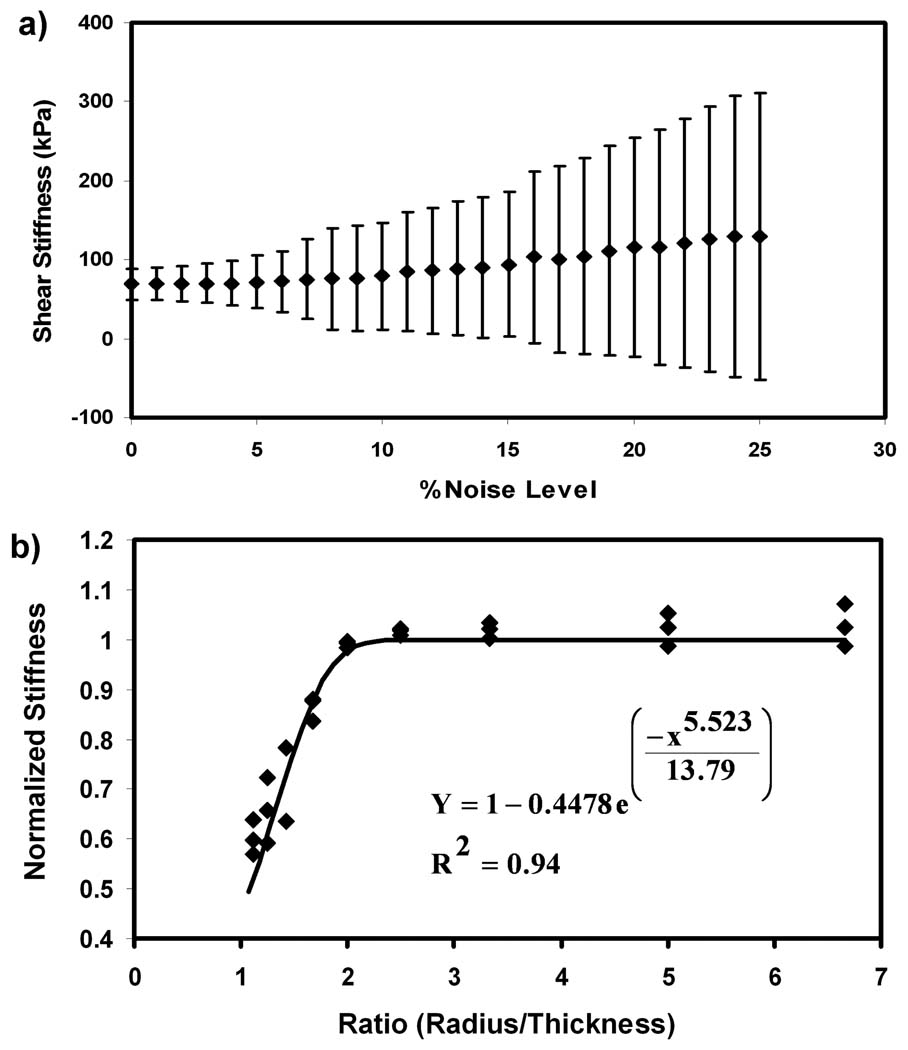
Figure 8(a) shows the stiffness measurements obtained by solving Eq. 4 using the FEM displacement data generated with an input shear stiffness of 100 kPa at frequencies ranging from 200 Hz to 400 Hz. The shear stiffness measurements were unbiased at all frequencies. Figure 8(b) shows a plot of different shear stiffness values provided as an input to the FEM compared to the stiffness estimates obtained from Eq. 4 for the 1 cm thick shell at a frequency of 200 Hz, which yielded a linear correlation with R2 = 0.99. Figure 9(a) shows the variation in stiffness measurements obtained using Eq. 4 with different amounts of noise added to the displacement data for the same shell model generated from an input stiffness of 70 kPa. As the noise level increased, a small bias was observed in the mean stiffness measurements and the uncertainty in the estimates increased as indicated by the error bars (±1 SD).
Figure 8.
(a) A plot of shear stiffness obtained at different frequencies in a FEM of the 1 cm thick shell for an input shear modulus of 100 kPa. (b) A plot of the shear stiffnesses provided as inputs to the FEM versus the shear stiffness estimates obtained using Eq. 4 on the displacement data generated from the FEM of the 1 cm thick shell at a frequency of 200 Hz.
Figure 9.
(a) A plot of shear stiffness versus the amount of noise added to the radial and circumferential components of displacement obtained from the FEM of the 1 cm thick shell vibrated at a frequency of 200 Hz. The error bars represent ±1 SD. (b) Plot of the reconstructed stiffness using Eq. 4 (normalized to the FEM input stiffness) versus the radius-to-thickness ratio of the shell for various simulated datasets. An exponential function was fit to the data, which can be used to correct the stiffness estimates of the shell when the ratio of radius to thickness falls below 2.
Figure 9(b) shows the results of the study to determine the amount of error that may arise in the stiffness estimates of spherical shells with various radii and thicknesses. The plot shows the measured stiffness (normalized to the shear stiffness used in the FEM) as a function of the ratio of radius to shell thickness. The thin spherical shell analysis is accurate for shells whose radius-to-thickness ratios ≥ 2. Below that, an error is introduced due to violations of the assumed model of the shell, which must be corrected. A nonlinear fit was performed as indicated in figure 9(b) to determine the required correction factor for an arbitrary shell when the ratio falls below 2.
Discussion
Current MRE inversion algorithms, which assume an infinite medium are expected to be biased when estimating the true stiffness of media when the induced stress waves are propagating in a confined geometry with dimensions comparable to their shear wavelengths (27). These results demonstrate this for PG, LFE, and DI inversions in all three geometries considered. The bounded media inversions on all three geometries estimated precise stiffness values at different frequencies, different input FEM stiffnesses, and were robust to different noise levels. Therefore, new inversion equations that include the geometric conditions of the object under investigation are required in order to precisely estimate its true stiffness.
For the thin beam model, excellent agreement between experimental, FEM data and mechanical testing (3-point bending) was observed. However, banding artifacts can be observed in the stiffness maps shown in figure 3. These artifacts correspond to the nodes in the displacement data. When inverting the beam wave equation around these nodes, the displacement and the fourth derivative of displacement approach zero, which yields unstable solutions in Eq. 1. The MRE elastogram obtained using the beam inversion shown in figure 3 is also non uniform within the ROIs due to the presence of noise, which also affects the quality of the derivative estimates.
The plate inversion is a 2D extension of the beam inversion and as such, the plate wave equation also has regions where the displacement and derivatives of displacement yield numerically unstable results, such as the thin annular region indicated by an arrow with “#” in figure 5. This wave equation is also valid only in plates whose thickness does not exceed λs/20, where λs is the shear wavelength. Hence, appropriate frequencies for analysis must be chosen that satisfy the thin-plate theory. Previous studies (24,25) have used plate inversion equations to detect defects in orthotropic wood slabs by inverting dynamic surface displacements and also to identify rib detachments in a thin metal plate by inverting laser Doppler vibrometry data. These techniques use surface measurements of displacement and variational techniques to determine variations in mechanical properties, whereas the present technique inverts MRE-encoded displacements from throughout the medium to provide estimates of the true stiffness of the material.
The stiffness estimates from MRE-encoded displacements obtained using the thin spherical shell inversion agreed well with the FEM simulation results. As with the beams and plates, the elastograms obtained from the thin-shell inversion are not uniform throughout the phantom, as shown in figure 7. Two potential reasons for the variation in the elastograms throughout the central portion of the shell are first, the attenuation of the wave away from the driver source resulting in a decrease in the amplitude of wave displacements and hence increased noise and secondly because the through-plane component of motion was neglected in the model. The artifacts at the top and bottom of the elastograms arise because of numerical instabilities due to the cotangent function in the wave equation going to zero in these regions. Under the experiments performed in this study, as shown in figure 9, the thin-shell inversion fails when the ratio of the shell radius to thickness falls below 2. If the ratio falls below this threshold in a particular application, correction factors calculated from the equation shown in figure 9(b) can be used to obtain a more precise estimate of the stiffness of the material.
While excellent agreement was observed between the MRE and corresponding FEM results in this study, there are several limitations of this study that affect the agreement between the two techniques. First, the MRE-encoded displacements vary slightly from the corresponding FEM displacements due to practical limitations in recreating the exact boundary conditions and driver positions of the FEM, which can be manifested as slight variations in the elastograms. Furthermore, the phantoms themselves may not be perfectly uniform in size or material properties due to manufacturing limitations, thus also slightly perturbing the induced wave fields and reconstructed elastograms. Second, the presence of an indeterminate amount of attenuation or viscosity in the real phantoms was only approximately reproduced in the FEM. This difference can impact the wave propagation model, as well as the inversions themselves, since the wave equations used in this work do not assume any attenuation. Third, the assumption of no through-plane motion in the spherical shell inversion causes some nonuniformity in the elastograms. Despite these limitations, the inversion algorithms described here demonstrated close agreement with non MRE-based methods (FEM and mechanical testing). Additional work incorporating the use of FEM will include a more thorough analysis of each geometry to try to determine the impact on the quality of these inversions due to significant/relative variations in geometry, geometric size with respect to stiffness and excitation frequency, location and direction of the motion source(s), and boundary conditions. Preliminary investigations into this behavior for the spherical shell inversion were presented here (figure 9(b)), but a thorough treatment of all geometries was considered to be beyond the scope of this current work.
In the real world, the geometries of the organs deviate from the ideal structures considered here. However, several studies (28–30) have demonstrated the feasibility of applying beam and spherical shell inversions to anatomical structures such as bone, spinal cord and heart. The measured stiffness estimates in bone (28) and spinal cord (29) using a beam approximation were in the range of stiffness measurements quoted in the literature (31,32). With a spherical shell approximation of the heart, stiffness estimates of the myocardium throughout the cardiac cycle have been obtained (30). These stiffness measurements demonstrated a strong correlation with pressure measurements obtained throughout the cardiac cycle. The stiffness measurements obtained using the spherical shell inversion were also validated in a simulated spherical left ventricular phantom with an established pressure-volume model that determines stiffness (33). However, the purpose of the work presented in this manuscript was to highlight a limitation of current inversion algorithms and propose an improved analytic method for MRE of bounded media. The preliminary tissue results described above, though incorporating the bounded media inversions, were considered to be beyond the scope of this manuscript because each application would require its own detailed account of the assumptions, methods, results and validation appropriate for each study.
Future work involves a continued investigation of the use of these inversion algorithms for obtaining the stiffness of tissues and for identifying different disease states in tissue whose dimensions will affect wave propagation, such as the spinal cord, bone, skin, heart, and eyes. Improved capabilities for assessing bone and spinal cord stiffness in vivo could find application in the diagnosis of osteoporosis, tissue-engineered constructs, and surgical simulations which may aid in the development of new treatments for acute and chronic back problems. Being able to determine the shear stiffness of the myocardium in vivo could be useful for the diagnosis of disease states such as diastolic dysfunction, hypertension, and myocardial infarction. Since high-order derivatives are used in these inversion algorithms, more robust methods will be implemented for determining these derivatives to reduce the sensitivity of these techniques to noise. In the future, the existing spherical shell inversion equation should be extended to incorporate the through-plane component of motion and torsional motion likely to occur in in vivo tissue. Also, the effects of heterogeneity and anisotropy on these inversions must be further explored. Investigations into the effects of heterogeneity will show if an assumption of local homogeneity will be as appropriate for these models as it has been used for previous algorithms, such as PG and DI. Similarly, applying the current bounded media inversions to anisotropic media will return a composite or effective shear stiffness reflective of the properties of the material. While work to incorporate anisotropy into this kind of analysis is ongoing, the effective shear stiffness that would be currently obtained may still have clinical utility by providing a quantifiable and discriminating quantity when applied to diseased tissues.
In conclusion, we have demonstrated novel MRE inversion methods for wave propagation in bounded media to determine the true stiffness of the material under study. While existing inversion algorithms (e.g., PG, LFE, DI) assume wave propagation in infinite media, and thus incorrectly assess the mechanical properties of bounded media, the proposed technique uses information about the structure of the object to solve for its true material properties. Each inversion algorithm (beams, plates and shells) was validated using FEM and has been shown to be precise over a range of material stiffnesses, media dimensions, excitation frequencies, and noise levels.
Acknowledgments
Authors would like to thank Dr. Matthew B. Mccullough for conducting mechanical testing.
Grant Support: National Institutes of Health Grants EB001981
References
- 1.Yin M, Talwalkar JA, Glaser KJ, Manduca A, Grimm RC, Rossman PJ, Fidler JL, Ehman RL. Assessment of hepatic fibrosis with magnetic resonance elastography. Clin Gastroenterol Hepatol. 2007;5:1207–1213. doi: 10.1016/j.cgh.2007.06.012. [DOI] [PMC free article] [PubMed] [Google Scholar]
- 2.Sinkus R, Tanter M, Xydeas T, Catheline S, Bercoff J, Fink M. Viscoelastic shear properties of in vivo breast lesions measured by MR elastography. Magn Reson Imaging. 2005;23:159–165. doi: 10.1016/j.mri.2004.11.060. [DOI] [PubMed] [Google Scholar]
- 3.Pislaru C, Bruce CJ, Anagnostopoulos PC, Allen JL, Seward JB, Pellikka PA, Ritman EL, Greenleaf JF. Ultrasound strain imaging of altered myocardial stiffness: stunned versus infarcted reperfused myocardium. Circulation. 2004;109(23):2905–2910. doi: 10.1161/01.CIR.0000129311.73402.EF. [DOI] [PubMed] [Google Scholar]
- 4.Badenhorst D, Maseko M, Tsotetsi OJ, Naidoo A, Brooksbank R, Norton GR, Woodiwiss AJ. Cross-linking influences the impact of quantitative changes in myocardial collagen on cardiac stiffness and remodelling in hypertension in rats. Cardiovasc Research. 2003;57(3):632–641. doi: 10.1016/s0008-6363(02)00733-2. [DOI] [PubMed] [Google Scholar]
- 5.Zile MR, Baicu CF, Gaasch WH. Diastolic heart failure--abnormalities in active relaxation and passive stiffness of the left ventricle. N Engl J Med. 2004;350(19):1953–1959. doi: 10.1056/NEJMoa032566. [DOI] [PubMed] [Google Scholar]
- 6.Nagatani Y, Takahashi M, Nitta N, Takazakura R, Asai T, Ushio N, Otani H, Murakami Y, Murata K. Quantitative assessment of arterial stiffness by multiphase analysis in retrospectively electrocardiogram-gated multidetector row computed tomography: comparison between patients under chronic hemodialysis and age-matched controls. Invest Radiol. 2008;43(3):195–201. doi: 10.1097/RLI.0b013e31815cd987. [DOI] [PubMed] [Google Scholar]
- 7.Segal RL. Use of imaging to assess normal and adaptive muscle function. Phys Ther. 2007;87(6):704–718. doi: 10.2522/ptj.20060169. [DOI] [PubMed] [Google Scholar]
- 8.Ophir J, Cespedes I, Ponnekanti H, Yazdi Y, Li X. Elastography: a quantitative method for imaging the elasticity of biological tissues. Ultrason Imaging. 1991;13(2):111–134. doi: 10.1177/016173469101300201. [DOI] [PubMed] [Google Scholar]
- 9.de Ledinghen V, Le Bail B, Rebouissoux L, Fournier C, Foucher J, Miette V, Castera L, Sandrin L, Merrouche W, Lavrand F, Lamireau T. Liver stiffness measurement in children using FibroScan: feasibility study and comparison with Fibrotest, aspartate transaminase to platelets ratio index, and liver biopsy. J Pediatr Gastroenterol Nutr. 2007;45(4):443–450. doi: 10.1097/MPG.0b013e31812e56ff. [DOI] [PubMed] [Google Scholar]
- 10.Sack I, Beierbach B, Hamhaber U, Klatt D, Braun J. Non-invasive measurement of brain viscoelasticity using magnetic resonance elastography. NMR Biomed. 2008;21(3):265–271. doi: 10.1002/nbm.1189. [DOI] [PubMed] [Google Scholar]
- 11.Rouviere O, Yin M, Dresner MA, Rossman PJ, Burgart LJ, Fidler JL, Ehman RL. MR elastography of the liver: preliminary results. Radiology. 2006;240(2):440–448. doi: 10.1148/radiol.2402050606. [DOI] [PubMed] [Google Scholar]
- 12.Ringleb SI, Bensamoun SF, Chen Q, Manduca A, An KN, Ehman RL. Applications of magnetic resonance elastography to healthy and pathologic skeletal muscle. J Magn Reson Imaging. 2007;25(2):301–309. doi: 10.1002/jmri.20817. [DOI] [PubMed] [Google Scholar]
- 13.Muthupillai R, Lomas DJ, Rossman PJ, Greenleaf JF, Manduca A, Ehman RL. Magnetic resonance elastography by direct visualization of propagating acoustic strain waves. Science (New York, NY. 1995;269(5232):1854–1857. doi: 10.1126/science.7569924. [DOI] [PubMed] [Google Scholar]
- 14.McKnight AL, Kugel JL, Rossman PJ, Manduca A, Hartmann LC, Ehman RL. MR elastography of breast cancer: preliminary results. Ajr. 2002;178(6):1411–1417. doi: 10.2214/ajr.178.6.1781411. [DOI] [PubMed] [Google Scholar]
- 15.Manduca A, Oliphant TE, Dresner MA, Mahowald JL, Kruse SA, Amromin E, Felmlee JP, Greenleaf JF, Ehman RL. Magnetic resonance elastography: non-invasive mapping of tissue elasticity. Med Image Anal. 2001;5(4):237–254. doi: 10.1016/s1361-8415(00)00039-6. [DOI] [PubMed] [Google Scholar]
- 16.Van Houten EE, Miga MI, Weaver JB, Kennedy FE, Paulsen KD. Three-dimensional subzone-based reconstruction algorithm for MR elastography. Magn Reson Med. 2001;45(5):827–837. doi: 10.1002/mrm.1111. [DOI] [PubMed] [Google Scholar]
- 17.Karimi R, Zhu T, Bouma BE, Mofrad MR. Estimation of nonlinear mechanical properties of vascular tissues via elastography. Cardiovasc Eng (Dordrecht, Netherlands) 2008;8(4):191–202. doi: 10.1007/s10558-008-9061-0. [DOI] [PMC free article] [PubMed] [Google Scholar]
- 18.Junger CM, Fiet D. Sound, Structures and Their interaction. Massachsetts and London England: The MIT Press Cambridge; 1972. The in vacuo vibrations of shells; pp. 230–253. [Google Scholar]
- 19.Graff KF. Wave motion in elastic solids. New York: Dover publications Inc; 1991. pp. 229–233. [Google Scholar]
- 20.ASTM Standard E132-04 Standard Test Method for Poisson's Ratio at room Temperature [Google Scholar]
- 21.Structural Mechanics Module, User Guide: COMSOL AB. 2005:111–115. [Google Scholar]
- 22.van Lenthe GH, Voide R, Boyd SK, Muller R. Tissue modulus calculated from beam theory is biased by bone size and geometry: implications for the use of three-point bending tests to determine bone tissue modulus. Bone. 2008;43(4):717–723. doi: 10.1016/j.bone.2008.06.008. [DOI] [PubMed] [Google Scholar]
- 23.Press WH, Teukolsky SA, Vetterling WT, Flannery BP. Numerical recipes in C: The art of scientific computing. Cambridge University Press; 1992. pp. 650–655. [Google Scholar]
- 24.Romano AJ, Bucaro JA, Vignola JF, Abraham PB. Detection and localization of rib detachment in thin metal and composite plates by inversion of laser Doppler vibrometry scans. J Acoust Soc Am. 2007;121(5 Pt1):2667–2672. doi: 10.1121/1.2715459. [DOI] [PubMed] [Google Scholar]
- 25.Romano AJ, Bucaro JA, Dey S. Defect detection and localization in orthotropic wood slabs by inversion of dynamic surface displacements. J Acoust Soc Am. 2008;124(2):918–925. doi: 10.1121/1.2945706. [DOI] [PubMed] [Google Scholar]
- 26.Manduca A, Lake DS, Kruse SA, Ehman RL. Spatio-temporal directional filtering for improved inversion of MR elastography images. Med Image Anal. 2003;7(4):465–473. doi: 10.1016/s1361-8415(03)00038-0. [DOI] [PubMed] [Google Scholar]
- 27.Chen Q, Ringleb SI, Manduca A, Ehman RL, An KN. Differential effects of pretension on shear wave propagation in elastic media with different boundary conditions as measured by magnetic resonance elastography and finite element modeling. J Biomech. 2006;39(8):1428–1434. doi: 10.1016/j.jbiomech.2005.04.009. [DOI] [PubMed] [Google Scholar]
- 28.Chen J, McGregor H, Glaser KJ, Mariappan Y, Kolipaka A, Ehman RL. Magnetic Resonance Elastography in Trabecular Bone: Preliminary Results. Proceedings of the 17th Annual Meeting of ISMRM; Honolulu, Hawaii. 2009. p. 312. [Google Scholar]
- 29.Kruse SA, Kolipaka A, Manduca A, Ehman RL. Feasibility of Evaluating the Spinal Cord with MR Elastography. Proceedings of the 17th Annual Meeting of ISMRM; Honolulu, Hawaii. 2009. p. 629. [Google Scholar]
- 30.Kolipaka A, McGee KP, Araoz PA, Manduca A, Ehman RL. MR Elastography as a method for the assessment of myocardial stiffness throughout the cardiac cycle. Proceedings of the 17th Annual Meeting of ISMRM; Honolulu, Hawaii. 2009. p. 1790. [Google Scholar]
- 31.Turner CH, Rho J, Takano Y, Tsui TY, Pharr GM. The elastic properties of trabecular and cortical bone tissues are similar: results from two microscopic measurement techniques. J Biomech. 1999;32(4):437–441. doi: 10.1016/s0021-9290(98)00177-8. [DOI] [PubMed] [Google Scholar]
- 32.Yoganandan N, Kumaresan S, Pintar FA. Biomechanics of the cervical spine Part 2. Cervical spine soft tissue responses and biomechanical modeling. Clin Biomech (Bristol, Avon) 2001;16(1):1–27. doi: 10.1016/s0268-0033(00)00074-7. [DOI] [PubMed] [Google Scholar]
- 33.Kolipaka A, McGee KP, Araoz PA, Glaser KJ, Manduca A, Romano AJ, Ehman RL. MR elastography as a method for the assessment of myocardial stiffness: Comparison with an established pressure-volume model in a left ventricular model of the heart. Magn Reson Med. 2009 doi: 10.1002/mrm.21991. In Press. [DOI] [PMC free article] [PubMed] [Google Scholar]


