

Abstract
Purpose
The mean length of children’s utterances is a valuable estimate of their early language acquisition. The available normative data lacks documentation of language and nonverbal intelligence levels of the samples. This study reports age-referenced MLU data from children with specific language impairment and children without language impairments.
Method
306 child participants were drawn from a data archive, ages 2;6–9;0 years, 170 with SLI and 136 control children. 1564 spontaneous language samples were collected, transcribed and analyzed for sample size and MLU in words and morphemes. Means, standard deviations, and effect sizes for group differences are reported for MLUs, along with concurrent language and nonverbal intelligence assessments, per 6-month intervals.
Results
The results document an age progression in MLU words and morphemes, and a persistent lower level of performance for children with SLI.
Conclusions
The results support the reliability and validity of MLU as an index of normative language acquisition and a marker of language impairment. The findings can be used for clinical benchmarking of deficits and language intervention outcomes, as well as comparisons across research samples.
One of the most robust indices of young children’s language acquisition is the number of words or morphemes in each of their spontaneous utterances, conventionally described as the mean length of utterance (MLU). The potential utility of this measure has long been recognized. Well before the advent of portable electronic devices to record children’s utterances for later transcription, Margaret Morse Nice (1925) regarded average sentence length to be “the most important single criterion for judging a child’s progress in the attainment of adult language” (p. 378). With portable tape recorders in hand, Roger Brown (1973) and his colleagues developed new standards for transcription and morphological analyses that established MLU as a benchmark for the description of children’s emergent language abilities. The modern era of computer-assisted methods of transcript analyses (Miller & Chapman, 1991; MacWhinney, 2000) and machine calculation of MLU values has greatly expanded the utilization of this measure as a language benchmark. The normative child language literature has embraced MLU as a way to benchmark the level of a child’s language acquisition to age expectations and to the linguistic competencies associated with particular levels of MLU. A recent electronic search for the phrase yielded 75,300 instances in the available literature.
MLU is also a valuable index in investigations of children with language impairments. In clinical applications, MLU is used to diagnose language impairments in young children, often defined as an MLU level one standard deviation or more below the mean for the child’s age level (Eisenberg, Fersko, & Lundgren, 2001). An expert panel recently recommended that MLU be used as a benchmark for cross-study comparisons of language intervention outcomes for children with autism, as one of several potential outcome measures (Tager-Flusberg et al., 2009). MLU has been used as a matching variable in many studies of clinical groups. The interpretation focuses on the potential value of controlling for general language levels, indexed by MLU, and examining whether other linguistic processes or competencies are equivalent, to determine if there are distinctive profiles of language impairments across different clinical groups (such as Down syndrome versus Williams syndrome, for example) or if there is a delayed, generally immature linguistic system versus a generally immature linguistic system plus selective areas of linguistic deficits. An example of the latter kind of investigation is a study by Rice, Redmond & Hoffman (2006), who examined various properties of MLU in a group of children with Specific Language Impairment (SLI) as compared to two control groups: A younger MLU-equivalent group and an age control group. They found strong concurrent validity for MLU at 5 years of age and strong reliability and validity for longitudinal growth patterns from 3 to 8 years of age. For an extensive review of studies with this design see Leonard (1998).
Given the widespread utility of MLU, reference databases are important sources of developmental, age-referenced data. Two electronic databases are widely used for this purpose, although each has limitations. The Child Language Data Exchange System (CHILDES; MacWhinney, 2000) provides a valuable archive of transcripts from many studies from which MLU values can be calculated. The limitations are that the transcripts were generated for diverse purposes, with considerable variation in participants, methods and levels of documentation, all of which complicates their use as a reference resource.
The second database, Systematic Analysis of Language Transcripts (SALT; Miller & Chapman, 1991 and subsequent updates), was developed as a reference database. The original data collection was carried out in 1984 and 1987, based on spontaneous language samples collected in the public schools of Madison, Wisconsin and a nearby rural area (Leadholm & Miller, 1992). Public school speech pathologists were trained in a standard method of collecting, recording, transcribing, and analyzing language samples. The total sample consisted of 266 children, ages three to 13 years of age. The children are described as “a random sample reflecting the diverse socio-economic status of Wisconsin” (Leadholm & Miller, 1992, p. 92). Data are stratified in one-year age levels, with 27–50 children per year. The means and standard deviations per age level are incorporated into the commercially available SALT software program (Miller & Chapman, 2008, current 8th edition) which provides reference means and standard deviations for the child’s age as part of the standard output per transcript, thereby making the normative information widely available and very useful for a large number of researchers. Important strengths of the database are the uniform sample size of 100 complete and intelligible utterances for each sample, the consistency in sampling procedures and data reporting across the different age levels, and the initial training for the transcribers to ensure transcription reliability.
Although this database has been a very valuable resource that is used widely for normative and clinical studies, there are important limitations. One is that the 100 utterance sample size may be less than optimal for reliability. Gavin and Giles (1996) report that acceptable levels of test/retest reliability for MLU, set at r > .90, were only observed for samples containing 175 utterances or more. They report that sample sizes of 50–100 utterances have reliabilities in the range of r = .61–.82; sample sizes of 100–150 had a range of .78–.83. A second category of limitations bears on the lack of direct assessments of the child participants for related abilities. Most importantly, direct language assessment of the reference sample is unavailable to confirm language performance within or above normal range. Also unavailable is information on hearing status, to confirm that the normative sample passed hearing screenings. Finally, information about the reference samples’ levels of nonverbal intelligence is not available. Information on these missing variables would help define the population used for comparison.
Finally, there is a great need for age-graded reference MLU data for children with documented Specific Language Impairment (SLI). This condition is characterized by language impairment in children who show no obvious other developmental impairments—excluding children with clinically significant hearing impairment, clinically diagnosed neurodevelopmental disorders or syndrome diagnosis such as Down syndrome, Williams syndrome, or autism. Tomblin, et al. (1997) report that 7% of kindergarten children show SLI. Because language impairment is primary in children with SLI, who do not have other developmental disabilities associated with language impairment, this clinical group is widely used as a model system for comparisons to unaffected children and to children carrying other diagnoses (cf. Rice, Warren & Betz, 2005). Recent genetic studies document linkage to genetic sources of SLI (Falcaro, et al. 2008), adding to the interest in this condition. Although MLU is widely used as part of the phenotype for this disorder, there is no repository of MLU levels broken out by age levels for children with SLI. Such a resource would be valuable for comparing across samples of affected groups used in the research literature.
One potential problem for MLU data from children with SLI is that clinically referred samples can include a relatively high proportion of children with speech impairments. Zhang and Tomblin (2000) report that children with speech disorders are more likely to be served by speech-language pathologists than children with language disorders. The potential problem is that clinical samples could yield low intelligibility that would affect the reliability of transcription for MLU estimates. Yet in an epidemiologically ascertained sample the likelihood of concomitant speech and language impairment is less than 2% in the general population of 5-year-olds and only about 5–8% of the children with language impairments showed clinically significant speech disorders (Shriberg, Tomblin & McSweeny, 1999). Thus what is needed is a sample that is representative of the broad SLI profile, without significant speech impairment.
The purpose of this paper is to report MLU and associated omnibus standardized language archival data from children with SLI and unaffected children ages 2;6 to 9 years of age, in 6-month intervals. The sample is controlled for clinically significant speech impairments.
METHODS
Participants
The sample was drawn from the data archive of an on-going longitudinal study of children with SLI (referred to as “probands” in the larger genetics study), control groups of unaffected children, and the siblings or cousins of the SLI group. Hereafter the broader study will be referred to as the “base study.” The sample for the study reported here is comprised of 306 child participants, ages 2;6 to 9;0 years, distributed as 170 affected children and 136 unaffected children. For the affected group, 134 entered the base study as probands. An additional 36 children were identified as affected when evaluated as part of the family testing protocol; although they were not designated as SLI on an a priori basis, based on their test scores they met criterion for SLI. A series of t tests confirmed no difference between the proband subgroup and the family-ascertained affected subgroup in MLU levels in any of the age intervals studied. For the unaffected group, 87 entered as control children; 49 additional children entered from the family testing protocol, screened for language performance in the normal range or above on the language assessments. Gender distribution for the full sample was 132 females, 174 males, subdivided as 61 females, 109 males in the affected group; 71 females, 65 males in the unaffected group. The children were recruited from the west-central Midwestern region of the U.S.A., from monolingual English-speaking families who planned to remain in the area for five years or more. The affected and unaffected children were drawn from the same school attendance centers; all but a handful attend public school. For the full sample, racial categories are as follows: 86%, White; 3%, American Indian/Alaska Native; 0% Asian; 0% Black or African American; 7%, more than one race; and 4 % unknown or not reported. Hispanic ethnicity is reported by 6% of the sample. Maternal education levels were of interest given the findings of Dollaghan et al (1999) linking maternal education and measures of early speech and language. For the participants of this study, maternal education levels were predominately high school graduates with some additional coursework. Education levels were measured on a scale of 1 = Some high school, no diploma; 2 = high school graduate; 3 = Some college, no degree; 4 = Bachelor’s degree; 5 = Some graduate work; 6 = Graduate degree. The grand mean for the full group was 3.26 (1.42); affected group, 2.77 (1.25); unaffected group, 3.87 (1.38).
Initial screenings eliminated children with diagnoses of autism or autism spectrum disorders (all of whom were siblings), children with nonverbal intelligence levels below 85 on the Columbia Mental Maturity Scales (CMMS; Burgemeister, Blum, & Lorge, 1972) or the Wechsler Intelligence Scale for Children Nonverbal Scale (WISC; Wechsler, 1991) and/or diagnosed with developmental disabilities, and children who did not pass a screening for hearing impairment, at 25 dB HL at 1000, 2000, and 4000 Hz. Children’s speech intelligibility was screened to ensure adequacy for suitable levels of intelligibility for transcription. This criterion was defined by a passing score on a probe screening for articulation competency with consistent use of final –t, -d,-s, and -z (Rice & Wexler, 2001) and only minor mispronunciations, such as distortions of /r/, /l/ and blends, on the Goldman Fristoe Test of Articulation (GFTA; Goldman & Fristoe, 1986). Possible dialect speakers were assessed on the Diagnostic Evaluation of Language Variation (DELV; Seymour, Roeper & deVilliers, 2003) and excluded if they met dialect criterion. Probands were previously diagnosed as having language impairment by a certified speech-language pathologist, with few exceptions ascertained via direct referral or screenings in preschools. There were two inclusionary criteria for proband entry into the study. One was performance on an omnibus language assessment 1 SD or more below age expectations and performance. Depending on the child’s age, the tests were: Test of Early Language Development (TELD-3; Hresko, W.R., Reid, D., et al, 1999), Test of Language Development-Primary, 2nd ed. (TOLD-P:2; Newcomer, P. L., & Hammill, D. D., 1988) and Clinical Evaluation of Language Fundamentals, 3rd Edition (CELF; Semel, E.M., Wiig, E., & Secord, W., 1995). The second criterion was MLU level 1 SD or more below age expectations, benchmarked to the norms of Leadholm and Miller (1992) as measured from a sample of at least 150 utterances, with a few exceptions among the youngest affected children whose samples yielded somewhat fewer utterances.
In addition to the omnibus language tests used to identify affected children, the base study protocol included the Peabody Picture Vocabulary Test-Revised (PPVT-R) (Dunn & Dunn, 1981) as an estimate of vocabulary and the Test of Early Grammatical Impairment (TEGI; Rice & Wexler, 2001), as an estimate of morphosyntactic abilities focused on finiteness morphology. On their first time of measurement, 54% of the probands had a PPVT standard score of 85 or less; 88% of the probands had a TEGI composite grammar z score of more than one standard deviation below the mean, calculated according to the means and standard deviations provided in the TEGI manual. Overall, at entry the probands represent a general profile of SLI, at roughly the 15th percentile of the normative distribution on language assessments, without regard to receptive versus expressive status.
For assignment of siblings or cousins to affected versus control groups, the archival database was searched for all children whose overall performance on omnibus language assessment on at least one test occasion was one standard deviation or more below the mean for the age level. This criterion identified all the children who entered as probands and 36 children who entered as siblings or cousins. All siblings/cousins who scored in the affected range were included in the longitudinal assessment protocol.
The unaffected children were recruited into the base study as control children, or as siblings or cousins of probands. Their language performance on omnibus tests was above the cut-off for the affected group.
Sampling procedures
The protocol for the longitudinal base study included spontaneous language samples at 6-month intervals for children in the age range of 2;6 to 9 years of age. The samples were collected by trained examiners in interactions with a child. The sampling was carried out off-site. Most samples were collected in mobile vans customized for data collection, with some samples collected in quiet rooms in schools or in home settings with the child and examiner as participants. Over the years of the study a total of 30 examiners collected samples.
The conversational play-based sampling procedures used a standard set of age-appropriate toys selected to elicit a variety of grammatical forms and sentence types, consisting of toy people, household objects, toy animals, a set of objects associated with a camping scenario, or a set of objects associated with a medical emergency scene. The last two sets of objects were used with the older children (beginning around 7 years), given that about this time children’s interest in household objects and toy animals had waned. The samples were audio-recorded with external microphones and video-recorded (used as a back-up for transcription when needed). The aim was for a minimum of 200 complete and intelligible child utterances, which usually required about 20–30 minutes of interactions, with the longer times needed for affected children.
Examiners were trained to follow “best practice guidelines” regarding sample collection. This included following the children’s conversational lead, engaging in parallel talk about familiar household activities, sharing personal anecdotes and experiences, and introducing topics related to past and on-going events during their conversational interactions. Examiners were trained to keep the use of “yes/no” and Wh-questions to a minimum, and to avoid dominating the verbal interactions with many utterances. Sampling validity monitoring included a minimum of three observed sampling sessions with feedback in the training phase, followed by intermittent sampling sessions observed in the field by the lead examiners. Further validity checks were carried out via a schedule of video-viewing by trained research assistants who noted any unusual practices on a lab report. The topic of spontaneous sampling was included in a regular rotation for discussion in staff meetings with demonstration transcripts and videotapes for the purpose of validity checks and calibration of procedures across examiners. Finally, intermittent checks of transcription summaries were carried out to monitor numbers of examiner utterances and questions.
The samples were transcribed and coded for grammatical morphemes by the examiners, following the conventions of the Kansas Language Transcript Database (Rice, et al 2004). This manual provides a standard way of handling English anomalies and avoiding potential errors in coding. This includes details such as the following: Instruction not to insert plural codes on nouns which do not have a singular counterpart, such as scissors or pants; a list of verbs that do not change from present to past tense, such as fit, hit, and hurt; and a list of compound words to be treated as single words, such as basketball and spongebobsquarepants. Coding conventions and code entry into the transcripts were consistent with the SALT software (Miller & Chapman, 1991, 2002). Utterance segmentation followed Miller (1981, p. 14), according to terminal intonation contour and/or pauses of 2–3 seconds. In addition, although these utterances are of low frequency in the samples, utterances comprising more than two independent clauses conjoined by and were broken preceding the second conjunction, in order to avoid spurious lengthening due to clausal chaining. Clauses joined by other conjunctions (such as after, before, but, if, when) were included in a single utterance.
The reliability of conversational sample transcription was monitored on a continuous basis. Examiners were trained to 85% point-to-point agreement or better with trained transcribers on three transcripts prior to carrying out independent sampling and transcription. Early on, transcripts were checked by second and third transcribers for possible errors, with any disagreements resolved through consensus. Given the labor demands for this system and a very low rate of disagreements, the system evolved to one of routinely assigned inter-examiner reliability calculations, with pair-wise assignments across the pool of examiner/transcribers. In tandem with the reliability assignments, a system of transcription checking was carried out by a trained research assistant. Transcripts were processed by a lab software program designed to flag potential errors. Feedback was provided to examiner/transcribers on a regular basis to correct any drift in coding conventions or to highlight creeping vigilance errors.
Inter-examiner point-to-point reliability summarized as the proportion of agreements is available for 105 transcripts originally transcribed by the examiner who collected the sample and re-transcribed from the audio records by a trained examiner who did not collect the sample. For the control group, 34 transcripts yielded the following average point-to-point agreement reliabilities: Utterance boundaries, 94.1; words, 88.25; morphemes, 98.83. Inter-examiner point-to-point agreement reliabilities for 71 transcripts from the affected group were: Utterance boundaries, 94.51; words, 86.32; morphemes, 98.67.
Calculation of the percentage intelligible utterances, total number of complete and intelligible utterances, MLU in morphemes and in words was carried out by the SALT software (Miller & Chapman, 1991).
RESULTS
Final sample description
In order to maximize the information to be gleaned from the longitudinal archive, only one sample per child was included within a given 6-month age interval but different samples from the same child could be included across age intervals. This convention was necessary because in the scheduling of children and families, occasionally two sessions occurred within the planned 6-month interval; for example, a child could be seen at 60 months and again at 65 months, two weeks. For the analysis reported here, the second time of assessment would be treated as within the 66–72 month age level, assuming no other assessment in that time window. As shown in Figure 1, the number of samples per child varied from 1 to 11. For example, 43 children had one sample included; 46 had 6 samples; 14 had 4 samples, and so on. All together, there were 1564 samples in the analyses: 912 from affected children and 652 from control children.
Figure 1.
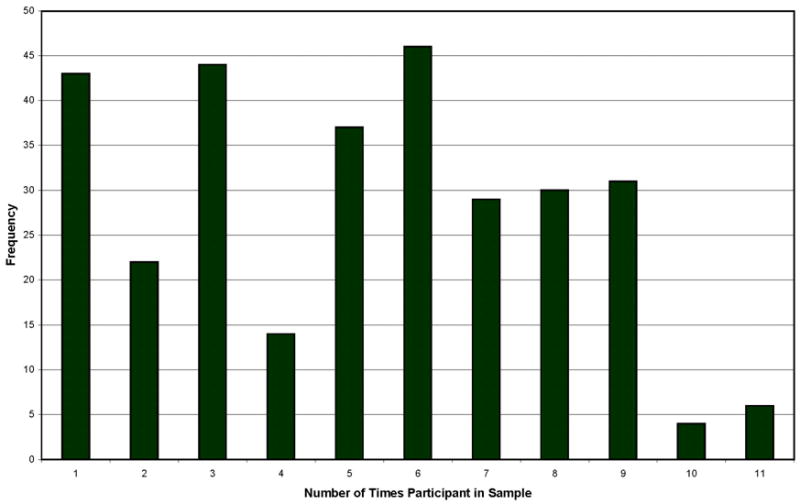
Number of times of measurement per participant
Table 1 reports the children’s initial language and non-verbal IQ mean scores and standard deviations per group, along with the mother’s education levels per group. Note that, as expected, the affected group’s language performance is, on average, more than one standard deviation below the age-referenced means, and the unaffected group’s performance is a bit above the mean on the omnibus language assessment and at the mean on the PPVT-R. The TEGI scores can be interpreted as the percentage of correct use of finiteness markers in obligatory contexts. The group outcomes, collapsing across all the initial age levels, show that the affected group averaged about 45% obligatory use of finiteness markers and the unaffected group about 78% use.
Table 1.
Initial language and non-verbal IQ mean scores per group
| Affected | Unaffected | |||
|---|---|---|---|---|
| Mean | SD | Mean | SD | |
| Omnibus1 | 80.88 | 10.95 | 108.06 | 14.27 |
| PPVT2 | 83.06 | 13.03 | 101.65 | 10.22 |
| TEGI3 | 44.87 | 28.25 | 77.91 | 27.5 |
| Non-verbal IQ4 | 96.5 | 9.57 | 104.59 | 9.64 |
| Mother’s Education5 | 2.77 | 1.25 | 3.87 | 1.38 |
Omnibus Language is the summative standard score for Test of Early Language Development (TELD-3), Test of Language Development-Primary 2nd Edition (TOLD P:2), or Clinical Evaluation of Language Fundamentals 3rd Edition (CELF-3)
PPVT-R =standard score for Peabody Picture Vocabulary Test-Revised (PPVT-R)
TEGI = composite grammar score for Test of Early Grammatical Impairment
Non-verbal IQ = standard score for The Columbia Mental Maturity Scale (CMMS) or Wechsler Intelligence Scale for Children 3rd Edition (WISC-III)
Mother’s educational level where 1=Some high school, no diploma, 2=High school graduate, diploma, or GED, 3=Some college, no degree, 4=Bachelor’s degree, 5=Some graduate work, 6=Graduate degree
It is possible that the validity of the initial grouping according to affectedness could drift with age, in the event that at the upper age levels the affected group “outgrew” language impairment. Table 2 reports the means and standard deviations for the children’s age in days, and concurrent omnibus language and PPVT-R standard scores, TEGI Composite Grammar score, and Non-verbal IQ score per age level per group. Note that at the youngest ages nonverbal IQ assessments were not available, although for each of the children in the young age intervals there are nonverbal IQ assessments available at later age levels that confirm performance above the cut-off level of 85. It is clear that the affected group is within the normal range of nonverbal IQ per interval, although, as in other samples of children with SLI, the group tends to score somewhat below the age comparison children. The data confirm that the groups are closely matched within age levels, and the grouping variable sustains validity over time.
Table 2.
Means and standard deviation for age and non-verbal IQ per group
| Age (Days) | Age (Y, M) | Omnibus Language | PPVT | TEGI Comp Grammar | Non-verbal IQ | ||||||||||||
|---|---|---|---|---|---|---|---|---|---|---|---|---|---|---|---|---|---|
| Group | Age Range |
Mean | SD | Mean | SD | Mean | SD | Cohen’s d Effect size |
Mean | SD | Cohen’s d Effect size |
Mean | SD | Cohen’s d Effect size |
Mean | SD | Cohen’s d Effect size |
| Affected | 2;6 - 2;11 | 1033 | 66 | 2,3 | 0,2 | 92.00 | 15.67 | 2.32 | 74.40 | 11.78 | 2.65 | -- | -- | -- | -- | -- | -- |
| 3;0 - 3;5 | 1204 | 59 | 3,4 | 0,2 | 99.10 | 16.43 | 0.93 | 88.92 | 9.88 | 1.00 | 22.02 | 19.24 | 1.12 | -- | -- | -- | |
| 3;6 - 3;11 | 1369 | 51 | 3,9 | 0,2 | 88.57 | 10.54 | 1.66 | 84.36 | 17.19 | 1.05 | 29.07 | 25.92 | 1.28 | 101.43 | 7.61 | 0.45 | |
| 4;0 - 4;5 | 1554 | 58 | 4,3 | 0,2 | 81.25 | 8.52 | 2.24 | 83.00 | 15.33 | 2.05 | 37.35 | 23.26 | 2.05 | 97.62 | 11.03 | 0.87 | |
| 4;6 - 4;11 | 1741 | 62 | 4,9 | 0,2 | 81.78 | 8.90 | 2.50 | 81.58 | 11.01 | 2.10 | 44.50 | 23.45 | 2.81 | 95.78 | 10.67 | 0.90 | |
| 5;0 - 5;5 | 1924 | 58 | 5,3 | 0,2 | 83.47 | 7.74 | 2.45 | 85.30 | 12.90 | 1.77 | 54.39 | 23.36 | 2.42 | 96.41 | 9.79 | 1.04 | |
| 5;6 - 5;11 | 2105 | 54 | 5,9 | 0,2 | 79.74 | 8.94 | 2.12 | 84.70 | 11.48 | 1.97 | 59.84 | 25.74 | 2.70 | 97.41 | 10.66 | 0.79 | |
| 6;0 - 6;5 | 2286 | 54 | 6,3 | 0,2 | 78.39 | 9.97 | 2.76 | 87.52 | 13.39 | 1.98 | 67.40 | 25.88 | 2.95 | 91.70 | 12.48 | 1.31 | |
| 6;6 - 6;11 | 2470 | 55 | 6,9 | 0,2 | 81.64 | 9.99 | 1.53 | 85.73 | 11.00 | 1.79 | 77.14 | 19.24 | 2.73 | 95.09 | 13.18 | 0.68 | |
| 7;0 - 7;5 | 2645 | 60 | 7,3 | 0,2 | 79.17 | 13.88 | 2.11 | 88.34 | 11.85 | 1.31 | 79.90 | 19.01 | 1.04 | 92.78 | 13.42 | 0.68 | |
| 7;6 - 7;11 | 2833 | 63 | 7,9 | 0,2 | 82.88 | 11.90 | 2.23 | 85.18 | 11.74 | 1.77 | 85.59 | 14.49 | 1.58 | 93.88 | 14.25 | 0.71 | |
| 8;0 - 8;5 | 3016 | 56 | 8,3 | 0,2 | 79.33 | 14.18 | 2.76 | 87.52 | 13.19 | 1.22 | 87.80 | 11.00 | 2.95 | 94.73 | 15.31 | 1.00 | |
| 8;6 - 8;11 | 3188 | 54 | 8,9 | 0,2 | 82.02 | 13.83 | 2.29 | 86.27 | 13.60 | 1.90 | 89.26 | 15.02 | 1.30 | 99.05 | 17.25 | 0.69 | |
| Unaffected | 2;6 - 2;11 | 1020 | 62 | 2,9 | 0,2 | 123.47 | 13.54 | -- | 99.53 | 9.49 | -- | -- | -- | -- | -- | -- | -- |
| 3;0 - 3;5 | 1192 | 56 | 3,3 | 0,2 | 116.33 | 18.61 | -- | 99.77 | 10.84 | -- | 56.26 | 30.59 | -- | -- | -- | -- | |
| 3;6 - 3;11 | 1366 | 57 | 3,9 | 0,2 | 107.55 | 11.40 | -- | 99.32 | 14.20 | -- | 66.35 | 29.23 | -- | 105.82 | 9.75 | -- | |
| 4;0 - 4;5 | 1550 | 56 | 4,3 | 0,2 | 103.63 | 9.97 | -- | 104.23 | 10.37 | -- | 82.28 | 21.92 | -- | 105.30 | 8.84 | -- | |
| 4;6 - 4;11 | 1740 | 52 | 4,9 | 0,2 | 108.22 | 10.59 | -- | 103.43 | 10.41 | -- | 86.55 | 14.97 | -- | 105.88 | 11.20 | -- | |
| 5;0 - 5;5 | 1923 | 54 | 5,3 | 0,2 | 106.39 | 9.35 | -- | 105.97 | 11.71 | -- | 88.50 | 14.08 | -- | 107.25 | 10.46 | -- | |
| 5;6 - 5;11 | 2096 | 55 | 5,9 | 0,2 | 100.96 | 10.00 | -- | 106.60 | 11.11 | -- | 91.91 | 11.86 | -- | 106.87 | 11.96 | -- | |
| 6;0 - 6;5 | 2270 | 55 | 6,3 | 0,2 | 105.71 | 9.91 | -- | 110.08 | 11.41 | -- | 93.46 | 8.83 | -- | 109.82 | 13.83 | -- | |
| 6;6 - 6;11 | 2459 | 50 | 6,9 | 0,2 | 100.96 | 12.66 | -- | 103.81 | 10.10 | -- | 96.40 | 7.04 | -- | 104.94 | 14.56 | -- | |
| 7;0 - 7;5 | 2639 | 52 | 7,3 | 0,2 | 104.17 | 11.86 | -- | 105.96 | 13.41 | -- | 94.87 | 14.33 | -- | 101.91 | 13.37 | -- | |
| 7;6 - 7;11 | 2832 | 49 | 7,9 | 0,2 | 105.29 | 10.05 | -- | 106.12 | 11.85 | -- | 96.40 | 6.83 | -- | 103.29 | 13.18 | -- | |
| 8;0 - 8;5 | 3011 | 47 | 8,3 | 0,2 | 102.33 | 8.33 | -- | 103.24 | 12.87 | -- | 98.17 | 3.51 | -- | 106.35 | 11.65 | -- | |
| 8;6 -8;11 | 3177 | 43 | 8,8 | 0,1 | 102.00 | 8.73 | -- | 103.92 | 9.28 | -- | 96.61 | 5.67 | -- | 110.26 | 16.14 | -- | |
On language assessments the affected group persistently scores below the unaffected group without any apparent gain in standard scores over time. The group effect sizes are reported in Table 2 as Cohen’s d (Cohen, 1988, pp. 20–22), an index that expresses score differences in standard deviation units. As expected, the group effect sizes are large for the language measures, in the range of .93 to 2.95, indicating that the affected children persist in scoring one or more standard deviations below the unaffected children, on average, throughout the 2;6–9;0 age range. Another way to describe the group differences is in terms of Cohen’s U measure (Cohen, 1988), which provides an estimate of the extent to which the two distributions overlap. U3 provides an estimate of the percentage of the affected sample which the upper half of the cases of the control sample exceeds (Cohen, 1988, p. 21–22). When d = 0, U3 = 50%. In the range of d scores for the omnibus language, PPVT-R and TEGI scores, U3 = 81.6 to 99.9%, suggesting that the upper half of the unaffected group scores above most if not all of the affected sample, showing much separation of the groups’ distributions. In contrast, the d values for the Nonverbal IQ variable are smaller, in the range of .45 to 1.31. The corresponding U3 values are 65.5 to 90.3, showing less separation of the groups’ distributions. Overall, the patterns of group differences over age intervals verify the validity of the grouping variable over time.
Figures clearly illustrate the consistency across time. Figure 2 reports the mean omnibus language standard scores per group for each age level; Figure 3 reports the PPVT-R standard scores; Figure 4, the TEGI Grammar Composite Score; and Figure 5 the Nonverbal-IQ scores per group per age level. These performance estimates were available on an annual basis. The data reported here are the closest available scores per 6-month interval.
Figure 2.

Mean omnibus language standard scores per group per age level
Figure 3.

Mean PPVT scores per group per age level
Figure 4.

TEGI grammar composite per group per age level
Figure 5.

Mean levels of non-verbal IQ per group per age level
Transcript analyses data: Sample size and MLU words and morphemes
The calculation of MLU requires sufficient numbers of intelligible utterances per sample. Table 3 reports the percentage of intelligible utterances calculated for the samples, the total number of utterances, and the complete and intelligible utterances. Figure 6 depicts the percentage of intelligible utterances, where it is apparent that overall the percentage of intelligible utterances is high in the samples for both groups. Even so, as expected, intelligibility is more of an issue for samples from younger children, especially for the younger affected group. The d values range from −.02 to1.94, with the higher values in the lower ages, 2;6 to 4;11. In the younger ages, the d values of .81 to 1.94 yield U3 values of 78.8 to 97%, indicating separation of the distributions. In the older ages, the d values of 0 to .73 yield U3 values of 50 to 75.8%, showing considerable overlap. The lower intelligibility at the younger ages may be attributed to several factors, including clarity of speech and/or likelihood of vocabulary choices or phrases used. In comparison, the mean total number of utterances is very similar across groups, ranging from 235.2 to 292.1, with small values of d, in a range of 0 to .48, showing a high level of overlap, U3 in a range of 50 to 69%.
Table 3.
Means and standard deviation for intelligibility and number of utterances per group
| Intelligibility | Total Utterances | C & I Utterances | |||||||||
|---|---|---|---|---|---|---|---|---|---|---|---|
| Group | Age Range | N | Mean | Std Dev | Cohen’s d Effect Size | Mean | Std Dev | Cohen’s d Effect Size | Mean | Std Dev | Cohen’s d Effect Size |
| Affected | 2;6 - 2;11 | 6 | 0.74 | 0.15 | 1.10 | 235.2 | 63.3 | 0.48 | 155.5 | 54.8 | 0.95 |
| Affected | 3;0 - 3;5 | 15 | 0.79 | 0.16 | 1.94 | 261.3 | 78.0 | 0.14 | 177.6 | 66.2 | 0.73 |
| Affected | 3;6 - 3;11 | 24 | 0.84 | 0.08 | 0.81 | 249.0 | 89.3 | 0.13 | 176.8 | 66.4 | 0.48 |
| Affected | 4;0 - 4;5 | 54 | 0.83 | 0.12 | 1.08 | 282.6 | 93.8 | 0.00 | 198.2 | 76.4 | 0.36 |
| Affected | 4;6 - 4;11 | 72 | 0.87 | 0.10 | 1.11 | 284.7 | 71.3 | −0.08 | 213.2 | 63.5 | 0.27 |
| Affected | 5;0 - 5;5 | 84 | 0.91 | 0.06 | 0.67 | 292.1 | 76.2 | −0.29 | 223.1 | 55.8 | 0.01 |
| Affected | 5;6 - 5;11 | 97 | 0.91 | 0.06 | 0.57 | 289.0 | 83.6 | −0.14 | 222.5 | 64.3 | 0.02 |
| Affected | 6;0 - 6;5 | 108 | 0.92 | 0.06 | 0.30 | 275.7 | 86.1 | 0.18 | 217.2 | 68.4 | 0.26 |
| Affected | 6;6 - 6;11 | 94 | 0.92 | 0.06 | 0.23 | 281.2 | 97.0 | 0.05 | 214.5 | 73.1 | 0.17 |
| Affected | 7;0 - 7;5 | 103 | 0.92 | 0.06 | 0.57 | 277.0 | 97.9 | −0.02 | 217.1 | 77.0 | 0.06 |
| Affected | 7;6 - 7;11 | 100 | 0.92 | 0.06 | 0.18 | 280.0 | 89.0 | −0.09 | 217.4 | 76.5 | 0.01 |
| Affected | 8;0 - 8;5 | 94 | 0.93 | 0.06 | 0.73 | 266.1 | 91.8 | 0.13 | 212.4 | 78.5 | 0.21 |
| Affected | 8;6 - 8;11 | 61 | 0.94 | 0.05 | −0.02 | 289.7 | 93.9 | −0.10 | 227.9 | 76.9 | 0.00 |
| Unaffected | 2;6 - 2;11 | 17 | 0.86 | 0.11 | 265.6 | 64.0 | 219.1 | 66.6 | |||
| Unaffected | 3;0 - 3;5 | 29 | 0.91 | 0.06 | 271.5 | 74.5 | 219.1 | 56.9 | |||
| Unaffected | 3;6 - 3;11 | 38 | 0.92 | 0.09 | 256.2 | 53.8 | 203.9 | 56.6 | |||
| Unaffected | 4;0 - 4;5 | 49 | 0.91 | 0.08 | 282.6 | 75.3 | 224.2 | 72.7 | |||
| Unaffected | 4;6 - 4;11 | 74 | 0.94 | 0.06 | 278.1 | 77.6 | 232.0 | 69.8 | |||
| Unaffected | 5;0 - 5;5 | 78 | 0.94 | 0.05 | 274.0 | 62.7 | 223.6 | 51.0 | |||
| Unaffected | 5;6 - 5;11 | 77 | 0.94 | 0.05 | 278.2 | 79.9 | 224.0 | 65.0 | |||
| Unaffected | 6;0 - 6;5 | 70 | 0.93 | 0.05 | 291.2 | 86.2 | 236.3 | 72.2 | |||
| Unaffected | 6;6 - 6;11 | 63 | 0.93 | 0.07 | 285.7 | 96.6 | 228.3 | 80.6 | |||
| Unaffected | 7;0 - 7;5 | 51 | 0.94 | 0.04 | 275.6 | 90.3 | 221.5 | 77.4 | |||
| Unaffected | 7;6 - 7;11 | 47 | 0.93 | 0.06 | 271.5 | 94.5 | 218.0 | 79.3 | |||
| Unaffected | 8;0 - 8;5 | 41 | 0.95 | 0.04 | 278.0 | 92.9 | 229.7 | 81.8 | |||
| Unaffected | 8;6 – 8;11 | 18 | 0.93 | 0.06 | 280.1 | 98.6 | 228.2 | 80.6 | |||
Figure 6.

Intelligibility per group per age level
The number of complete and intelligible utterances generates the sample for analysis for MLU, adjusted for intelligibility. The means varied from 155.5 to 236, with the lowest values reflecting the higher proportion of unintelligible utterances in the younger affected group, depicted in Figure 7. Correspondingly, the d values are highest in the youngest five age levels, ranging from .27 to.95, with a U3 range of 57.9 to 81.6%. At the older ages the d values dropped to a range of 0 to.26, with a U3 range of 50 to 57.9%, showing almost the same distribution of the mean number of utterances to be subjected to analyses for the two groups. Overall, it is clear that the goal of 200 complete and intelligible utterances per sample was generally met for the unaffected groups across age levels and for the affected children from age 4;0–4;5. Below 4 years of age it is more challenging to obtain samples above an average of 150 complete and intelligible utterances in a time-efficient way, even with a seasoned and well-trained group of examiners.
Figure 7.

Complete and Intelligible Utterances per group per age level
The mean levels of MLU calculated from the complete and intelligible utterances are reported in Table 4, for MLU in words (MLUW) and morphemes (MLUM) per age level per group. The mean values for MLUW are depicted in Figure 8, and for MLUM, Figure 9. As expected, the two indices are highly correlated, r =.994 for the affected group; .992 for the unaffected group. The outcomes show that the affected groups perform at lower levels than the unaffected groups in mean levels of utterance length whether calculated by words or by morphemes across the age range sampled. The effect sizes are similar for both estimates, in the range of d = .57 to 1.22. The lower effect sizes are at the upper levels, where the unaffected children begin to asymptote and the affected children begin to close the gap somewhat. Through six years of age, d = .79 to1.22 with associated U3 estimates of 78.8 to 88.5%, indicating considerable non-overlap of the groups.
Table 4.
Means and standard deviation for MLU in words and morphemes per group
| MLUW | MLUM | |||||||
|---|---|---|---|---|---|---|---|---|
| Group | Age Range | N | Mean | Std Dev | Cohen’s d Effect Size | Mean | Std Dev | Cohen’s d Effect Size |
| Affected | 2;6 - 2;11 | 6 | 2.37 | 0.32 | 0.93 | 2.59 | 0.39 | 0.90 |
| Affected | 3;0 - 3;5 | 15 | 2.84 | 0.38 | 0.97 | 3.07 | 0.48 | 1.07 |
| Affected | 3;6 - 3;11 | 24 | 3.10 | 0.75 | 1.04 | 3.36 | 0.80 | 1.09 |
| Affected | 4;0 - 4;5 | 54 | 3.31 | 0.70 | 1.22 | 3.64 | 0.80 | 1.22 |
| Affected | 4;6 - 4;11 | 72 | 3.60 | 0.62 | 0.95 | 3.95 | 0.70 | 1.01 |
| Affected | 5;0 - 5;5 | 84 | 3.72 | 0.61 | 1.05 | 4.09 | 0.70 | 1.10 |
| Affected | 5;6 - 5;11 | 97 | 3.95 | 0.60 | 0.85 | 4.34 | 0.67 | 0.89 |
| Affected | 6;0 - 6;5 | 108 | 3.98 | 0.70 | 0.90 | 4.38 | 0.75 | 0.92 |
| Affected | 6;6 - 6;11 | 94 | 4.18 | 0.71 | 0.79 | 4.63 | 0.79 | 0.84 |
| Affected | 7;0 - 7;5 | 103 | 4.15 | 0.62 | 0.69 | 4.56 | 0.69 | 0.72 |
| Affected | 7;6 - 7;11 | 100 | 4.33 | 0.88 | 0.57 | 4.77 | 0.96 | 0.60 |
| Affected | 8;0 - 8;5 | 94 | 4.36 | 0.75 | 0.86 | 4.80 | 0.83 | 0.89 |
| Affected | 8;6 - 8;11 | 61 | 4.49 | 0.86 | 0.72 | 4.97 | 0.93 | 0.68 |
| Unaffected | 2;6 - 2;11 | 17 | 2.91 | 0.58 | 3.23 | 0.71 | ||
| Unaffected | 3;0 - 3;5 | 29 | 3.43 | 0.61 | 3.81 | 0.69 | ||
| Unaffected | 3;6 - 3;11 | 38 | 3.71 | 0.58 | 4.09 | 0.67 | ||
| Unaffected | 4;0 - 4;5 | 49 | 4.10 | 0.65 | 4.57 | 0.76 | ||
| Unaffected | 4;6 - 4;11 | 74 | 4.28 | 0.72 | 4.75 | 0.79 | ||
| Unaffected | 5;0 - 5;5 | 78 | 4.38 | 0.63 | 4.88 | 0.72 | ||
| Unaffected | 5;6 - 5;11 | 77 | 4.47 | 0.61 | 4.96 | 0.70 | ||
| Unaffected | 6;0 - 6;5 | 70 | 4.57 | 0.66 | 5.07 | 0.75 | ||
| Unaffected | 6;6 - 6;11 | 63 | 4.70 | 0.66 | 5.22 | 0.71 | ||
| Unaffected | 7;0 - 7;5 | 51 | 4.72 | 0.83 | 5.22 | 0.91 | ||
| Unaffected | 7;6 - 7;11 | 47 | 4.92 | 1.03 | 5.45 | 1.13 | ||
| Unaffected | 8;0 - 8;5 | 41 | 5.08 | 0.84 | 5.67 | 0.97 | ||
| Unaffected | 8;6 – 8;11 | 18 | 4.99 | 0.71 | 5.51 | 0.79 | ||
Figure 8.

Mean Length of Utterances - Words per group per age level
Figure 9.

Mean Length of Utterances - Morphemes per group per age level
Next we examined the extent to which the data in Table 4 aligns with the MLU normative data reported by Leadholm and Miller (1992), where means and standard deviations are reported per one year age intervals. Figure 10 depicts a comparison of the obtained levels of MLUM for the groups studied here and for the mean levels per age interval reported for the Wisconsin sample. Note that data for the two levels of 8-year-old data are not available for the Wisconsin sample, so the 9-year data from that sample is included in the figure to depict the upper time of measurement. Relative to the data reported in Table 4 for the control group, the Wisconsin data show lower average performance for the 3-to-5-year-old children but from 5 years onward the Wisconsin sample means are higher.
Figure 10.

Comparision of Mean MLU in Morphemes for Kansas sample and SALT sample (Leadholm & Miller, 1992)
We investigated a possible association of mother’s education to children’s MLU levels in the two groups by calculating Pearson product moment correlations. At the initial time of measurement, the correlation of mother’s education and MLU for the affected group was r (169) = −.038, n.s. and for the unaffected group, r (135) = −.154, n.s.. To examine if there might be age influences on the correlations, they were recalculated with a MLU z score, based on the Leadholm and Miller (1992) means and standard deviations. The obtained correlations were also non-significant. The correlations were then calculated for 3 age levels within each group defined as 2;6 to 4;11;5;6 to 6;11 years; and 7;0 to 9;0 years. Only the unaffected 5;0-to-6;11-year-old group yielded a significant correlation, r (36) = −.358, p = .03, suggesting higher MLU levels for the children of less well educated mothers. Overall, in these samples there was no evidence of an advantage in MLU growth for the children of better educated mothers at the initial time of assessment. This is consistent with the finding of Rice, et al, (2006), who report that mother’s education did not predict growth or intercept in their longitudinal study. The lack of correlation is inconsistent with the finding of Dollaghan et al (1999), who report statistically significant linear trends across maternal education levels for MLUM for their sample of three-year-old children. The wider age range of the current study perhaps presents a stronger test of this issue.
Finally, an intraclass correlation (ICC) was calculated to examine possible familial dependencies among the siblings in the samples. The ICC is an estimate of the average correlation among people from the same family. In this sample the ICC for the MLUM is .21, suggesting the dependency is small. The low ICC increases confidence that the obtained values will generalize to independently selected samples.
Discussion
The data reported here provide detailed documentation of MLU levels for children with SLI and children without language impairment, broken out by 6-month intervals, from 2;6 to 8;11. This comprises the first report of a control sample with full documentation of ethnicity, mother’s education levels, children’s nonverbal intelligence and performance on omnibus language measures and concurrent measures of receptive vocabulary and morphosyntax. Further, this is also the first report of an affected group drawn from the same general population as the unaffected children, and with the same detailed descriptive cognitive and language data. The sampling methods are consistent across the database; reliability estimates are provided for transcription and coding. A further, and important, strength is the relatively large number of complete and intelligible utterances that serve as the basis for calculation of the MLU. Except at the youngest levels, the size of the utterance collection exceeds the standards reported by Gavin and Giles (1996) as suitable for acceptable reliability of calculation.
The results are intended to be used for clinical purposes, as an estimate of how a particular child’s performance compares to age expectations for a group of children who perform in the normal range on external assessments of language and for a group of children who perform in the clinical range on language assessments. The findings are consistent with the call of Leadholm and Miller (1992) for practitioners to obtain samples of children’s spontaneous language as part of a full clinical assessment. At the same time, the difference in normative estimates from the samples in this study compared to those reported by Leadholm and Miller (1992) highlights the value of different sources of normative information, for determining whether a child meets the expectations for his or her age level.
An example of potential application of the outcomes is indicated in the position statement of Tager-Flusberg et al., 2009. This paper reports on the work of an expert panel charged with the task of identifying recommended measures to be used in evaluating language intervention outcomes with children with autism spectrum disorders, and to propose a common terminology for describing levels of language ability. The panel suggested MLU in morphemes as a possible outcome measure in the domain of grammar in the age range of 30–48 months. An MLUM of 3.0 is set as the benchmark for children age 36 months. As shown in Figure 10 from the results of this study, this would be a conservative estimate relative to the control children in this sample, although it would be similar to the normative estimate of the Wisconsin norms. The mean MLUM in the sample of 3;6–3;11 affected children in the study reported here is 3.36, a level close to the normative estimate in the Leadholm and Miller (1992) sample at that age. The variations in these estimates pose reason for caution in interpreting MLU levels in young children. This is not to say that MLU is an inappropriate measure for benchmarking intervention outcomes. To the contrary, it is a valuable estimate of a youngster’s generative language ability.
One possible reason for the difference in outcomes between the estimates of this study and those of Leadholm and Miller (1992) is sampling differences. The children in the Madison sample may have had higher verbal ability than the samples reported in this study. The point here is that there is value in having comparison groups whose language and nonverbal levels of performance are documented for the purpose of comparison. Our position is that more information of this sort will be helpful to the field.
Also important for clinical interpretations is the issue of sampling methods. Differences in sampling methods are well known possible contributors to variation in MLU estimates (cf. Eisenberg et al, 2001). Leadholm and Miller (1992) used conversational methods involving play with clay, activities from classroom units, and the introduction of topics absent in time and space. Although generally similar, the sampling methods used here focused on the play activities with the same set of toys across children, without systematic queries about school activities or topics absent in time and space. It is possible that the former approach elicited more complete or complex sentences with older children.
For research purposes, the issue of how to compare outcomes across samples also applies more generally to the study of children with and without language impairments. One difficulty now is how to reconcile different experimental findings across studies given possible differences in sampling. The findings reported here allow for use of obtained MLU values as a way of comparing to samples of particular ages of children known to have language impairments without other disabilities, or known to have language performance above the cut-off for language impairments. Although this method of sample referencing is not perfect, it will provide an improvement over the limited approaches now available.
It is noteworthy that the outcomes are consistent with the findings of Rice, Redmond and Hoffman (2006). This is not simply a matter of the same children in Rice, Redmond and Hoffman (2006) and this study; the longitudinal component of the earlier study used only 20 of the 170 affected children in the study reported here and 18 of the 136 unaffected children. The generalization of interest is that although children with SLI increase their MLU over time, they do not close the MLU gap at the upper age levels. The effect sizes are large until around 7 years of age, when they drop to the medium-to-large range, suggesting that MLU values are sensitive to language impairment throughout the age levels for which MLU is a reliable and valid index. Thus the widely adopted assumption that MLU values above 4.0 are not reliable is not supported here. With appropriate care in sampling and transcription methods, the MLU in words or morphemes yields reliable and age-validated estimates of children’s language growth.
Finally, a caveat must be issued that although the mixture of cross-sectional and longitudinal measures available in the archive provides relatively large numbers of children in both groups of children per age level, this mixture also engenders cautions in interpretation. This is neither a classic cross-sectional method, nor a classic longitudinal, growth curve method. Even with these limitations, the findings provide valuable descriptive information for clinical and research applications, particularly for the purpose of referencing a child’s performance or that of a sample of children to a sample with known language and nonverbal intelligence levels as well as known dimensions of the sample size and sampling procedures.
Acknowledgments
We would like to thank the research assistants and students in Rice’s Language Acquisition Studies lab at the University of Kansas for data collection and data processing. Finally, we appreciate the time and effort of the children and their families who participated. This research was funded by the National Institutes of Health P30DC005803, R01DC001803, and R01DC005226 to Mabel Rice, as well as by the University of Kansas Intellectual and Developmental Disabilities Research Center P30HD002528.
Contributor Information
Mabel L. Rice, University of Kansas
Filip Smolik, Institute of Psychology AS CR, Prague.
Denise Perpich, University of Kansas.
Travis Thompson, University of Kansas.
Nathan Rytting, Emporia Public Schools.
Megan Blossom, University of Kansas.
References
- Brown R. A first language: The early stages. Cambridge, MA: Harvard University Press; 1973. [Google Scholar]
- Burgemeister BB, Blum LH, Lorge I. Columbia Mental Maturity Scale. San Antonio, TX: Psychological Corporation; 1972. [Google Scholar]
- Cohen J. Statistical Power Analyses for the Behavioral Sciences. 2. Hillsdale, New Jersey: Lawrence Erlbaum; 1988. [Google Scholar]
- Dollaghan CA, Campbell TF, Paradise JL, Feldman HM, Janosky JE, Pitcairn DN, et al. Maternal education and measures of early speech and language. Journal of Speech, Language, and Hearing Research. 1999;42(6):1432–1443. doi: 10.1044/jslhr.4206.1432. [DOI] [PubMed] [Google Scholar]
- Dunn A, Dunn A. Peabody Picture Vocabulary Test-Revised. Circle Pines, MN: American Guidance Service; 1981. [Google Scholar]
- Eisenberg SL, Fersko TM, Lundgren C. The use of MLU for identifying language impairment in preschool children: A review. American Journal of Speech-Language Pathology. 2001;10:323–342. [Google Scholar]
- Falcaro M, Pickles A, Newbury DG, Addis L, Banfield E, Fisher SE, et al. Genetic and phenotypic effects of phonological short-term memory and grammatical morphology in specific language impairment. Genes, Brain and Behavior. 2008;7:393–402. doi: 10.1111/j.1601-183X.2007.00364.x. [DOI] [PubMed] [Google Scholar]
- Gavin WJ, Giles L. Sample size effects on temporal reliability of language sample measures of preschool children. Journal of Speech and Hearing Research. 1996;39:1258–1262. doi: 10.1044/jshr.3906.1258. [DOI] [PubMed] [Google Scholar]
- Goldman R, Fristoe M. Goldman Fristoe Test of Articulation- 2. Circle Pines, MN: American Guidance Service; 2000. [Google Scholar]
- Hresko WR, Kim Reid D, et al. Test of Early Language Development (TELD-3) Austin, TX: Pro-Ed; 1999. [Google Scholar]
- Leadholm B, Miller J. Language Sample Analysis: The Wisconsin guide. Milwaukee: Wisconsin Department of Instruction; 1992. [Google Scholar]
- Leonard LB. Children with specific language impairments. Cambridge, MA: MIT Press; 1998. [Google Scholar]
- MacWhinney B. The CHILDES project: Tools for analyzing talk. 3. Mahwah, NJ: Lawrence Erlbaum Associates; 2000. [Google Scholar]
- Miller JF. Assessing Language Production in Children. Baltimore, MD: University Park Press; 1981. [Google Scholar]
- Miller JF, Chapman RS. Systematic analysis of language transcripts (SALT software) Madison: University of Wisconsin Language Analysis Laboratory; 1991. [Google Scholar]
- Miller JF, Chapman RS. Systematic analysis of language transcripts (SALT software) 7. Madison: University of Wisconsin Language Analysis Laboratory; 2002. [Google Scholar]
- Miller JF, Chapman RS. Systematic analysis of language transcripts (SALT software) 8. Madison: University of Wisconsin Language Analysis Laboratory; 2008. [Google Scholar]
- Newcomer PL, Hammill DD. Test of Language Development-Primary (TOLD-P:2) 2. Austin, TX: Pro-Ed; 1988. [Google Scholar]
- Nice MM. Length of sentences as a criterion of a child’s progress in speech. Journal of Educational Psychology. 1925;16:370–379. [Google Scholar]
- Rice ML, Ash A, Betz S, Francois J, Kepler A, Klager E, Smolik F. Transcription and coding manual for analysis of language samples: Kansas Language Transcript Database. Lawrence: University of Kansas; 2004. [Google Scholar]
- Rice ML, Redmond SM, Hoffman L. Mean length of utterance in children with specific language impairment and in younger control children shows concurrent validity, stable and parallel growth trajectories. Journal of Speech, Language, and Hearing Research. 2006;49:793–808. doi: 10.1044/1092-4388(2006/056). [DOI] [PubMed] [Google Scholar]
- Rice ML, Warren SF, Betz S. Language symptoms of developmental language disorders: An overview of autism, down syndrome, fragile X, specific language impairment, and Williams syndrome. Applied Psycholinguistics. 2005;26:7–28. [Google Scholar]
- Rice ML, Wexler K. Rice/Wexler Test of Early Grammatical Impairment. San Antonio, TX: The Psychological Corporation; 2001. [Google Scholar]
- Semel EM, Wiig E, Secord W. Clinical Evaluation of Language Fundamentals. 3. San Antonio, TX: Psychological Corporation; 1995. [Google Scholar]
- Seymour HN, Roeper TW, deVilliers J. Diagnostic Evaluation of Language Variation. San Antonio, TX: The Psychological Corporation; 2003. [Google Scholar]
- Shriberg LD, Tomblin JB, McSweeny JL. Prevalence of speech delay in 6-year-old children and comorbidity with language impairment. Journal of Speech, Language and Hearing Research. 1999;42:1461–1481. doi: 10.1044/jslhr.4206.1461. [DOI] [PubMed] [Google Scholar]
- Tager-Flusberg H, Rogers S, Cooper J, Landa R, Lord C, Paul R, Rice M, Stoel-Gammon C, Wetherby A, Yoder P. Defining language benchmarks and selecting measures of language development for young children with Autism Spectrum Disorders. Journal of Speech, Language & Hearing Research. 2009;52:643–652. doi: 10.1044/1092-4388(2009/08-0136). [DOI] [PMC free article] [PubMed] [Google Scholar]
- Tomblin JB, Records NL, Buckwalter P, Zhang X, Smith E, O’Brien M. The prevalence of specific language impairment in kindergarten children. Journal of Speech and Hearing Research. 1997;40:1245–1260. doi: 10.1044/jslhr.4006.1245. [DOI] [PMC free article] [PubMed] [Google Scholar]
- Wechsler D. Wechsler Intelligence Scale for Children-third edition. San Antonio, TX: The Psychological Corporation; 1991. [Google Scholar]
- Zhang X, Tomblin JB. The association of intervention receipt with speech-language profiles and social-demographic variables. American Journal of Speech-Language Pathology. 2000;9:345–357. [Google Scholar]