Abstract
A comparative phenotype analysis of 24 Listeria monocytogenes LO28 stress-resistant variants obtained after high-pressure treatment was performed to assess their robustness and growth performance under a range of food-relevant conditions. In addition, genetic analysis was conducted to characterize the promoter regions and open reading frames of the class I and III transcriptional repressors CtsR and HrcA, which control production of specific sets of stress proteins. Analysis of stress survival capacity, motility, biofilm formation, and growth under various conditions showed all variants to be more resistant to pressure and heat than the wild type; however, differences among variants were observed in acid resistance, growth rate, motility, and biofilm-forming capacity. Genetic analysis revealed no variation in the genetic make-up of hrcA and its upstream region, but two variants had deletions in the upstream region of ctsR and seven variants had mutations in the ctsR gene itself. The results of the characterization were cluster analyzed to obtain insight into the diversity of variants. Ten unique variants and three clusters with specific features could be identified: one cluster consisting of seven variants having a mutation in the CtsR regulator gene, one cluster containing two variants with an aerobic biofilm formation capacity similar to that of the wild type, and a cluster composed of five immotile variants. The large population diversity of L. monocytogenes stress-resistant variants signifies the organism's genetic flexibility, which in turn may contribute to the survival and persistence of this human pathogen in food-processing environments.
The opportunistic pathogen Listeria monocytogenes causes listeriosis, a serious infection that most commonly affects newborns, pregnant women, seniors, and immune-compromised patients. Because L. monocytogenes is ubiquitous it may be introduced into food-processing plants through many different routes. L. monocytogenes has been shown to colonize processing environments and to contaminate products during processing. Certain strains may become persistent in a plant and cause continuous contamination (18, 20, 27). The ability of part of a population to survive in a certain environment because of heterogeneity is called persistence. However, there is a difference between survivors that are phenotypically switching between normal cells and persister cells and survivors that are mutated and therefore genetically different (7). Although the origin of persistence can be different, overall persisters can have specific qualities, such as acid and heat tolerance and adherence to surfaces, contributing to the establishment of house strains. A number of studies have shown persistence of L. monocytogenes in various food-processing plants (6, 17, 19, 21, 22). Some of these persistent strains dominated and persisted in a plant or production line for years and caused food contamination and human disease. The generation, occurrence, and selection of these persistent strains can have a significant impact on food processing and safety.
Heterogeneity in a population with an effect on resistance was also observed in the use of the relatively new nonthermal food-processing technology of high hydrostatic pressure (HHP). HHP inactivation of food-borne pathogens has been studied extensively (1, 4, 9). The obtained inactivation curves rarely followed first-order kinetics, as tailing was observed frequently (2, 24, 28). This tailing can indicate heterogeneity in a population with the presence of HHP-sensitive and HHP-resistant fractions. The occurrence of these different fractions has previously been shown for three L. monocytogenes strains. The fraction of resistant cells in the initial population of these strains was estimated to be between 8 × 10⁻⁶ and 3 × 10⁻⁵ (28), and both phenotypic switching and stable piezotolerant variants could be isolated. These stable resistant variants formed 25 to 40% of this fraction of resistant cells for two of the tested strains, LO28 and Scott A (28). Genetic diversity of Scott A stable variants was demonstrated, as over 60% of these variants had a mutation in the ctsR gene, which encodes the class III heat shock response regulator. These CtsR variants were nonmotile, resistant to heat and low pH, and displayed reduced growth rates (12, 13). In vivo assays with a selected ΔGly-CtsR L. monocytogenes Scott A variant (AK01) revealed reduced virulence potential (15). The other Scott A stable variants have unknown mutations (14). Stable HHP-resistant variants of other food-borne pathogens, including Staphylococcus aureus (16) and Escherichia coli (8, 24), have also been isolated. A few of their phenotypic characteristics have been described, and the studies revealed only diversity in heat resistance among the resistant variants.
The phenotype for stress-resistant variants in previous research was described for only a few characteristics. The current study describes an extensive characterization, as a thorough investigation of the phenotype not only gives more information about the mechanisms playing a role in resistance but also might even reveal the origin of the resistance. Twenty-four L. monocytogenes LO28 stable HHP-resistant variants (28) were characterized for a range of phenotypic features, including stress survival capacity, motility, biofilm formation, hemolysis capacity, growth under various conditions, and selected genetic characteristics. Diversity within this population of stable stress-resistant L. monocytogenes variants was sorted by cluster analysis, and the impact on safety of HHP-processed foods and production environments is discussed.
MATERIALS AND METHODS
Bacterial strains and cell culturing conditions.
Listeria monocytogenes LO28 (Department of Agrotechnology and Food Sciences, Wageningen University and Research Centre, Netherlands) and 24 LO28 piezotolerant variants (28) were used in this study. These variants had been isolated after three independent HHP treatments at 350 MPa for 20 min at 20°C from an initial population of approximately 3 × 10⁹ cells. Stock cultures of all strains were kept in 15% (vol/vol) glycerol (Fluka, Buchs, Switzerland) at −80°C, and before the experiments, cells from stock were grown for 2 days at 30°C on brain heart infusion (BHI) agar (Oxoid, Hampshire, England). A single colony was used to start a preculture of 10 ml of BHI broth. After 20 h of growth at 30°C in an incubator (refrigerated incubator shaker Innova 4335; New Brunswick Scientific, Edison, NJ) with shaking at 160 rpm, 0.5% (vol/vol) inoculum was added to 100 ml of BHI broth. Cultures were used for different inactivation or growth experiments, and each experiment was reproduced at least two times on different days.
High hydrostatic pressure inactivation.
High hydrostatic pressure inactivation was performed as described previously by Van Boeijen et al. (28). Briefly, cells grown in BHI at 30°C, 160 rpm, from the exponential (5 h) or stationary growth (20 h) phase were subjected to 350 MPa at 20°C in 50 mM N-(2-acetamido)-2-aminoethanesulfonic acid (ACES) buffer (pH 7.0; Sigma-Aldrich, Steinheim, Germany). The time to build up pressure and equilibrate temperature is defined as the teq. Before and after an HHP treatment of 20 min (from teq), samples were taken and serially diluted in 0.1% peptone saline. Samples of 50 to 200 μl were plated on BHI agar using a spiral plater (Eddy Jet; LabScientific, NJ). The plates were incubated for 5 days at 30°C to allow all surviving cells to recover and form visible colonies. Survivors were enumerated, and this was considered accurate if more than 20 cells were detected. This corresponds to a 2-log CFU/ml limit of detection.
Heat inactivation.
Cells from the exponential growth phase (5 h of growth at 30°C) were harvested by centrifugation (2,600 × g, 20°C, 5 min), washed twice with 50 mM ACES buffer, and resuspended in this buffer until a final concentration of approximately 1010 CFU/ml was obtained. For the heat treatment, cell suspensions of 150 μl were placed in sterile glass micropipettes (200 μl; 2-mm inner diameter, 140-mm length; Blaubrand; Brand GmbH, Wertheim, Germany). The pipettes, with the sample in the center of the pipette, were closed by melting the tips and placed in a water bath (Thermomix ME 4P; B. Braun, Melsungen, Germany) and totally covered by the water. Samples were taken before the treatment and after 1 min at 60°C, serially diluted, and plated, and colonies were enumerated.
Inactivation at low pH.
Cells from the exponential growth phase were harvested by centrifugation and added to a tube containing 10 ml BHI, pH 2.5 (pH adjusted with hydrochloric acid [Merck, Darmstadt, Germany]). The medium in the tube, surrounded by water at 37°C, was mixed by using a small magnetic stirrer. Samples were taken directly and after 3 min and then serially diluted in BHI broth instead of 0.1% peptone saline, to restore the pH. Samples were plated and colonies enumerated.
Colony size.
Cells from a preculture were diluted in 0.1% peptone saline containing 0.1% (wt/vol) bacteriological peptone (Oxoid, Hampshire, England) and 0.85% (wt/vol) sodium chloride (Merck, Darmstadt, Germany) and plated on BHI agar. The sizes (diameters in mm) of single colonies (average of 20 colonies per plate) were measured after 2 days of growth at 30°C.
Motility test.
The motility of the strains was tested in semisolid medium containing 0.25% (wt/vol) agar (Oxoid), 1% (wt/vol) bacteriological peptone (Oxoid), 0.5% (wt/vol) NaCl (Merck, Nottingham, United Kingdom), 0.005% (wt/vol) 2,3,5-triphenyltetrazolium chloride (Sigma-Aldrich Chemie, Zwijndrecht, Netherlands). A tube, containing 10 ml of motility medium, was inoculated by stabbing a single colony into the medium. After 3 days of incubation at 25°C, strains that were motile, and therefore able to swarm, showed a red cloudy pattern as a result of the reduction of 2,3,5- triphenyltetrazolium chloride to formazan caused by bacterial metabolism.
Hemolysis.
Hemolysis tests were performed following the international standard method for detection of L. monocytogenes, ISO 11290-1. Single colonies were streaked on blood agar plates containing 6% of sheep blood (Biotrading, Mijdrecht, Netherlands). Listeria innocua was used as a negative control. Plates were examined after incubation at 37°C for 3 days. The zones of hemolysis were compared between the different variants and the wild type and scored.
Maximum specific growth rate.
At 7°C and 30°C, growth was measured for cultures grown in BHI broth in an Erlenmeyer flask based on the optical density (OD). Anaerobic growth was also measured at 30°C in N2-flushed BHI broth. In time the OD at 660 nm (OD660; measured with a DU 530 Life Science UV/VIS spectrophotometer; Beckman Coulter, Fullerton, CA) of the cultures was measured. The maximum specific growth rate (μmax, in h−1) was calculated from the ln(OD660) data with the modified Gompertz equation (30) with the TableCurve 2D software package (version 2.03; Jandel Scientific, San Rafael, CA).
Biofilm formation.
Biofilm formation experiments were performed in Hsiang-Ning Tsai medium (HTM), a synthetic minimal defined medium (27a). Flat-bottom polystyrene microtiter 96-well plates (Greiner Bio-One, Frickenhausen, Germany) were inoculated with 100 μl of HTM containing 1% (vol/vol) inoculum of a preculture in BHI. Plates were incubated at 30°C under aerobic and anaerobic conditions using a BBL GasPak system (Becton Dickinson Microbiology Systems, Cockeysville, MD). After 46 h of incubation the OD595 was measured with a microplate reader (Safire; Tecan Benelux BVBA, Giessen, Netherlands), and the number of planktonic cells was determined by plating on BHI agar. Biofilm formation was determined using the method of Djordjevic et al. (5). The culture medium was removed from the microtiter plate wells, and the wells were washed with sterile distilled water to remove loosely associated bacteria. Each well was stained with 1% crystal violet solution. After staining, plates were washed and 95% ethanol was added to detach the stained cells. From each well 100 μl was transferred to a new microtiter plate and the amount of crystal violet present in the solution was measured based on the OD at 595 nm.
Amplification and sequence analysis of the ctsR gene.
Amplification of ctsR was performed as described previously by Van Boeijen et al. (28). The PCR products (size, 1.2 kb) were isolated by QIAquick gel extraction (Qiagen, Venlo, Netherlands) and sent for sequence analysis (Base Clear B.V., Leiden, Netherlands).
Reverse transcription-PCR (RT-PCR) expression analysis of CtsR-regulated genes.
RNA was isolated from cells from the exponential growth phase at 30°C using Tri reagent (Ambion Inc., Austin, TX) and Turbo DNase (Ambion). The quality and quantity of the RNA were checked using NanoDrop ND-1000 (NanoDrop Technologies, Wilmington, DE) and the RNA 6000 Nano assay and a 2100 Bioanalyzer (Agilent Technologies, Waldbronn, Germany). Synthesis of cDNA was performed with SuperScript III (Invitrogen, Carlsbad, CA). The real-time PCR was carried out with IQ SYBR green Supermix (Bio-Rad, Hercules, CA) in an ICycler using the following steps: initial denaturation (95°C for 90 s) and amplification (40 cycles of 95°C for 15 s, 58°C for 60 s). Primers, designed based on the genome of strain EGDe, are listed in Table 1. The formed products have a size of around 100 bp. Standard curves were derived in order to determine the efficiencies of primer sets corresponding to the different transcripts. Relative expression levels were calculated as described by Pfaffl (25), and Ct values were transformed according to the following equation: ratio = [EΔCt(control − sample) for target]/[EΔCt(control − sample) for the reference], where E is the real-time PCR efficiency, the target is the specific CtsR-repressed gene of interest (ctsR, clpC, clpB, clpE, or clpP), references are 16S rRNA and tpi, the control is wild type (WT), and samples are the CtsR variants. Significant differences between the expression ratios of samples and controls were calculated with the pairwise fixed reallocation randomization test using the relative expression software tool (REST; version 2; http://www.wzw.tum.de/gene-quantification/).
TABLE 1.
Primers used for determination of expression of ctsR and CtsR-regulated genes
| Gene | Primer sequences (sense, antisense) |
|---|---|
| 16S rRNA | 5′-GATGCATAGCCGACCTGAGA-3′, 5′-TGCTCCGTCAGACTTTCGTC-3′ |
| tpi | 5′-AACACGGCATGACACCAATC-3′, 5′-CACGGATTTGACCACGTACC-3′ |
| ctsR | 5′-GATTAATGGTTGCGGCATTG-3′, 5′-CAAAGCAACTAACATCGCCTCT-3′ |
| clpC | 5′-AGTCGATGTTTGGCGATGAG-3′, 5′-TGGAGGAGCCCCAACTAAAC-3′ |
| clpB | 5′-AAAACAGCCATTGTCGAAGG-3′, 5′-AAGGGAACCAATGTCGAGTG-3′ |
| clpE | 5′-AGCAAACTTTGGGTCGAATG-3′, 5′-GTTCACGGTTTGCTTGGTTT-3′ |
| clpP | 5′-AGCGGACGTACAAACAATCG-3′, 5′-AATTTCAGCGTTTGGCAAGG-3′ |
Statistical analysis.
To determine statistical differences between LO28 WT and variants, Student's t test for two samples assuming equal variances was used (the limit of significance was set at P = 0.05). The relative ratios of the 12 phenotypic characteristics of all HHP-resistant variants compared to LO28 wild type (set at 1) were calculated, and a data matrix was constructed in Excel (for the two parameters motility and hemolysis, the scores ++, +, ±, and − were defined as 1, 0.5, 0.25, and 0, respectively). This data matrix was also cluster analyzed using the unweighted pair group method with arithmetic mean (UPGMA) method and Euclidean distances with the GeneMaths XT software (AppliedMaths, St. Martens-Latem, Belgium).
SEM.
Anopore strips cultured with bacteria were glued on a sample holder with conductive carbon cement (Leit-C; Neubauer Chemicalien) and frozen in liquid nitrogen. Samples were transferred under vacuum to a dedicated cryo-preparation chamber (Oxford Cryo-system CT 1500 HF) onto a sample stage at −90°C. The samples were freeze-dried for 4 min at −90°C in a 3 × 10⁻⁷ Pa vacuum to remove water vapor contamination. After the sample surface was sputter coated with 10-nm platinum particles, it was transferred to the cold sample stage (−190°C) inside the Cryo-FESEM (JEOL JSM-6300F field emission scanning electron microscope [SEM]) and subsequently analyzed with an accelerating voltage of 5 kV. Approximately 1,000 cells of each sample were examined. Images were digitally recorded (Orion, version 6; ELI sprl, Charleroi, Belgium).
RESULTS
Survival under stress conditions.
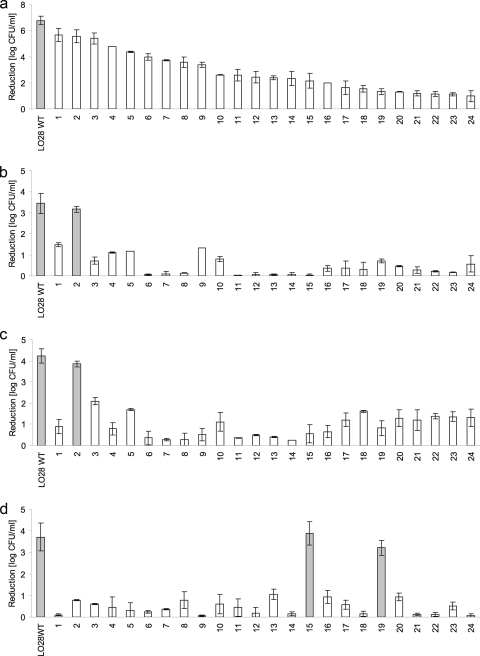
All 24 LO28 piezotolerant variants, previously isolated after HHP treatments of 20 min at 350 MPa and 20°C (28), were tested for their resistance to HHP, heat, and low pH. Detailed analysis of their HHP resistance revealed cells from the exponential growth phase showed 10- to 600,000-fold-higher survival than the WT (Fig. 1a). Tested stationary-phase cells showed similar results for the majority of the variants (Fig. 1b). In most cases stationary-phase cells were more HHP resistant than exponential-phase cells. Exponential-phase cells were also tested for their heat and low-pH survival. After a 1-min exposure at 60°C most HHP-resistant variants showed 2- to 10,000-fold-better survival than the wild type. Only the heat resistance of variant 2 was not statistically significantly different from that of the WT (Fig. 1c). Low-pH survival was tested at pH 2.5 for 3 min at 37°C and revealed for most variants survival 300 to 5,000 times greater than for the wild type. Only variants 15 and 19 showed a reduction similar to that of the WT (Fig. 1d).
FIG. 1.
Reduction (in log CFU/ml) of Listeria monocytogenes LO28 WT and 24 HHP-resistant variants after HHP treatment of exponentially growing cells at 350 MPa, 20°C, for 20 min in ACES buffer (a), HHP treatment of stationary growing cells at 350 MPa, 20°C, for 20 min in ACES buffer (b); heat treatment of exponentially growing cells at 60°C for 1 min in ACES buffer (c); and low-pH treatment of exponentially growing cells at pH 2.5, 37°C, for 3 min in BHI broth (d). Reduction was determined by subtracting the number of surviving cells (log CFU/ml) after the treatment from the number of unstressed cells (log CFU/ml). Each inactivation experiment was reproduced at least two times on different days. The error bars show 1 standard deviation. Results in gray bars are not statistically different, whereas white bars show significant differences compared to the wild type.
Impact of oxygen and temperature on growth in broth.
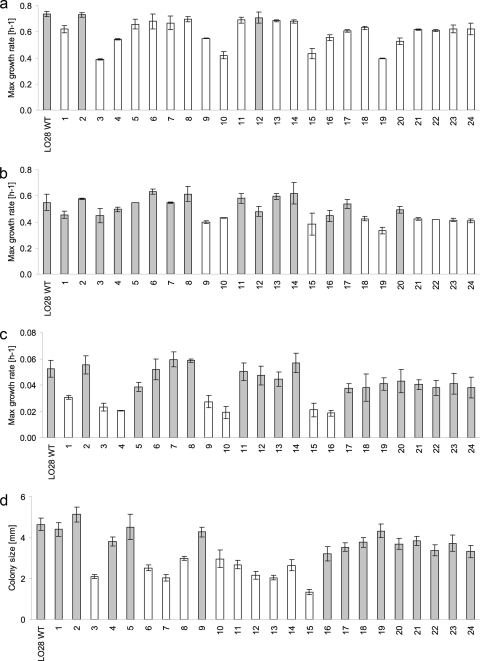
Analysis of growth performance in BHI under aerobic conditions at 30°C revealed that only 2 of the 24 HHP-resistant variants had maximum specific growth rates (μmax) similar to the wild type. The other variants had a lower μmax (Fig. 2a); however, under anaerobic conditions, 15 variants had μmax values similar to the WT (Fig. 2b). Interestingly, half of the variants had similar μmax values during growth under aerobic and anaerobic conditions, while the wild type and the rest of the variants grew significantly slower under anaerobic conditions. At 7°C all variants were able to grow, of which 17 grew at the same μmax as the WT, with the remaining variants growing more slowly (Fig. 2c).
FIG. 2.
Maximum specific growth rates of Listeria monocytogenes LO28 WT and 24 HHP-resistant variants at 30°C in BHI under aerobic conditions (a); at 30°C in BHI under anaerobic conditions (b); or at 7°C in BHI under aerobic conditions (c). (d) Colony size (in mm) was determined by measuring the diameters of colonies after 2 days of growth at 30°C on BHI agar under aerobic conditions. Each growth experiment was reproduced at least two times on different days. The error bars show 1 standard deviation. Results in gray bars are not statistically different, whereas white bars show significant differences compared to the wild type.
Small-colony variants.
Ten variants showed reduced colony sizes on BHI agar at 30°C (Fig. 2d), and these were classified as so-called small-colony variants (SCVs). The formation of SCVs was independent of maximum growth rate, because SCVs as well as normal-sized colony variants showed similar growth rates in BHI broth at 30°C (Fig. 2a). After replating the SCVs, in addition to small colonies, also normal (WT)-sized colonies were formed at a frequency of approximately 10−2 for all SCVs (data not shown). The HHP resistance was tested for these specific normal-sized colonies to determine their stress resistance characteristics. Only 3 of the 10 SCVs (numbers 10, 14, and 15) formed reverted normal-sized colonies that were HHP sensitive. Of these three reverting SCVs, only variant 14 was a CtsR variant, with an insert of 86 bp in the ctsR gene. Sequence analysis of the revertant's ctsR gene revealed that this ctsR gene had regained the WT sequence. On the other hand, the reverted normal-sized colonies of the other seven variants showed similar resistance as their original SCVs. Apparently, the LO28 SCV phenotype is not strictly linked to the stress-resistant phenotype, pointing to different origins of the various phenotypes and their corresponding genotypes.
Motility, hemolytic activity, and biofilm formation.
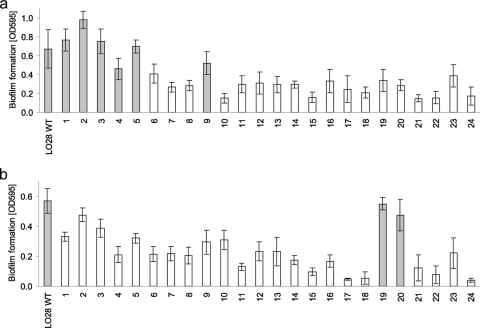
A large number of variants (13 of 24) had motile behavior similar to the WT, whereas four variants were less motile and seven were nonmotile (Table 2). Fifteen variants showed a similar hemolytic activity as the LO28 WT, whereas the nine other variants showed less hemolysis (Table 2). Biofilm formation capacity was assayed under both aerobic and anaerobic conditions at 30°C. Under aerobic conditions six variants, and two other variants under anaerobic conditions, produced similar amounts of biofilm as LO28 WT. The other variants formed less biofilm under both growth conditions (Fig. 3a and b).
TABLE 2.
Differences in ctsR genes, motilities, and hemolytic activities of the strains studied
| Strain | ctsR genea | Motilityb | Hemolysisb |
|---|---|---|---|
| LO28 (WT) | Normal | ++ | ++ |
| 1 | Normal | ++ | ++ |
| 2 | Normal | ++ | ++ |
| 3 | Normal | ± | + |
| 4 | 268 bp deleted | − | ++ |
| 5 | Normal | ++ | ++ |
| 6 | Δ GGT | ++ | ++ |
| 7 | Δ GGT | ++ | ++ |
| 8 | 55 bp deleted | ++ | ++ |
| 9 | Normal | + | ++ |
| 10 | Normal | − | + |
| 11 | Point mutation, aa 38 | ++ | ++ |
| 12 | Δ GGT | ++ | ++ |
| 13 | 49 bp deleted | ++ | ++ |
| 14 | Addition of 86 bp | ++ | ++ |
| 15 | Normal | ++ | + |
| 16 | Normal | + | ++ |
| 17 | Normal | − | + |
| 18 | Normal | − | + |
| 19 | Normal | ++ | ++ |
| 20 | 198 bp deleted | ++ | ++ |
| 21 | Normal | − | + |
| 22 | Normal | − | + |
| 23 | Normal | + | + |
| 24 | Normal | − | + |
Δ GGT, 3 bp (Gly) deleted in the glycine repeat region; aa, amino acid.
For motility and hemolysis a clear positive result is coded ++ and a clear negative result as −, whereas ± means slightly positive and + indicates a positive response (but less clear than the wild-type response).
FIG. 3.
Biofilm formation (measured based on the OD595) after 46 h of incubation in HTM in polystyrene microtiter plates at 30°C under aerobic (a) or anaerobic (b) conditions. Each measurement was reproduced at least three times on different days. The error bars show 1 standard deviation. Results in gray bars are not statistically different, whereas white bars show significant differences compared to the wild type.
ctsR gene sequence analysis and RT-PCR expression of CtsR-regulated genes.
Previous studies in L. monocytogenes Scott A have shown CtsR to be involved in HHP resistance. Therefore, the ctsR gene and promoter region of all variants were analyzed for mutations. From the 24 variants, variants 4 and 20 had a large deletion upstream of the ctsR gene. Seven other variants had mutations in the ctsR gene, including point mutations, insertions, and deletions (Table 2). The ctsR genes and promoter regions of the other 15 variants were intact, i.e., similar to the WT. Interestingly, all variants with a mutation in the ctsR gene were classified as SCVs (see above).
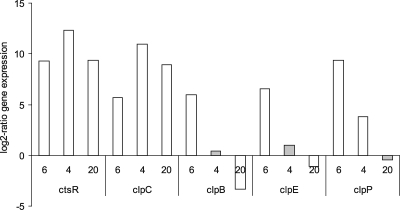
As CtsR is a negative regulator of class III stress response genes, mutations in or upstream of ctsR might lead to a decrease in CtsR repression efficiency, resulting in overexpression of CtsR-regulated genes. Therefore, gene expression levels of ctsR, clpB, clpC, clpE, and clpP of exponentially growing unstressed cells of variants with a deletion in (variant 6) or upstream of (variants 4 and 20) the ctsR gene were compared to the WT (Fig. 4). The expression of clpC was higher in all tested ctsR variants. These variants also showed higher expression of ctsR compared to the wild type, which is best explained by the autoregulatory function of CtsR. Variants with a mutation in the ctsR gene (represented by variant number 6 in Fig. 4) also showed higher expression levels of the CtsR-regulated genes clpB, clpE, and clpP, indicating that the repressor function of CtsR is lost. Notably, variants 4 and 20, with a large deletion upstream of the starting codon of the ctsR gene (positioned 47 and 41 bp upstream of ATG, respectively), showed no increased expression of the clpB, clpE, and clpP genes (Fig. 4). This indicated that the repressor function of CtsR is at least partially maintained.
FIG. 4.
Gene expression ratio (log2) of ctsR, clpC, clpB, clpE, and clpP of exponentially growing unstressed cells of variant 6 with a deletion in the ctsR gene (ΔctsR) and variants 4 and 20, with a deletion in the promoter region upstream of the ctsR gene compared to the wild type. The genes ctsR and clpC are part of the same operon. Results in white bars show significant differences compared to WT (calculated with the pairwise fixed reallocation randomization test, using the relative expression software tool, version 2).
Correlations and cluster analysis.
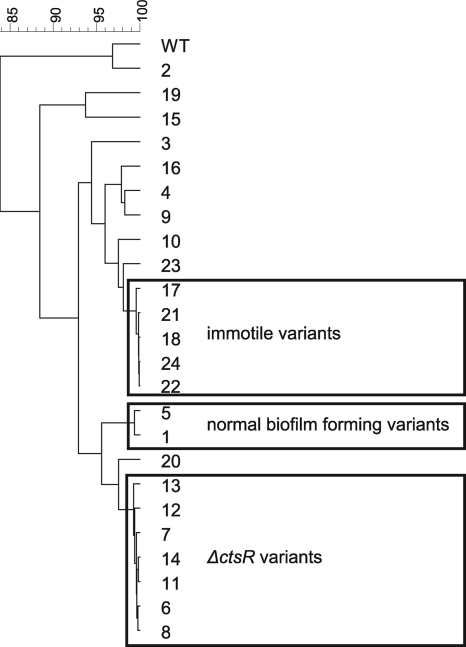
For the cluster analysis the characteristic data (12 phenotypic characteristics) were ordered to extract information concerning similar or unique characteristics of the different HHP-resistant variants. This analysis revealed three clusters formed by 14 of the 24 variants. One cluster was found to consist of the seven variants with a mutation in the CtsR regulator gene. The two other clusters contained two variants with aerobic biofilm formation similar to the wild type and five immotile variants, respectively. The remaining 10 variants did not cluster, signifying their unique characteristics (Fig. 5). The correlation coefficient (R2) between variant characteristics belonging to one of the three clusters was ≥0.9 (P < 0.0002).
FIG. 5.
Cluster analysis of phenotypic characteristics of WT and HHP-resistant variants revealed three clusters formed by 14 variants, of which one cluster consisted of 7 variants having a mutation in the CtsR regulator. The two other clusters contained two variants with aerobic biofilm formation similar to the wild type and five immotile variants, respectively. The remaining 10 variants did not cluster, signifying their unique characteristics.
SEM.
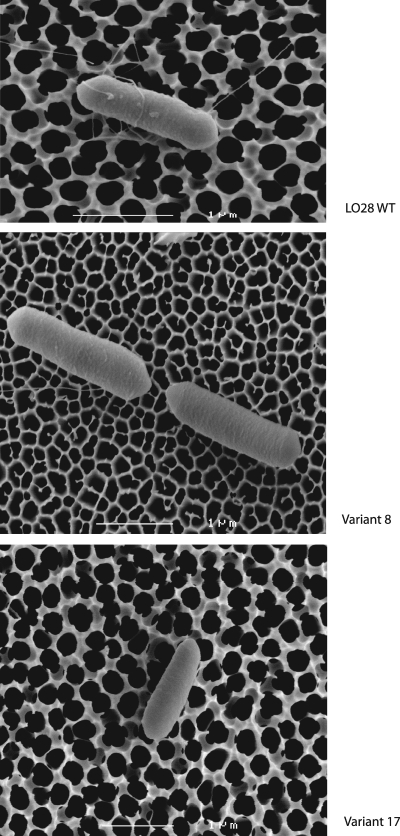
Scanning electron microscopy images were made of LO28 wild type and two HHP-resistant variants. These two variants belong to the two most prominent clusters of variants found: variants that have a deletion in the CtsR regulator gene and immotile variants. Cells of both variants showed sizes and morphologies similar to those of the wild type. Flagella were present for the wild type and the motile variant 8 but absent for the immotile variant 17 (Fig. 6).
FIG. 6.
Scanning electron microscopy images of LO28 WT and two HHP-resistant variants (8 and 17). The wild type and variant 8 both showed the presence of flagella, whereas variant 17 showed an absence of flagella. Both variant cell types showed normal size and morphology compared to the wild type.
DISCUSSION
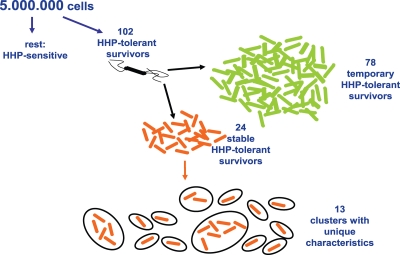
Characterization of 24 resistant variants, which were previously isolated after HHP exposure (28), revealed considerable diversity within this stable resistant fraction. The information obtained in the current study can be combined with that of the previous one (28) and result in the scheme presented in Fig. 7. Starting with 5 million L. monocytogenes LO28 cells, more than 100 cells were able to survive 20 min at 350 MPa. One portion of these HHP survivors was temporarily resistant due to phenotypic switching, whereas the other part was stably resistant because of genotypic heterogeneity. Characterization of 24 of these stable HHP-resistant variants showed most of them to be resistant to other stresses besides HHP and they were able to grow and form biofilms under various conditions. Ordering all phenotypic characteristics by cluster analysis resulted in 13 clusters of variants with (a combination of) unique characteristics (Fig. 7). This population diversity can be essential to the fitness and persistence of L. monocytogenes in a range of environments.
FIG. 7.
Selection and clustering of stress-resistant L. monocytogenes LO28. Of 5 million L. monocytogenes LO28 cells, more than 100 cells were able to survive 20 min at 350 MPa. One portion of these HHP survivors was temporarily resistant due to phenotypic switching, whereas the other part was stably resistant because of genotypic heterogeneity (28). Ordering all tested phenotypic characteristics of these stable HHP-resistant variants by cluster analysis resulted in 13 groups of variants with (a combination of) unique characteristics.
Within the 13 different clusters found, three clusters dominated, as they described 14 of the 24 variants. The first cluster contains five immotile variants showing extreme HHP and heat resistance. Resistance to various stresses, as seen for most variants, might be explained by simultaneous activation through regulatory networks of the different stress mechanisms, as previously described for HrcA, CtsR, and σB in L. monocytogenes (10, 11). The second cluster contains two stress-resistant variants with anaerobic growth and aerobic biofilm formation similar to the wild type (Fig. 2b and 3a). Interestingly, these variants had reduced aerobic growth rates and anaerobic biofilm formation compared to the WT (Fig. 2a and 3b). This outcome confirmed previous findings, showing no correlation between growth rate and biofilm formation under the same environmental conditions (5). The third cluster contains seven motile, small-colony variants, showing normal anaerobic but reduced aerobic growth in broth and hemolytic activity similar to the wild type. The phenotype of this last cluster could be linked to a specific genotype, as only these seven variants have altered ctsR genes. CtsR represses the class III stress response genes encoding chaperones and Clp proteases, which degrade damaged or misfolded proteins. Indeed, RT-PCR analysis revealed all seven variants have increased expression of CtsR regulon members, such as clpB, clpE, and clpP. Previously, CtsR was found to be involved in piezotolerance of most L. monocytogenes Scott A variants (12, 14).
Comparison of the characteristics of LO28 CtsR variants to the previously isolated Scott A CtsR variant, AK01, revealed similarities as well as notable differences. Both piezotolerant variants showed slightly lower maximum growth rates but increased resistance to heat and acid compared to their wild types (13). Striking differences in the morphology of the LO28 CtsR variants and Scott A AK01 were observed, with AK01 displaying altered morphology, showing not only an absence of flagella but also elongation of cells (13). Scanning electron microscopy revealed wild-type morphology and the presence of flagella in the LO28 CtsR variants. The presence of flagella is in line with the motile characteristics of the LO28 ctsR variants. The origin of the differences in morphology of these variants remains to be elucidated. Another difference between AK01 and our LO28 CtsR variants concerned virulence characteristics. The immotile AK01 mutant was less virulent in a mouse infection model compared to its wild type (15). Furthermore, in our study AK01 showed less hemolysis than Scott A and LO28 (data not shown). On the contrary, our LO28 CtsR variants showed similar motility and hemolysis capacity as their wild type, suggesting that virulence factor production capacity was not significantly altered. Virulence of the LO28 HHP-resistant variants will be assessed in more detail in future studies, including in vivo experiments using mouse models. Another remarkable observation was made for colony size, as in contrast to AK01, LO28 CtsR variants were SCVs. SCVs have also been described for HHP-resistant staphylococci. These staphylococcal SCVs resulted from a deficiency in aerobic electron transport chain activity, resulting in lower ATP-generating capacity and consequently reduced growth yields under aerobic conditions (16). On the contrary, for the LO28 CtsR SCVs the maximum growth rates under aerobic conditions were similar to that of the wild type at 7°C and similar or only slightly lower at 30°C. This might be the result of reversion of part of the population to normal growing cells, because after replating the LO28 CtsR SCVs normal-sized colonies were found. Retesting revealed that one of the seven variants had not only reverted to the wild-type phenotype but also to its genotype, by losing the insert in the ctsR gene. Next to these seven CtsR SCVs, also three SCVs (numbers 3, 10, and 15) were found to have an intact ctsR gene. These variants showed reduced growth under aerobic conditions, as their maximum growth rates were half the rate of the wild type. Also, these three variants showed reversion to normal (WT)-sized colonies, and two of these reverted variants turned out to be HHP sensitive. Reversion to the wild-type phenotype has also been described for perR SCVs of L. monocytogenes (26). Deletion of perR resulted in an SCV that was slow growing. At a relatively high frequency, large-colony variants arose in the culture. Interestingly, these revertants were perR mutants with an unidentified subsequent mutation that showed increased fitness and ultimately dominated the culture. Reversion of SCVs can give rise to persistence because of relatively high-frequency switches between phenotypes and genotypes. Furthermore, in most cases SCVs reverted to wild-type-sized colonies that were still HHP resistant. This would allow Listeria to be resistant to different stresses as well as to overcome the fitness disadvantages associated with this resistance by reversion.
So far the only genetic origin of HHP resistance found is alteration of the ctsR gene. However, two other LO28 variants (variants 4 and 20), not belonging to the third cluster, have a deletion upstream of the ctsR gene. As a result the binding site of CtsR, a heptanucleotide repeat in the promoter region (A/GGTCAAANANA/GGTCAAA) is missing (29). Transcription of the ctsR gene in variants 4 and 20 is putatively constitutive, including that of clpC, which is located in the same operon. The CtsR produced represses transcription of its regulon members clpB, clpE, and clpP, whereas increased expression of ClpC may contribute to stress resistance in these variants (Fig. 4). Notably, the two variants did not cluster, and the possible occurrence of an additional mutation(s) cannot be excluded. The underlying mechanisms of their HHP-resistant phenotypes remain to be elucidated.
Recent characterizations of HHP-resistant S. aureus variants and pressure-tolerant L. monocytogenes strains revealed in both studies no mutations in ctsR, suggesting that also differences in other genomic regions are responsible for their phenotype (3, 16). An obvious candidate may be the HrcA repressor, which controls expression of class I stress response genes encoding chaperones (29). All LO28 variants were therefore tested for mutations in this specific repressor gene (hrcA), its promoter region, and binding site, but no mutations were found (data not shown). A similar observation was also made in the study with HHP-resistant S. aureus isolates (16).
This study showed that L. monocytogenes uses population diversity as an insurance policy to guarantee survival when faced with adverse situations. L. monocytogenes variants showed not only increased general stress resistance but also the ability to grow under various conditions and to form biofilms, factors that may contribute to persistence of Listeria in food-processing environments for long periods of time. For example, the L. monocytogenes strain associated with a national outbreak in the United States involving contaminated delicatessen turkey meats was shown to have persisted in a food-processing facility for more than 10 years (23). To develop strategies to tackle problems associated with diversity and persistence, further research will focus on diversity and the mechanisms involved in diversity generation.
Acknowledgments
We thank Adriaan van Aelst for performing the scanning electron microscopy analysis.
Footnotes
Published ahead of print on 5 February 2010.
REFERENCES
- 1.Cheftel, J. C. 1995. Review: high-pressure, microbial inactivation and food preservation. Food Sci. Technol. Int. 1:75-90. [Google Scholar]
- 2.Chen, H. 2007. Use of linear, Weibull, and log-logistic functions to model pressure inactivation of seven foodborne pathogens in milk. Food Microbiol. 24:197-204. [DOI] [PubMed] [Google Scholar]
- 3.Chen, H., H. Neetoo, M. Ye, and R. D. Joerger. 2009. Differences in pressure tolerance of Listeria monocytogenes strains are not correlated with other stress tolerances and are not based on differences in CtsR. Food Microbiol. 26:404-408. [DOI] [PubMed] [Google Scholar]
- 4.Considine, K. M., A. L. Kelly, G. F. Fitzgerald, C. Hill, and R. D. Sleator. 2008. High-pressure processing: effects on microbial food safety and food quality. FEMS Microbiol. Lett. 281:1-9. [DOI] [PubMed] [Google Scholar]
- 5.Djordjevic, D., M. Wiedmann, and L. A. McLandsborough. 2002. Microtiter plate assay for assessment of Listeria monocytogenes biofilm formation. Appl. Environ. Microbiol. 68:2950-2958. [DOI] [PMC free article] [PubMed] [Google Scholar]
- 6.Felicio, M. T. S., T. Hogg, P. Gibbs, P. Teixeira, and M. Wiedmann. 2007. Recurrent and sporadic Listeria monocytogenes contamination in alheiras represents considerable diversity, including virulence-attenuated isolates. Appl. Environ. Microbiol. 73:3887-3895. [DOI] [PMC free article] [PubMed] [Google Scholar]
- 7.Gefen, O., and N. Q. Balaban. 2009. The importance of being persistent: heterogeneity of bacterial populations under antibiotic stress. FEMS Microbiol. Rev. 33:704-717. [DOI] [PubMed] [Google Scholar]
- 8.Hauben, K. J., D. H. Bartlett, C. C. Soontjens, K. Cornelis, E. Y. Wuytack, and C. W. Michiels. 1997. Escherichia coli mutants resistant to inactivation by high hydrostatic pressure. Appl. Environ. Microbiol. 63:945-950. [DOI] [PMC free article] [PubMed] [Google Scholar]
- 9.Hogan, E., A. L. Kelly, and D. W. Sun. 2005. High pressure processing of foods: an overview, p. 3-32. In D. W. Sun (ed.), Emerging technologies for food processing. Elsevier Academic Press, London, England.
- 10.Hu, Y., H. F. Oliver, S. Raengpradub, M. E. Palmer, R. H. Orsi, M. Wiedmann, and K. J. Boor. 2007. Transcriptomic and phenotypic analyses suggest a network between the transcriptional regulators HrcA and σB in Listeria monocytogenes. Appl. Environ. Microbiol. 73:7981-7991. [DOI] [PMC free article] [PubMed] [Google Scholar]
- 11.Hu, Y., S. Raengpradub, U. Schwab, C. Loss, R. H. Orsi, M. Wiedmann, and K. J. Boor. 2007. Phenotypic and transcriptomic analyses demonstrate interactions between the transcriptional regulators CtsR and sigma B in Listeria monocytogenes. Appl. Environ. Microbiol. 73:7967-7980. [DOI] [PMC free article] [PubMed] [Google Scholar]
- 12.Joerger, R. D., H. Chen, and K. E. Kniel. 2006. Characterization of a spontaneous, pressure-tolerant Listeria monocytogenes Scott A ctsR deletion mutant. Foodborne Pathog. Dis. 3:196-202. [DOI] [PubMed] [Google Scholar]
- 13.Karatzas, K. A. G., and M. H. J. Bennik. 2002. Characterization of a Listeria monocytogenes Scott A isolate with high tolerance towards high hydrostatic pressure. Appl. Environ. Microbiol. 68:3183-3189. [DOI] [PMC free article] [PubMed] [Google Scholar]
- 14.Karatzas, K. A. G., V. P. Valdramidis, and M. H. J. Wells-Bennik. 2005. Contingency locus in ctsR of Listeria monocytogenes Scott A: a strategy for occurrence of abundant piezotolerant isolates within clonal populations. Appl. Environ. Microbiol. 71:8390-8396. [DOI] [PMC free article] [PubMed] [Google Scholar]
- 15.Karatzas, K. A. G., J. A. Wouters, C. G. M. Gahan, C. Hill, T. Abee, and M. H. J. Bennik. 2003. The CtsR regulator of Listeria monocytogenes contains a variant glycine repeat region that affects piezotolerance, stress resistance, motility, and virulence. Mol. Microbiol. 49:1227-1238. [DOI] [PubMed] [Google Scholar]
- 16.Karatzas, K. A. G., A. Zervos, C. C. Tassou, C. G. Mallidis, and T. J. Humphrey. 2007. Piezotolerant small-colony variants with increased thermotolerance, antibiotic susceptibility, and low invasiveness in a clonal Staphylococcus aureus population. Appl. Environ. Microbiol. 73:1873-1881. [DOI] [PMC free article] [PubMed] [Google Scholar]
- 17.Keto-Timonen, R., R. Tolvanen, J. Lundén, and H. Korkeala. 2007. An 8-year surveillance of the diversity and persistence of Listeria monocytogenes in a chilled food processing plant analyzed by amplified fragment length polymorphism. J. Food Prot. 70:1866-1873. [DOI] [PubMed] [Google Scholar]
- 18.Lawrence, L. M., and A. Gilmour. 1995. Characterization of Listeria monocytogenes isolated from poultry products and from poultry-processing environment by random amplification of polymorphic DNA and multilocus enzyme electrophoresis. Appl. Environ. Microbiol. 61:2139-2144. [DOI] [PMC free article] [PubMed] [Google Scholar]
- 19.Lianou, A., and J. N. Sofos. 2007. A review of the incidence and transmission of Listeria monocytogenes in ready-to-eat products in retail and food service environments. J. Food Prot. 70:2172-2198. [DOI] [PubMed] [Google Scholar]
- 20.Lundén, J. M., T. J. Autio, A.-M. Sjöberg, and H. J. Korkeala. 2003. Persistent and nonpersistent Listeria monocytogenes contamination in meat and poultry processing plants. J. Food Prot. 66:2062-2069. [DOI] [PubMed] [Google Scholar]
- 21.Lundén, J., R. Tolvanen, and H. Korkeala. 2008. Acid and heat tolerance of persistent and nonpersistent Listeria monocytogenes food plant strains. Lett. Appl. Microbiol. 46:276-280. [DOI] [PubMed] [Google Scholar]
- 22.Miettinen, M. K., K. J. Björkroth, and H. J. Korkeala. 1999. Characterization of Listeria monocytogenes from an ice cream plant by serotyping and pulsed-field gel electrophoresis. Int. J. Food Microbiol. 46:187-192. [DOI] [PubMed] [Google Scholar]
- 23.Møretrø, T., and S. Langsrud. 2004. Listeria monocytogenes: biofilm formation and persistence in food-processing environments. Biofilms 1:107-121. [Google Scholar]
- 24.Noma, S., D. Kajiyama, N. Igura, M. Shimoda, and I. Hayakawa. 2006. Mechanisms behind tailing in the pressure inactivation curve of a clinical isolate of Escherichia coli O157:H7. Int. J. Food Microbiol. 109:103-108. [DOI] [PubMed] [Google Scholar]
- 25.Pfaffl, M. W. 2001. A new mathematical model for relative quantification in real-time RT-PCR. Nucleic Acids Res. 29:e45. [DOI] [PMC free article] [PubMed] [Google Scholar]
- 26.Rea, R., C. Hill, and C. G. M. Gahan. 2005. Listeria monocytogenes PerR mutants display a small-colony phenotype, increased sensitivity to hydrogen peroxide, and significantly reduced murine virulence. Appl. Environ. Microbiol. 71:8314-8322. [DOI] [PMC free article] [PubMed] [Google Scholar]
- 27.Rørvik, L., D. Caugant, and M. Yndestad. 1995. Contamination pattern of Listeria monocytogenes and other Listeria spp. in a salmon slaughterhouse and smoked salmon processing plant. Int. J. Food Microbiol. 25:19-27. [DOI] [PubMed] [Google Scholar]
- 27a.Tsai, H.-N., and D. A. Hodgson. 2003. Development of a synthetic minimal medium for Listeria monocytogenes. Appl. Environ. Microbiol. 69:6943-6945. [DOI] [PMC free article] [PubMed] [Google Scholar]
- 28.Van Boeijen, I. K. H., R. Moezelaar, T. Abee, and M. H. Zwietering. 2008. Inactivation kinetics of three Listeria monocytogenes strains under high hydrostatic pressure. J. Food Prot. 71:2007-2013. [DOI] [PubMed] [Google Scholar]
- 29.Van der Veen, S., T. Hain, J. A. Wouters, H. Hossain, W. M. de Vos, T. Abee, T. Chakraborty, and M. H. J. Wells-Bennik. 2007. The heat-shock response of Listeria monocytogenes comprises genes involved in heat shock, cell division, cell wall synthesis, and the SOS response. Microbiology 153:3593-3607. [DOI] [PubMed] [Google Scholar]
- 30.Zwietering, M. H., I. Jongenburger, F. M. Rombouts, and K. van't Riet. 1990. Modeling of the bacterial growth curve. Appl. Environ. Microbiol. 56:1875-1881. [DOI] [PMC free article] [PubMed] [Google Scholar]


