Abstract
Very little is known about the host response to chlamydial genital infection in the male, particularly about the nature of the local response in the urethra. In this study, the pathological and immunologic responses to urethral infection of the male guinea pig with Chlamydia caviae (Chlamydophila caviae) were characterized both during a primary infection and following a challenge infection. A dose-response experiment found that the 50% infectious dose for male urethral infection was 78 inclusion-forming units. The histopathologic response was similar to that of the female, with an initial acute inflammatory response followed by a chronic inflammatory response and plasma cell infiltration. Production of IgG and IgA antibodies in local urethral secretions developed following infection, and levels of both increased in a typical anamnestic response following a challenge infection. CD4 and CD8 T cells, as well as B cells, were observed in the local site by flow cytometry, with a slightly increased number of CD8 cells. Following challenge infection, the dominant anamnestic response was solely in the B-cell compartment, with only a minimal number of T cells. The T-cell response was clearly a Th1 response, as judged by increased levels of gamma interferon (IFN-γ), interleukin-12 p40 (IL-12p40), and IL-2. The proinflammatory cytokines and chemokines IL-8, IL-1β, tumor necrosis factor alpha (TNF-α), CCL2 (monocyte chemoattractant protein 1 [MCP-1]), and CCL5 (RANTES) were elicited in the urethra following primary infection, but only CCL5 showed increased levels upon challenge. This study represents the first comprehensive analysis of the local immune response in the male urethra to a chlamydial genital infection.
Chlamydia trachomatis is the most common bacterial cause of sexually transmitted infections in the United States and worldwide. The vast majority of research on Chlamydia has been devoted to infections of females, particularly because of the severe sequelae to infection, such as ectopic pregnancy and tubal infertility. However, Chlamydia is the most common bacterial agent of sexually transmitted infections in males as well, causing urethritis and, in some cases, epididymitis and prostatitis, and has been associated with male infertility. A recent epidemiological study reported an increasingly high prevalence rate of 161.1 cases per 100,000 men (29). As in females, the majority of chlamydial infections in males are asymptomatic; thus, the individual may unknowingly transmit the infection to his partner. Quinn and colleagues estimated the probability of transmission for both men and women at 68% (15).
Despite the high prevalence of chlamydial infection among males, very little is actually known about the immunobiology and pathogenesis of the infection in males. The human penile urethra is known to possess all of the necessary immune components for antigen presentation and cellular and humoral immune responses, suggesting that this region is clearly able to launch immune responses against chlamydial infection (14). Human male genital tract-derived epithelial cells have been shown to support the growth of C. trachomatis in vitro and to secrete the cytokines interleukin-1 (IL-1), IL-6, and IL-8 upon infection, cytokines that are associated with the inflammatory and innate host responses (1). In the only report of a study of the local immune response of human males, Pate and colleagues reported higher levels of chlamydia-specific IgG and IgA antibodies in urethral swabs from C. trachomatis-infected males than in those from uninfected controls (12). Interestingly, the only cytokine whose levels they found to be elevated in urethral secretions was IL-8. Nevertheless, it is almost a “mission impossible” to define the relation between the infection course and the development of the host response in the local urethral site in infected human males, making the use of animal models imperative.
To date, only limited studies on male genitourinary tract infection with chlamydiae have been performed with nonhuman primate (3, 4, 9), mouse (11), and rat (5, 6) models. Although the nonhuman primates closely parallel human disease, basic research studies on the host response are impractical because of the expense. The mouse is a difficult model because of the inability to obtain repeated urethral specimens from individual animals and the very small size of the target tissue for cytokine studies. While it is likely that rats can be infected in the urethra, this has not been reported, and studies with male rats have used direct injection into the epididymis, clearly an unnatural route.
However, male guinea pigs can be infected intraurethrally with Chlamydia caviae (Chlamydophila caviae), the agent of guinea pig inclusion conjunctivitis (GPIC) (10, 26). In addition, investigators can collect urethral swabs repeatedly from the same animal, and the guinea pig affords the only animal model in which sexual transmission of chlamydial infection to female guinea pigs can be reliably accomplished (10, 24). In the male guinea pig, the infection resolves about 3 weeks after urethral inoculation, and animals are immune to reinfection. Resolution of the infection appears to be dependent on the humoral immune response, although the role of the cell-mediated response has yet to be explored (26). Interestingly, Patterson and Rank reported that male guinea pigs had a high level of resistance to reinfection with GPIC for as long as 150 days, in contrast to female guinea pigs, which had comparable protection against reinfection for only 30 days after the primary infection (13). Since there is virtually no information on the nature of the local immune response in the male urethra to chlamydial infection, in the present study, we used the model of male guinea pigs inoculated intraurethrally with the GPIC agent to comprehensively characterize the local host response, including the histopathologic response and parameters of innate, humoral, and cell-mediated immunity in both primary infection and reinfection.
MATERIALS AND METHODS
Experimental animals.
Male Hartley strain guinea pigs, weighing approximately 500 to 550 g, were purchased from Charles River Laboratories. All guinea pigs were housed singly in cages covered with fiberglass filters in a room with a 12-h-light-12-h-dark cycle and were provided food and water ad libitum.
Inoculation of guinea pigs and assessment of infection.
C. caviae was originally obtained as a yolk sac preparation from the late Edward Murray and has been maintained continuously in our laboratory, first in yolk sacs and then in McCoy and HeLa cells according to standard procedures. For the infection of male guinea pigs, the animals were anesthetized with pentobarbital sodium (Nembutal; 32 mg/kg of body weight) and were inoculated intraurethrally with chlamydiae suspended in 10 μl of sucrose-phosphate-glutamate buffer (SPG) (30) by insertion of a gel-loading micropipette tip (catalog no. 05-408-151; Fisher Scientific) approximately 2 cm into the urethra with the external meatus retracted. Except for the dose-response experiments, animals were inoculated with either 104 or 105 inclusion-forming units (IFU) of the GPIC agent grown in McCoy cells. In order to reduce the chance of urination and elimination of the inoculum, water bottles were removed from the cages for 3 h prior to anesthetization. In the dose-response experiment, animals were weighed every 3 days in order to monitor their weight change during infection. For reinfection experiments, groups of animals were challenged at day 75 after the primary infection with a comparable dose.
For the isolation and quantification of chlamydiae from infected males, urethral swabs were collected from the penile urethrae of male guinea pigs under ketamine anesthesia by using a Dacron swab (Puritan Medical Products, Guilford, ME). The swab was inserted approximately 2 cm into the urethra, rotated gently, removed, and placed in 2-sucrose-phosphate transport medium (30). The swabs were frozen at −70°C until needed. The swabs were processed for isolation and determination of the number of IFU by standard techniques (17).
In the experiment quantifying various chemokines and cytokines by quantitative PCR (qPCR), we did not collect swabs because of our concern that the swabbing procedure in the urethra might cause abrasion and/or trauma, which could affect the chemokine/cytokine response. Also, we could not perform isolations because the tissue was processed for RNA, which is not suitable for preserving the viability of the chlamydiae. Therefore, in this experiment, we quantified the infection by determining the level of C. caviae 16S RNA by quantitative PCR (see below). In the flow cytometry experiment, the method required for obtaining cells precluded the isolation of chlamydiae and the assessment of 16S RNA, so we were not able to quantify the chlamydial infection in that experiment.
Histopathology and immunohistochemistry.
The penis was removed and opened longitudinally by insertion of a scissor into the urethra. The urethral tissue was removed from the muscle layer with a scalpel and was fixed in 10% buffered formalin. The tissues were paraffin embedded, and 5-μm-thick longitudinal sections were stained with hematoxylin and eosin. The tissue sections were scored for acute inflammation (polymorphonuclear leukocyte [PMN] infiltrates), chronic inflammation (mononuclear infiltrates), plasma cells, fibrosis, and mucosal erosion using the following system: trace of a parameter, +0.5; presence of the parameter, +1; presence of the parameter at 1 to 4 foci, +2; presence of the parameter at more than 4 foci, +3; confluent presence of the parameter, +4 (25). The pathologist was blinded as to the day after infection on which the tissue was collected and whether or not the animal had been infected.
Chlamydial inclusions were directly visualized on tissue sections by immunohistochemistry. Briefly, sections were incubated with a monoclonal mouse anti-chlamydial lipopolysaccharide (LPS) antibody prepared from clone EVI H1 (a kind gift from You-Xun Zhang, Boston University), followed by reagents from a horseradish peroxidase (HRP)-diaminobenzidine (DAB) kit (R&D Systems, Minneapolis, MN). A biotinylated secondary antibody (goat anti-mouse IgG-biotin Fab′2) was used to detect the primary antibody, followed by addition of a high-sensitivity streptavidin-HRP conjugate (Thermo-Scientific Pierce, Rockford, IL).
Lymphocyte proliferative response.
Splenocytes and iliac lymph nodes were collected at various times after infection. Single-cell suspensions were prepared by teasing the tissue on a 70-μm-pore-size cell strainer (BD Falcon). The suspensions were treated with 0.17 M Tris-buffered NH4Cl (pH 7.4) to lyse erythrocytes, washed twice, and then resuspended in RPMI 1640 supplemented with 10% fetal calf serum. Cells were seeded into 96-well tissue culture plates (Becton Dickinson, Franklin Lakes, NJ) at 1 × 10⁵ cells per well. GPIC antigen, prepared by UV inactivation of GPIC elementary bodies derived from HeLa cells and purified on a Renografin gradient, was added to wells at 5 μg/ml. The T-cell mitogen concanavalin A (Sigma, St. Louis, MO) was added to cultures at 5 μg/ml as a positive control. Control wells received the medium alone in order to determine the background response in the absence of any antigen or mitogen. The proliferative response was measured by the incorporation of 1 μCi/well of [methyl-3H]thymidine during the last 24 h of a 5-day culture period. Cells were harvested onto Packard self-aligning RG glass fiber filters by using a Packard FilterMate cell harvester. The uptake of [methyl-3H]thymidine was measured by determination of total counts during a 1-min period by using a Packard Matrix 96 direct beta counter. The mean response was obtained from an average of triplicate cultures. Data are expressed as a stimulation index, which was calculated by dividing the total counts of cells incubated with the antigen by the total counts of cells incubated with the medium alone.
Determination of GPIC-specific antibody levels.
Blood was obtained from the lateral saphenous veins of ketamine-anesthetized guinea pigs (8). To obtain local urethral secretions, guinea pigs were anesthetized with pentobarbital sodium, and a 16-gauge intravenous (i.v.) catheter containing a sterile surgical sponge (diameter, 1.7 mm) was inserted approximately 1 cm into the urethra. The sponge was expelled from the catheter, and the catheter was removed. The sponge was removed from the urethra after 30 min and was frozen at −20°C until further processing.
Levels of antibodies to the GPIC agent in plasma and local urethral secretions were determined by an enzyme-linked immunosorbent assay (ELISA) as described previously using Renografin-purified elementary bodies as the antigen (20). To measure IgG titers in serum or secretions, HRP-labeled rabbit anti-guinea pig IgG (heavy and light [H+L] chain specific; MP Biomedicals, Irvine, CA) was used. For measurement of IgA, rabbit anti-guinea pig alpha chain (MP Biomedicals) was added for 1 h, followed by HRP-conjugated goat anti-rabbit IgG (H and L chain specific; MP Biomedicals). Sponges were eluted in phosphate-buffered saline. Sera from individual animals were assessed for antibody levels; however, because only very small amounts of urethral secretions could be collected from single animals, the secretions from a given day were pooled.
Quantitative PCR for cytokine detection.
Urethral tissues were collected from groups of male guinea pigs by removing the mucosal layer after a longitudinal incision through the urethral tract was made. The tissues were stored in RNAlater (Ambion, Austin, TX) at −20°C. Total RNA was extracted from urethral tissue homogenates by using a PerfectPure RNA tissue kit (5 Prime) according to the manufacturer's instructions. RNAs (12.5 pg/μl) were treated using 10 U of RNase-free DNase (Roche) for 15 min at 37°C. DNase was inactivated by heat denaturation at 70°C. cDNAs were synthesized from 0.25 μg of total RNA using the SuperScript III reverse transcriptase kit (Invitrogen).
The cytokine response was determined by quantitative PCR in a reaction mixture with a total volume of 12.5 μl containing 2.5 μl of a 1:10 dilution of the cDNA product and 6.25 μl of 2× iQ Supermix (Bio-Rad) in a Bio-Rad iCycler. The protocol consisted of denaturation at 95°C for 3 min, followed by 40 cycles of 95°C denaturation (30 s) and 60°C annealing (1 min). Serial dilutions of the PCR product for the individual genes tested were used for standard curves. Absolute concentrations of cDNA obtained from PCR were extrapolated to entire tissues for their representation in figures. The genomic DNA of the GPIC agent was extracted using the Promega Wizard SV genomic DNA purification system, and serial dilutions were used as the standard curve for 16S RNA. Primers and probes for chemokines, cytokines, guinea pig glyceraldehyde-3-phosphate dehydrogenase (GAPDH), and GPIC 16S RNA are listed in Table 1. Probes labeled with 6-carboxyfluorescein (FAM) at the 5′ end are needed for qPCR of the 16S RNA gene of the GPIC agent. The sequence is 5′-TGCCTCATCCACGCCGCCAG-3′.
TABLE 1.
PCR primer sequencesa
| Gene | F primer | R primer |
|---|---|---|
| Housekeeping (GAPDH) | AAGGCTCTGGGCAAGGTCAT | GCCAAATACGATGACATCAAGAAGG |
| Inflammatory cytokines | ||
| IL-8 | GGCAGCCTTCCTGCTCTCT | ACAAAGTTGGTCTCGGAGCTG |
| CCL5 (RANTES) | CTGGCCCACTGCTTAGCAAT | TTTCAAGGCAAAGAAGCAAGG |
| GM-CSFb | TGAGCCTCCTGAACCACACTAG | GAAGTTGTTCATGACCAGTTTGAGCC |
| CCL2 (MCP-1) | TGCCAAACTGGACCAGAGAA | ACTTCAAAGCCTTTGAACATTCG |
| IL-1β | GCCCAGGCAACAGCTCTC | CCAAGTTGAGCTGGTAGAGACTCC |
| TNF-α | CCTACCTGCTTCTCACCCATACC | TCAACCTTCTCTCTGCCATCAA |
| Th1 cytokines | ||
| IL-2 | AAACTTTCCCTTGATACACACC | GTGTGTGACTTAGAAGATGAATCA |
| IFN-γ | CCATCTTGGCTCTTCAGTTC | GAATTGCCAAGAGGAGAGTG |
| IL-12p40 | GTGGGTAGAGTTGGATTGGCACA | ACCTGCAACACTGCTGACCA |
| Th2 cytokine (IL-10) | CCTTACTGGCCGGGGTCAA | CTTTCTTCCAAACACAGGATCAGC |
| GPIC agent (16S RNA) | CTGAGAATTTGATCTTGGTTCAG | CGCTATTATTCCGTTTGACTTG |
F primer, forward primer; R primer, reverse primer.
GM-CSF, granulocyte-macrophage colony-stimulating factor.
Flow cytometry.
Guinea pigs were euthanized at various times after infection, and their genital tracts were removed for enumeration of CD4 and CD8 T cells, B cells/plasma cells, and cells bearing the CD45 cell surface marker. The urethral tissues were collected, and the outer skin, cartilage, ligament, and muscle portions of the penis were discarded. Tissues were processed to produce a single-cell suspension as described previously (23, 27). R-phycoerythrin (RPE)-labeled mouse anti-guinea pig CD4 (CT7), fluorescein isothiocyanate (FITC)-labeled mouse anti-guinea pig CD8 (CT6), mouse anti-guinea pig CD45 (IH-1), mouse anti-B-cell subset (MsGp10), and an allophycocyanin (APC) conjugation kit were purchased from AbD Serotec (Oxford, United Kingdom). APC was conjugated to the anti-CD45 antibody according to the protocol suggested in the kit. All antibodies were mouse IgG1. The secondary antibody used was RPE-conjugated goat anti-mouse IgM-IgG-IgA (H+L) and was obtained from Southern Biotech (Birmingham, AL). Mouse IgG1 negative controls were from AbD Serotec. Flow cytometric analysis was performed using a FACSAria cell sorter (BD Biosciences, San Jose, CA), and the data were analyzed using FloJo/FCS software. Dead cells were excluded on the basis of positive staining with 4′-6-diamidino-2-phenylindole (DAPI). Because of the different weights of the tissues collected and the resulting variance in the total numbers of cells, the data are presented as the percentages of cells of given phenotypes among total genital tract cells.
Statistical analyses.
For experiments recording repeated measures from individual animals, statistical significance was determined by a two-factor (group, days) analysis of variance with repeated measures on one factor (days) and with Tukey posthoc analysis. Differences were considered to be significant if P was <0.05. When repeated measures were not performed, the data were evaluated by a two-factor (group, days) analysis of variance with Tukey posthoc analysis.
RESULTS
Determination of infectious dose.
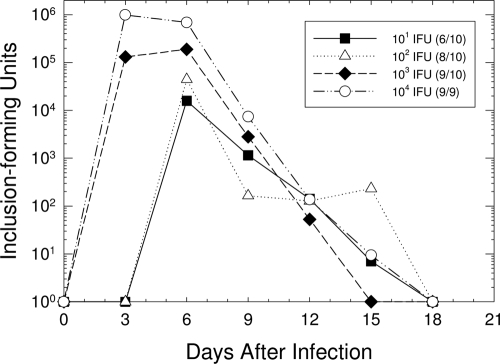
In order to determine the optimal infectious dose for subsequent studies, groups of 9 or 10 guinea pigs were inoculated intraurethrally with 101, 102, 103, or 104 IFU of the GPIC agent in 10 μl of SPG. The course of infection was determined by isolation of the GPIC agent from urethral swabs every 3 days (Fig. 1). Infectious organisms were cleared from the urethrae of male guinea pigs at all doses by day 18 after infection. As expected, the peak level of infection occurred more quickly, and the organisms attained higher levels, in animals inoculated with the higher doses (103 and 104 IFU) than in those inoculated with the lower doses (101 and 102 IFU). The infection courses for animals inoculated with 104 IFU were statistically different from the infection courses for animals infected with any of the lower doses: 103 (P = 0.02), 102 (P < 0.001), and 101 (P = 0.01) IFU. The 50% infectious dose (ID50) for male guinea pigs was calculated to be 78 IFU by the method of Reed and Muench (27). Because we found that 100% of the animals became infected only with doses of 104 IFU and greater, we elected to use 104 to 105 IFU as our standard inoculating dose.
FIG. 1.
Kinetics of urethral infection in male guinea pigs following inoculation with different doses of chlamydiae. Each data point represents the mean number of IFU for animals that became infected. To the right of each dose in the key, the ratio of the number of animals that became infected to the total number of animals inoculated with that dose is given in parentheses. The infection courses of animals infected with 101, 102, and 103 IFU were significantly different from those of animals inoculated with 104 IFU.
Histopathologic response.
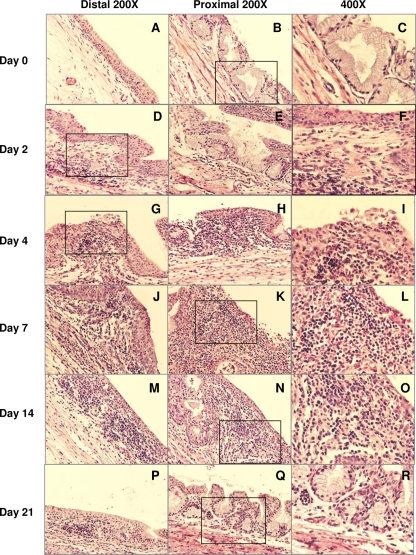
Groups of 3 to 5 male guinea pigs each were infected with 104 IFU of the GPIC agent, and penile tissues were collected and fixed for histopathologic assessment. The pathology score for each parameter in each tissue section was recorded; thus, the pathology score represented the mean for at least 3 penile tissues in each group, depending on the quality of the tissue. The penile urethra of the guinea pig consists of the orifice area and distal and proximal portions. The orifice area of the penile urethra was covered by squamous epithelium, and the rest of the urethra had transitional epithelium at the luminal surface. There are no glands in the distal portion, while secretory glands are prominent in the proximal urethra. No obvious differences in pathological changes were noted between the distal and proximal portions of penile urethrae throughout the infection course. Of the control uninfected tissue sections, most were normal urethral mucosae with transitional epithelium lining the luminal surface (Fig. 2A to C). In only one out of three tissue sections, scattered lymphocytes and plasma cells, distributed submucosally, were observed. This may have been the result of some prior stimulation encountered in the urethra of that particular animal.
FIG. 2.
Pathological responses to chlamydial urethral infection at various times after infection. (Left) Distal area; (center) proximal area; (right) higher-magnification image of the boxed section of the corresponding distal or proximal area.
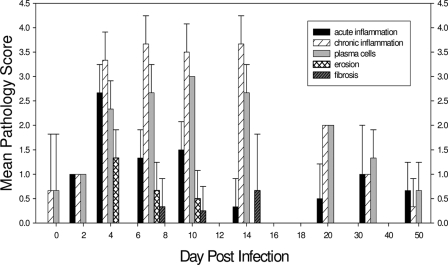
On day 2 after chlamydial infection, inflammatory cells, including PMNs, lymphocytes, and plasma cells, could be observed (Fig. 2D to F and 3). By day 4, PMN infiltration peaked in the urethra, accompanied by frequent epithelial erosion. PMNs were present not only in the submucosa but also in the epithelium and luminal exudates (Fig. 2G to I and 3). Infiltration of inflammatory cells became increasingly intense by days 7 to 14, with lymphocytes and plasma cells as the predominant populations, while PMN infiltration declined greatly by day 14 (Fig. 2J to O and 3). Also, by day 14, no more erosive damage to the epithelial layer of the urinary mucosa was observed, and fibrosis was evident in only one animal on days 7 to 14 but was then absent by day 21 and thereafter (Fig. 2P to R and 3). After day 21 postinfection, at which time the infection in the genital tract had begun to clear, there was a dramatic decrease in the inflammatory response in the genital tract, with few inflammatory cells present. The inflammation continued to decline by day 35, with only a few occasional submucosally distributed lymphocytic aggregates (Fig. 3). By day 50 after infection, the urethral mucosa had returned to normal.
FIG. 3.
Mean pathology scores of tissues for the indicated parameters at various times after infection. Each error bar represents 1 standard deviation. Tissues from 3 to 5 guinea pigs were evaluated at each time point.
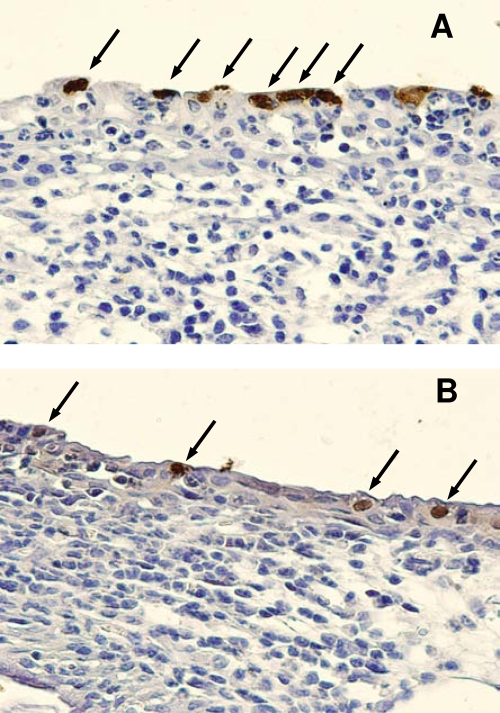
In order to determine the presence of chlamydial inclusions, additional tissue sections were immunohistochemically stained for chlamydial LPS. The resulting brown precipitate, indicating the presence of GPIC inclusions, provided a direct visualization of chlamydial genital infection which was strictly limited to the epithelial layer of the infected male urinary mucosa in both the proximal and distal areas (Fig. 4). The presence of chlamydiae at a given site was routinely accompanied by an inflammatory response at the same site.
FIG. 4.
Immunohistochemical staining of chlamydial inclusions in urethral tissue. Shown are the distal urethra (A) and the proximal urethra (B) on day 4 after infection. Arrows indicate chlamydial inclusions.
GPIC-specific antibodies in serum and urethral secretions.
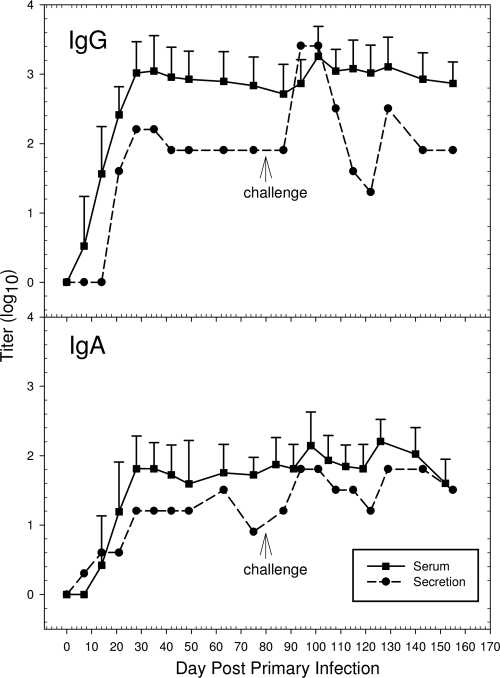
In order to determine both serum and local urethral IgG and IgA antibody responses, 10 male guinea pigs were inoculated intraurethrally with 104 IFU of the GPIC agent. On days 0, 7, 14, 21, 28, 35, 42, 49, 63, and 75 following either a primary infection or a challenge infection, serum and secretion samples were collected from each animal. Urethral swabs were not collected from the animals, so that trauma and potential bleeding in the local urethra could be avoided, and thus, the potential for serum contamination in the urethral secretions would be reduced. Local urethral secretions were collected and pooled because of the small amount obtained from each animal. GPIC-specific IgG and IgA levels in sera developed between 7 to 10 days after infection, increased to peak by day 28, and remained elevated as long as day 75 postinfection (Fig. 5). All animals were positive for serum antibodies, confirming that they had indeed become infected. As with the response in serum, both IgG and IgA in secretions reached elevated levels by 28 days after infection, and their levels remained relatively constant through day 75, although there was a slight decrease in the IgA level at day 75. The antibody titers in secretions did not reach the same overall levels as those in serum, which is attributed to the greater dilution factor of secretions required for performance of the assay. It is also possible that the continuous urination in the male urethra reduced the amount of secretions present and affected the sensitivity of our assay.
FIG. 5.
Mean antibody responses to the GPIC agemt in sera and secretions following primary and challenge infections. Error bars represent 1 standard deviation. Serum samples were collected sequentially from 10 guinea pigs. All urethral secretion samples from the 10 animals were pooled for the determination of antibody titers.
To determine the anamnestic response, each animal was challenged with 104 IFU 75 days after the primary infection. Urethral swabs from all guinea pigs were collected only once, on day 4, to determine if they had been reinfected. Only 4 out of 10 swabs were positive for GPIC IFU, indicating a high level of immunity to challenge infection. Upon reinfection, there was clear evidence of an anamnestic response in both serum and secretions with IgG and IgA. Levels of both IgG and IgA increased by 7 to 14 days after the challenge infection but diminished to the levels present prior to challenge by 35 to 42 days after challenge. The levels remained consistent at the prechallenge levels until the experiment was terminated.
Antigen-specific lymphocyte proliferation.
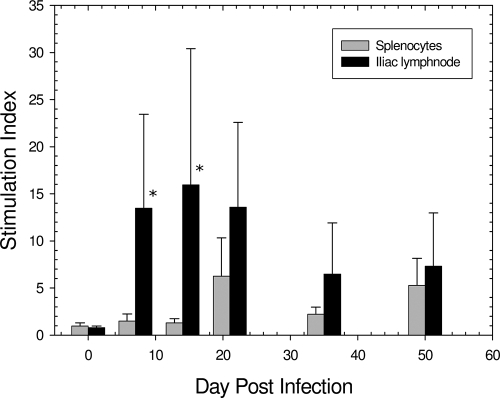
To evaluate the cell-mediated response to GPIC genital infection in males, an antigen-specific proliferation assay was performed with lymphocytes from both the spleen and the iliac lymph nodes, the draining lymph nodes of the genital tract, obtained on days 0, 7, 14, 21, 35, and 50 postinfection from guinea pigs inoculated intraurethrally with 104 IFU of the GPIC agent. The results indicated that the chlamydial urethral infection elicited a strong iliac lymph node response by day 7, in contrast to splenic lymphocytes, which did not show a response until day 21, and even then the response was substantially lower than that of the iliac lymph nodes (Fig. 6). The proliferative response of iliac node lymphocytes to the GPIC antigen peaked by day 14 and then declined by day 21 and thereafter. The difference in the overall proliferative response between lymphocytes from the iliac lymph nodes and lymphocytes from the spleen was statistically significant (P < 0.001).
FIG. 6.
Proliferation responses of iliac lymph node and splenic cells to chlamydial antigen. Each bar represents the mean stimulation index for 6 animals, and each error bar represents 1 standard deviation. Asterisks indicate that the difference between the response in the iliac lymph node and the response in the spleen was significant (P < 0.001).
Flow cytometric evaluation of the cellular response in the male urethra.
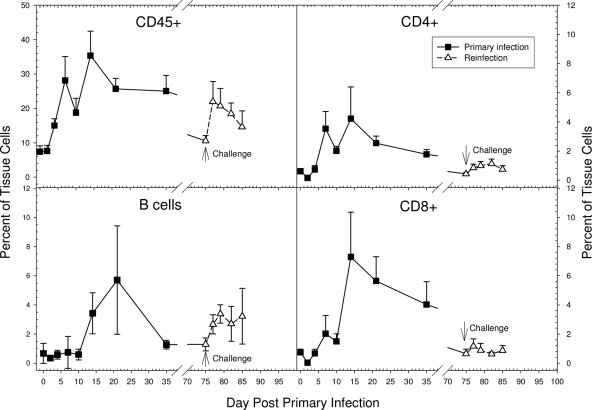
The temporal kinetics of different cell subsets present in the local urethral tissue following GPIC infection was assayed by flow cytometry. The penile tissues were obtained from groups of 5 guinea pigs each on days 0, 2, 4, 7, 10, 14, 21, and 35 after a primary infection with 105 IFU and on days 0, 2, 4, 7, and 10 after a challenge infection with 105 IFU. An increase in the number of CD45+ cells (leukocytes) was first observed on day 4, and they then continued to increase, with two peaks of CD45+ infiltrates on days 7 and 14 after the primary infection (Fig. 7). Based on the histopathologic results, the initial response up to and including day 7 likely consisted of acute inflammatory cells, such as PMNs and mononuclear cells, while after day 7, the response likely represented predominantly recruited lymphocytes, monocytes, and plasma cells. Upon challenge infection, the CD45+ cell response increased more quickly, by day 2, but did not reach the same peak level as that in the primary infection. Such a reduced response would be expected based on the reduced number of organisms in the tissue after challenge because of the protective immune response.
FIG. 7.
Kinetics of the cellular response in the urethra following primary and challenge infections as assessed by flow cytometry. Each data point represents the mean and standard deviation for 5 animals. The number of CD8 cells on day 14 was significantly greater than the number of CD4 cells (P = 0.008). The number of B cells following challenge infection was significantly greater than the numbers of CD4 and CD8 T cells on each of the days following challenge (P, <0.01 to 0.001).
Increased numbers of both CD4+ and CD8+ subsets began to appear in the male urethra by 7 days after the primary infection, increasing to peak levels by day 14 and diminishing thereafter. Interestingly, and in contrast to what has been observed in female guinea pigs and mice, the peak number of CD8+ T cells was significantly greater than that of CD4+ T cells (P = 0.008). The influx of CD4+ and CD8+ cells in the urethra following challenge infection occurred as soon as day 2, but the peak levels were markedly lower than those attained during the primary infection (Fig. 7).
The number of B cells in the urethra did not increase until day 14 after the primary infection but reached its maximum level at day 21, later than the peak of CD4+ and CD8+ T cells. The B-cell response was rapidly induced after the challenge infection, but again, the peak level of B cells in the urethra was less than that attained during the primary infection (Fig. 7). Nevertheless, the observation that the number of B cells following the challenge infection was significantly greater than the numbers of CD4 and CD8 T cells on each of the days following challenge (P, <0.01 to <0.001) was of interest.
Cytokine and chemokine responses.
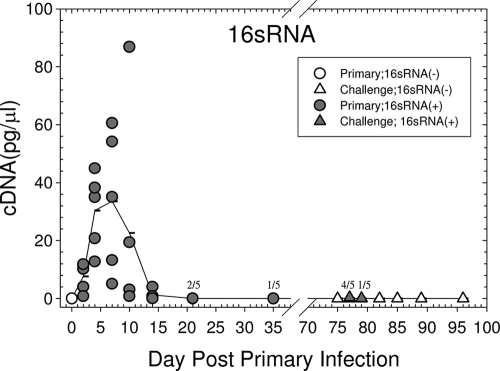
In addition to host cytokine/chemokine genes, 16S RNA transcripts of the GPIC agent were also quantified in order to determine the presence of replicating organisms in the penile tissues, because the processing of the tissues was not compatible with the performance of standard culture. Following the primary infection, all animals examined were positive for 16S RNA until day 21, with a peak level of infection about 7 days after inoculation (Fig. 8). The majority of the animals had resolved the infection by 21 to 35 days after inoculation. Upon challenge, the amount of 16S RNA detected was very low in comparison to that in the primary infection, and only 4 of 5 animals on day 2 after challenge and 1 of 5 animals on day 4 were infected. Thus, as expected, and as we had reported previously (13), there was a high level of immunity to reinfection.
FIG. 8.
Kinetics of 16S RNA transcripts of the GPIC agent following a primary and a challenge urethral infection. Each symbol represents a single animal, and the line represents the mean of the responses of 5 animals at each time point. Filled symbols indicate that the animal was positive for chlamydiae by determination of 16S RNA transcripts. Where the symbols overlap, the total number positive for 16S RNA is given over the total number of animals at each time.
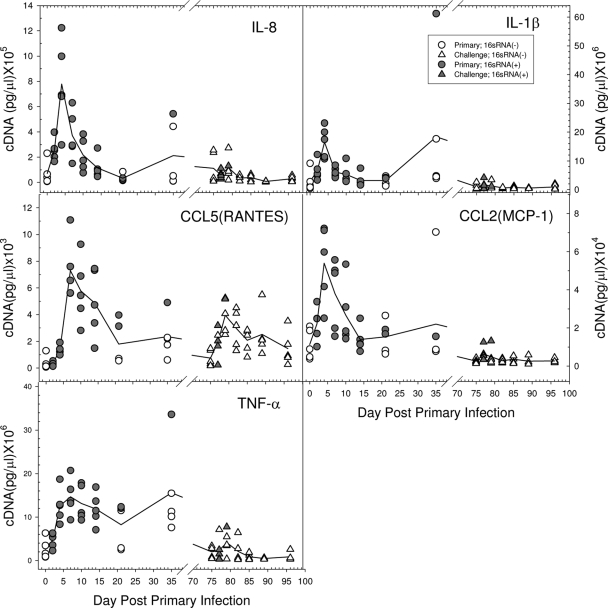
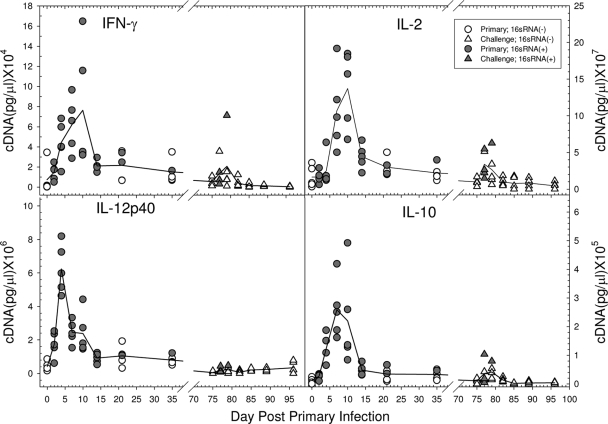
The local chemokine and cytokine transcript levels in the male urethra following a primary chlamydial infection were determined by quantitative PCR. A group of 40 male guinea pigs was infected with 105 IFU of the GPIC agent intraurethrally, and the penile urethral tissues of 5 guinea pigs each were collected on days 0, 2, 4, 7, 10, 14, 21, and 35 after infection. Tissues from individual animals were quantified with respect to the levels of chemokine and cytokine expression. Transcription of IL-8, CCL2 (monocyte chemoattractant protein 1 [MCP-1]), IL-1β, and tumor necrosis factor alpha (TNF-α), all of which are involved in the recruitment of PMNs and/or monocytes and dendritic cells to the local tissue site, was detected by 2 days after infection, increased to peak levels by days 4 to 7, and then began to decline to the basal level during the second week of infection (Fig. 9). The appearance of these molecules coincided with the initiation of the inflammatory response observed by histopathology. Transcripts of the Th1 response-related cytokines IL-12p40, gamma interferon (IFN-γ), and IL-2 initially occurred between days 2 and 4. IFN-γ and IL-2 reached peak levels on days 7 to 10, while IL-12p40 transcripts had begun to decline by that time (Fig. 10). The production of these cytokines corresponded to the development of the adaptive T-cell response, as evidenced by the proliferation assay and the influx of CD4 and CD8 cells. CCL5 (RANTES) transcript levels also began to increase by day 4 and persisted longer than the other chemokines, concomitant with the influx of T cells into the urethra. IL-10 transcripts were also found to increase by days 4 to 7, but the levels were quite low compared to those of the Th1 cytokines.
FIG. 9.
Kinetics of chemokine and cytokine response following a primary and a challenge urethral infection. Each symbol represents a single animal, and each line represents the mean of the responses of 5 guinea pigs. Filled symbols indicate that the animal was positive for chlamydiae by determination of 16S RNA transcripts.
FIG. 10.
Kinetics of the T-cell cytokine response following a primary and a challenge urethral infection. Each symbol represents a single animal, and each line represents the mean of the responses of 5 animals. Filled symbols indicate that the animal was positive for chlamydiae by determination of 16S RNA transcripts.
In order to evaluate the chemokine/cytokine response upon challenge infection, male guinea pigs were challenged intraurethrally with 105 IFU of the GPIC agent on day 75 after a primary infection with 105 IFU, and tissues from groups of 5 animals each were collected on days 0, 2, 4, 7, 10, 14, and 21. To confirm that the animals had been infected previously, serum from each animal was obtained on day 28 after the primary infection and assayed for GPIC-specific IgG by ELISA. All animals were confirmed to be positive (data not shown). Levels of 16S RNA in tissues were also determined in order to assess the number of animals that were reinfected upon challenge. In results similar to those of other experiments, 4 of 5 animals were determined to be positive for 16S RNA on day 2, and only 1 guinea pig of 5 was positive on day 4. When the transcript levels of local cytokines and chemokines in the penile urethra were evaluated after a challenge infection, in general, the overall expression of each of the chemokines and cytokines after challenge was induced to a much lesser extent than after the primary infection (Fig. 9 and 10). IL-8, IL-1β, CCL2 (MCP-1), and TNF-α levels showed only modest increases on days 2 and 4 following reinfection. Instead of the dramatically enhanced expression of IFN-γ and IL-2 on days 7 and 10 following the primary infection, transcript levels of these genes were only slightly increased at the earlier times of days 2 and 4 following challenge. There was no obvious increase in IL-12p40 levels following challenge. Interestingly, CCL5 (RANTES) was expressed at relatively high levels and was still present in some animals 21 days following reinfection.
DISCUSSION
Virtually everything we know about the host response to chlamydial genital infections has been derived from studies of the female, both in humans and in animal models. Painfully little is known about the immune response of the male, and even less is known about the local host response in the male urethra. Therefore, in this study, we used the model of the male guinea pig infected with C. caviae to further characterize the immune responses to chlamydial infection, especially the local antibody, cytokine/chemokine, and cellular responses in the penile urethra, the primary target infection site in males.
Initially, we determined the infection course in male guinea pigs inoculated with different doses of chlamydiae in order to determine the optimal dose for our studies. Not surprisingly, we found that guinea pigs infected with higher doses of the GPIC agent had increased levels of infection and earlier onset. A similar dose response in the course of cervical chlamydial infection was seen in the female (24). We did not see any obvious clinical signs of disease, such as significant weight loss or urethral exudate.
Upon histopathologic examination of the penile urethra, there was clear evidence of a marked inflammatory response directed to the site of infection. As in the female (25), the initial response was an acute inflammatory response peaking at 4 days after infection. A chronic inflammatory response developed concomitantly and remained elevated through day 14. Of note was the observation of a large number of plasma cells from days 4 to 14. This was quite interesting in that plasma cells are a hallmark of the histopathologic response of the female in the cervix and Fallopian tubes. Epithelial erosion occurred along with PMN infiltration into the male urinary tract, and fibrotic changes of the urethral mucosa appeared during the peak response of chronic inflammation. While some PMNs were noted in the lumen, there was no gross evidence of pyuria, although we did not examine the urine for leukocytes. Since fibrosis was only a rare event seen between days 7 and 14, there was no obvious scarring in the male urinary mucosa. This is in contrast to the infection in females, where the fibrosis in the Fallopian tubes is responsible for the severe consequences of chlamydial infection (25). These data clearly demonstrate that the particular morbidity associated with chlamydial infection in either sex depends on the nature of the specific anatomic site that is targeted. Although only the penile urethrae of male guinea pigs with chlamydial infection were examined for urethritis in the present study by histopathology, Rank et al. (26) previously observed that cystitis resulted from ascending infection to the bladder following intraurethral inoculation of chlamydiae into male guinea pigs; however, this occurrence was relatively rare in immunologically intact animals. In our earlier study, we also examined the vas deferens, epididymis, seminal vesicles, and prostate glands by histopathology and found no apparent inflammation or organisms in any of these tissues in normal animals. Only in one animal, which was immunosuppressed, did we find inflammation in the vas deferens and epididymis. In general, the nature and kinetics of the pathological response in the male guinea pig are virtually the same as those seen in the female cervix, endometrium, and oviducts (25).
The only other animal model for infection of males via the urethral route in which histopathology was examined is the mouse infected with Chlamydia muridarum (11). In a detailed study, Pal and colleagues were able to detect organisms in the urethrae, bladders, epididymides, and testes of infected mice, in contrast to GPIC infection of male guinea pigs. Moreover, they were able to detect organisms in the urethra and bladder for as long as 7 weeks after infection, considerably longer than we have seen in the guinea pig model. The histopathologic response was very similar to that of the guinea pig, with an acute inflammatory response developing later into a chronic inflammatory response.
The induction of a strong acute inflammatory response is supported by the expression of key proinflammatory cytokines, such as IL-8, IL-1β, and TNF-α, concomitant with the appearance of PMNs in the tissue. The levels of IL-8, IL-1β, and TNF-α were considerably lower following challenge infection than after primary infection, but this would be expected because of the lower number of chlamydiae present as a result of the adaptive immune response. Each of these cytokines is dependent on the interaction of chlamydiae with the host cell (16). The increase in the expression of CCL2 (MCP-1) would suggest that other cells, such as NK cells and dendritic cells, are also recruited to the urethra during a primary infection.
For the first time in the male, the local cellular response was evaluated by flow cytometry. The data largely supported the observations from the histopathologic analysis. There was a strong influx of CD45+ cells beginning on day 4, increasing to a peak response on day 14. CD45+ cells would include PMNs and the various mononuclear cells, so this measure reflects the overall cellular response. Both CD4 and CD8 cells were observed in the urethra in parallel to the CD45 response. Interestingly, in contrast to the female guinea pig and mouse models (7, 23), there were significantly more CD8 cells than CD4 cells in the target tissue. The appearance of B cells was somewhat delayed in the primary infection, and they reached their peak level about 7 days after the T cells. Unfortunately, because of the lack of reagents for the guinea pig, no other cell surface markers or cell populations could be quantified. Upon challenge infection, CD45+ cells appeared by day 2, more quickly than in the primary infection but not to the same level. Surprisingly, the B-cell response appeared to constitute the majority of the response to the challenge infection, while there was only a trivial influx of CD4 and CD8 cells. This was somewhat different from the response in the female, in which there was only a minimal influx of T and B cells into the cervix and endometrium following challenge infection. Levels of both T and B cells were markedly increased in the oviduct following challenge in contrast to the primary infection, indicating a clear anamnestic response in the upper genital tract. Obviously, it is difficult to compare the male and female completely because of the anatomic differences, but the fact that there is a stronger anamnestic response of B cells than of T cells in the male urethra is of interest and suggests that memory B cells/antibodies may play an important role in the resolution of challenge infections in the male.
The presence of CD4 and CD8 cells certainly suggests that an active cell-mediated immune response develops in the male urethra, and this was supported by the strong proliferative response to chlamydial antigen by lymphocytes derived from the draining lymph nodes. The response paralleled the presence of T cells in the urethra. The likelihood that the T-cell response is a Th1 response was supported by the presence of IFN-γ, IL-2, and IL-12p40 in the urethra, paralleling the T-cell response in the genital tract. There was an increase in IL-10 levels; however, the absolute amount of IL-10 was far less than that of IFN-γ, and so the response was clearly a Th1 response. The increase in CCL5 (RANTES) levels also paralleled the T-cell influx in the urethra, a response that would be expected because CCL5 (RANTES) is a major T-cell chemokine. Upon challenge infection, only CCL5 (RANTES) appeared to be elicited at a relatively high level, in contrast to the other chemokines and cytokines. CCL5 (RANTES) has been found to be important for immunity to chlamydial infections (28). The lower levels of IFN-γ, IL-2, and IL-12p40 following challenge are substantiated by the low T-cell response following challenge. While cell-mediated immunity has been found to be essential for the resolution of chlamydial genital infections in female guinea pigs and mice (18), one cannot yet make the same statements regarding the male.
The other major observation in this study was the quantification of the local GPIC-specific antibody response in urethral secretions. GPIC-specific IgG and IgA levels increased by days 14 to 21 and remained relatively constant in the local secretions after the primary infection. Upon challenge, there was a marked increase in local IgG and IgA levels in secretions but only a modest increase in serum. The source of the antibodies detected in the urethral secretions of infected males is not yet clear. It is likely that IgG was derived from serum and IgA was produced locally, but that remains to be determined. It is noteworthy that there were numerous plasma cells in the submucosal area of the penile urethra, which could be the origin of local antibody production. The increase in the level of B cells in the urethra paralleled the increase in local antibody levels. Since the B-cell and antibody responses upon challenge infection were more intense than the T-cell response, it is tempting to speculate that this branch of the immune response is critical for immunity to reinfection. In fact, we reported that male guinea pigs which were depleted of B cells by cyclophosphamide treatment, leaving cell-mediated immunity intact, had a longer course of infection with increased pathology (26). Moreover, Cunningham and colleagues recently demonstrated that polyimmunoglobulin receptor-mediated transport of IgA played an important role in the clearance of infection from the genital tracts of male mice (2). In female guinea pigs, humoral immunity is essential for the recovery of chlamydial genital infection (25), and immune serum-derived antibody contributed to protection against a genital tract infection (21). Immunity to reinfection in the genital tracts of female guinea pigs was also dependent on an intact humoral immune response (19).
In general, we have observed that the host response in the male urethra is similar both to the inflammatory response and to the humoral and cell-mediated immune responses to infection of the female genital tract. Nevertheless, there are two key differences between the male and the female. First, the CD8 T-cell response appears to be greater than the CD4 T-cell response in the male guinea pig. This is in contrast to the responses of the female guinea pig, in which the ratio of CD4 to CD8 cells is about 1:1 (23), and the female mouse, in which the ratio is about 2:1 (7). Second, upon challenge infection, the B-cell response is stronger than the T-cell response in the male guinea pig, in contrast to the responses in the female guinea pig and mouse (7, 23). The anamnestic B-cell response is accompanied by a sharp increase in both IgG and IgA levels in urethral secretions. We have observed previously that male guinea pigs have a high level of complete immunity for a longer time than female guinea pigs (13, 22). Whether these differences in the host response account for the “stronger” immunity in the male guinea pig remains to be determined.
Acknowledgments
This study was supported by grant AI059650 from the NIAID, NIH, and by the Arkansas Children's Hospital Research Institute and the Arkansas Biosciences Institute.
Editor: J. L. Flynn
Footnotes
Published ahead of print on 1 February 2010.
REFERENCES
- 1.Al-Mously, N., and A. Eley. 2007. Interaction of Chlamydia trachomatis serovar E with male genital tract epithelium results in secretion of proinflammatory cytokines. J. Med. Microbiol. 56:1025-1032. [DOI] [PubMed] [Google Scholar]
- 2.Cunningham, K. A., A. J. Carey, J. M. Finnie, S. Bao, C. Coon, R. Jones, O. Wijburg, R. A. Strugnell, P. Timms, and K. W. Beagley. 2008. Poly-immunoglobulin receptor-mediated transport of IgA into the male genital tract is important for clearance of Chlamydia muridarum infection. Am. J. Reprod. Immunol. 60:405-414. [DOI] [PubMed] [Google Scholar]
- 3.Digiacomo, R. F., J. L. Gale, S. P. Wang, and M. D. Kiviat. 1975. Chlamydial infection of the male baboon urethra. Br. J. Vener. Dis. 51:310-313. [DOI] [PMC free article] [PubMed] [Google Scholar]
- 4.Jacobs, N. F., Jr., E. S. Arum, and S. J. Kraus. 1978. Experimental infection of the chimpanzee urethra and pharynx with Chlamydia trachomatis. Sex. Transm. Dis. 5:132-136. [DOI] [PubMed] [Google Scholar]
- 5.Jantos, C., W. Baumgartner, B. Durchfeld, and H. G. Schiefer. 1992. Experimental epididymitis due to Chlamydia trachomatis in rats. Infect. Immun. 60:2324-2328. [DOI] [PMC free article] [PubMed] [Google Scholar]
- 6.Jantos, C. A., J. Augustin, B. Durchfeld-Meyer, W. Baumgartner, and H. G. Schiefer. 1998. Experimental genital tract infection with Chlamydia psittaci (GPIC agent) in male rats. Infection 26:126-130. [DOI] [PubMed] [Google Scholar]
- 7.Kelly, K. A., J. C. Walker, S. H. Jameel, H. L. Gray, and R. G. Rank. 2000. Differential regulation of CD4 lymphocyte recruitment between the upper and lower regions of the genital tract during Chlamydia trachomatis infection. Infect. Immun. 68:1519-1528. [DOI] [PMC free article] [PubMed] [Google Scholar]
- 8.Lopez, H., and J. M. Navia. 1977. A technique for repeated collection of blood from the guinea pig. Lab. Anim. Sci. 27:522-523. [PubMed] [Google Scholar]
- 9.Moller, B. R., and P. A. Mardh. 1980. Experimental epididymitis and urethritis in grivet monkeys provoked by Chlamydia trachomatis. Fertil. Steril. 34:275-279. [DOI] [PubMed] [Google Scholar]
- 10.Mount, D. T., P. E. Bigazzi, and A. L. Barron. 1973. Experimental genital infection of male guinea pigs with the agent of guinea pig inclusion conjunctivitis and transmission to females. Infect. Immun. 8:925-930. [DOI] [PMC free article] [PubMed] [Google Scholar]
- 11.Pal, S., E. M. Peterson, and L. M. de la Maza. 2004. New murine model for the study of Chlamydia trachomatis genitourinary tract infections in males. Infect. Immun. 72:4210-4216. [DOI] [PMC free article] [PubMed] [Google Scholar]
- 12.Pate, M. S., S. R. Hedges, D. A. Sibley, M. W. Russell, E. W. Hook III, and J. Mestecky. 2001. Urethral cytokine and immune responses in Chlamydia trachomatis-infected males. Infect. Immun. 69:7178-7181. [DOI] [PMC free article] [PubMed] [Google Scholar]
- 13.Patterson, T. L., and R. G. Rank. 1996. Immunity to reinfection and immunization of male guinea pigs against urethral infection with the agent of guinea pig inclusion conjunctivitis. Sex. Transm. Dis. 23:145-150. [DOI] [PubMed] [Google Scholar]
- 14.Pudney, J., and D. J. Anderson. 1995. Immunobiology of the human penile urethra. Am. J. Pathol. 147:155-165. [PMC free article] [PubMed] [Google Scholar]
- 15.Quinn, T. C., C. Gaydos, M. Shepherd, L. Bobo, E. W. Hook III, R. Viscidi, and A. Rompalo. 1996. Epidemiologic and microbiologic correlates of Chlamydia trachomatis infection in sexual partnerships. JAMA 276:1737-1742. [PubMed] [Google Scholar]
- 16.Ramsey, K. H. 2006. Alternative mechanisms of pathogenesis, p. 435-473. In P. M. Bavoil and P. B. Wyrick (ed.), Chlamydia: genomics and pathogenesis. Horizon Bioscience, Norfolk, United Kingdom.
- 17.Ramsey, K. H., L. S. Soderberg, and R. G. Rank. 1988. Resolution of chlamydial genital infection in B-cell-deficient mice and immunity to reinfection. Infect. Immun. 56:1320-1325. [DOI] [PMC free article] [PubMed] [Google Scholar]
- 18.Rank, R. G., and A. L. Barron. 1983. Effect of antithymocyte serum on the course of chlamydial genital infection in female guinea pigs. Infect. Immun. 41:876-879. [DOI] [PMC free article] [PubMed] [Google Scholar]
- 19.Rank, R. G., and A. L. Barron. 1983. Humoral immune response in acquired immunity to chlamydial genital infection of female guinea pigs. Infect. Immun. 39:463-465. [DOI] [PMC free article] [PubMed] [Google Scholar]
- 20.Rank, R. G., and A. L. Barron. 1987. Specific effect of estradiol on the genital mucosal antibody response in chlamydial ocular and genital infections. Infect. Immun. 55:2317-2319. [DOI] [PMC free article] [PubMed] [Google Scholar]
- 21.Rank, R. G., and B. E. Batteiger. 1989. Protective role of serum antibody in immunity to chlamydial genital infection. Infect. Immun. 57:299-301. [DOI] [PMC free article] [PubMed] [Google Scholar]
- 22.Rank, R. G., B. E. Batteiger, and L. S. F. Soderberg. 1988. Susceptibility to reinfection after a primary chlamydial genital infection. Infect. Immun. 56:2243-2249. [DOI] [PMC free article] [PubMed] [Google Scholar]
- 23.Rank, R. G., A. K. Bowlin, and K. A. Kelly. 2000. Characterization of lymphocyte response in the female genital tract during ascending chlamydial genital infection in the guinea pig model. Infect. Immun. 68:5293-5298. [DOI] [PMC free article] [PubMed] [Google Scholar]
- 24.Rank, R. G., A. K. Bowlin, R. L. Reed, and T. Darville. 2003. Characterization of chlamydial genital infection resulting from sexual transmission from male to female guinea pigs and determination of infectious dose. Infect. Immun. 71:6148-6154. [DOI] [PMC free article] [PubMed] [Google Scholar]
- 25.Rank, R. G., and M. M. Sanders. 1992. Pathogenesis of endometritis and salpingitis in a guinea pig model of chlamydial genital infection. Am. J. Pathol. 140:927-936. [PMC free article] [PubMed] [Google Scholar]
- 26.Rank, R. G., H. J. White, B. L. Soloff, and A. L. Barron. 1981. Cystitis associated with chlamydial infection of the genital tract in male guinea pigs. Sex. Transm. Dis. 8:203-210. [DOI] [PubMed] [Google Scholar]
- 27.Reed, L. J., and H. Muench. 1938. A simple method of estimating fifty percent endpoints. Am. J. Hyg. 27:493-497. [Google Scholar]
- 28.Sakthivel, S. K., U. P. Singh, S. Singh, D. D. Taub, J. U. Igietseme, and J. W. Lillard. 2008. CCL5 regulation of mucosal chlamydial immunity and infection. BMC Microbiol. 8:136. [DOI] [PMC free article] [PubMed] [Google Scholar]
- 29.Satterwhite, C. L., M. R. Joesoef, S. D. Datta, and H. Weinstock. 2008. Estimates of Chlamydia trachomatis infections among men: United States. Sex. Transm. Dis. 35:S3-S7. [DOI] [PubMed] [Google Scholar]
- 30.Schachter, J., and H. D. Caldwell. 1980. Chlamydiae. Annu. Rev. Microbiol. 34:285-309. [DOI] [PubMed] [Google Scholar]


