

Abstract
Objective
T2 mapping has been used widely in detecting cartilage degeneration in osteoarthritis. Several scanning sequences have been developed in the determination of T2 relaxation times of tissues. However, the derivation of these times may vary from sequence to sequence. This study seeks to evaluate the sequence dependent differences in T2 quantitation of cartilage, muscle, fat and bone marrow in the knee joint at 3 Tesla.
Methods
Three commercial phantoms and ten healthy volunteers were studied using 3T MR. T2 relaxation times of the phantoms, cartilage, muscle, subcutaneous fat, and marrow were derived using spin echo (SE), multi-echo spin echo (MESE), fast spin echo (FSE) with varying echo train length (ETL), spiral, and spoiler gradient (SPGR) sequences. The differences between these times were then evaluated using a student’s t-test. In addition, the SNR efficiency and coefficient of variation of T2 from each sequence were calculated.
Results
The average T2 relaxation time was 36.38 ± 5.76 ms in cartilage and 34.08 ± 6.55 ms in muscle, ranging from 27 to 45 ms in both tissues. The times for subcutaneous fat and marrow were longer and more varying, ranging from 41 to 143 ms and 42 to 160 ms, respectively. In FSE acquisition, relaxation time significantly increases as ETL increases (P < 0.05). In cartilage, the SE acquisition yields the lowest T2 values (27.52 ± 3.10 ms), which is significantly lower than those obtained from other sequences (P < 0.002). T2 values obtained from spiral acquisition (38.27 ± 6.45 ms) were higher than those obtained from MESE (34.35 ± 5.62 ms) and SPGR acquisition (31.64 ± 4.53 ms). These differences, however, were not significant (P > 0.05).
Conclusion
T2 quantification can be a valuable tool for the diagnosis of degenerative disease. Several different sequences exist to quantify the relaxation times of tissues. Sequences range in scan time, SNR efficiency, reproducibility, and 2D or 3D mapping. However, when choosing a sequence for quantitation, it is important to realize that several factors affect the measured T2 relaxation time.
Keywords: Magnetic Resonance Imaging, T2, quantitation, articular cartilage
Introduction
Osteoarthritis (OA) is a degenerative disease that results in morphological and biochemical changes in tissues of the joint, including cartilage, subchondral bone and bone marrow. In cartilage, it has been shown that biochemical changes in the proteoglycan and collagen matrix can precede morphological changes that happen at later stages of the disease. Therefore, detecting biochemical changes and small intracartilagenous lesions are critical for diagnosing OA and monitoring the disease progression as well as for evaluating therapeutic procedures.
Magnetic Resonance Imaging (MRI) has proven to be a useful non-invasive tool in imaging joint diseases. It provides multi-planar capabilities, high spatial resolution, and superior sensitivity to soft-tissue details. In addition to detecting structural changes, advanced MRI techniques have been shown to have the potential of probing biochemical changes in the tissue. In particular, spin-spin or T2 relaxation times, have been correlated with increase of water contents and damage to collagen network in cartilage during osteoarthritis (1–4).
Although T2 quantitation has been widely used in clinical trial due to its potential correlation with cartilage biochemistry, different scan sequences and acquisition parameters can result in different measured relaxation times. In order to develop a platform from which to diagnosis disease based on relaxation time, it is essential to identify how the quantitation of T2 relaxation times of musculoskeletal tissues varies as different scanning parameters are used.
There are several factors that can affect T2 quantification. Insufficient sampling of the T2 decay curve, RF and static field inhomogeneities, stimulated echoes, and T1 effects can all attribute to the incorrect quantitation of in vivo relaxation times (5). Currently the most commonly used T2 quantification sequences are spin-echo (SE) and fast spin-echo (FSE) sequences (6). Several pulse sequences have been developed in the determination of T2 relaxation times in musculoskeletal system. These sequences include the multi-echo spin-echo (MESE) sequence (7) and spiral sequence (8). Additionally, T2 relaxation time appears to decrease slightly as the magnitude of static magnetic field increases (8,9). Although many clinical MR scanners operate at 1.5 T, 3.0 T scanners are becoming more prevalent in the clinical setting. Studies show an increase of signal-to-noise ratio (SNR) and contrast-to-noise ratio (CNR) efficiencies as static magnetic field increases (8,10,11). Therefore, a high-field quantitation carries with it the advantage of increased sensitivity.
Even though the differences in T2 quantification using different sequences and parameters are known, comparisons of T2 values based on different sequences are very limited. Maier et al (7) and Mendlik et al (12) have compared T2 quantification based on SE and several multi-echo (ME) sequences at 1.5 T. To the best of our knowledge, no previous studies have systematically investigated measurement differences (T2 values, SNR and reproducibility) using sequences mentioned above (SE, FSE, MESE and spiral). In addition, with the increasing application of 3 T scanners in clinical settings, it is important to document tissue T2 relaxation times differences at this field strength.
All of the sequences mentioned are two dimensional (2D) acquisitions. A 3D acquisition may be desired, however, in T2 relaxation time quantitation. Three-dimensional imaging is free from artifacts caused by slice crosstalk. Therefore 3D sequences can generally have a thinner slice thickness, and consequently may provide a more accurate assessment of tissue relaxation properties.
The goal of this study was therefore twofold: 1) to evaluate the consistency of T2 quantification in healthy musculoskeletal tissues, including cartilage, muscle, bone marrow and subcutaneous fat, in the knee using different sequences at 3.0 Tesla, including SE, FSE, MESE and spiral acquisition; 2) to evaluate a new 3D T2 quantitation method, and to compare the results with currently available 2D sequences.
Materials and Methods
Phantoms and Subjects
Three commercial cylindrical T2 phantoms (Diagnostic Sonar, Livingston, UK) with different T2 values spanning the expected relaxation times of tissues of interest were studied. Each phantom was scanned from three to four times to investigate the reproducibility and quantification accuracy for each sequence. The phantoms were repositioned between scans at different location (center, left or right to the isocenter of the scanner).
The right knees of 10 healthy volunteers (6 males, 4 females, ages 21–31 years, mean age 27 years) were studied. All of the subjects had no clinical knee OA symptoms or other knee injuries. All of the volunteers provided informed consent in accordance with the rules by the Committee on Human Research at our institution.
All scans were implemented on a 3.0 T GE Excite Signa MR scanner (Waukesha, WI, USA) using a quadrature transmit/receive knee coil (Clinical MR Solutions, Brookfield, WI, USA).
Imaging Protocol
Phantoms and subjects were scanned using 7 separate sequences in axial plane: a spiral acquisition with a T2 preparation sequence (8), a multi-echo multi-slice spin echo sequence (7), a single-echo spin echo sequence, a fast spin echo sequences with varying echo train lengths (ETL = 4, 8, 16) and a 3D T2 quantification based on spoiled gradient echo (SPGR) acquisition developed in this study. The acquisition parameters for each sequence are described in detail as follows:
The T2 preparation of the spiral sequence was consisted of a 90 tip-down pulse, a train of equally spaced 180 pulses, and a (−90) tip-up pulse. Different TEs were generated by changing either the number of the 180 pulses or the interval between the 180 pulses (8). The acquisition parameters for the spiral sequence were: TR/TE = 2000/6.61, 17.26, 27.92, 49.25 ms, 14 interleaves/slice, 4096 points/interleaf, FOV = 14 cm, effective in-plane resolution = 0.6 × 0.6 mm, slice thickness = 4 mm, skip = 4 mm, number of slices = 14–16. The total acquisition time was approximately 11 min.
The acquisition parameters for the MESE were: TR/TE = 2000/7.84, 15.68, 23.52, 31.36, 39.2, 47.04, 54.88, 62.72 ms, matrix = 256 × 192, with all other parameters the same as the spiral sequence. Total acquisition time was approximately 9 min.
The acquisition parameters for the SE sequence were: TR/TE = 2000/16.9, 33.8, 50.7, 67.6 ms, matrix = 256 × 256 with all other parameters the same as the MESE sequence. Total acquisition time was approximately 9 min.
The TR/TE and acquisition time for the FSE of ETL 4, 8, and 16 were 2000/15.26, 30.52 ms, 5 min; 2000/15.26, 45.79 ms, 2 min; 2000/15.26, 76.32 ms, 1 min respectively. Only two echoes were acquired in FSE sequences due to limitation of the FSE sequence on the scanner. Large slice gap (4mm) was prescribed for all the 2D sequences in order to minimize quantification inaccuracy caused by potential cross-talk artifact. The matrix size was 256 × 256.
The T2 quantitation sequence based on 3D SPGR was composed with two parts: a nonselective T2 preparation and a 3D SPGR acquisition in an elliptic-centric trajectory in segmented k-space. The T2 preparation sequence was the same as what was used in the spiral T2 sequence. The data was acquired right after the T2 preparation, during the transient signal evolving towards the steady state. The number of α pulses after each T2 magnetization preparation was defined as views per segment (VPS). There was a relatively long delay (time of recovery, Trec) between each magnetization preparation to allow enough and equal recovery of the magnetization before each T1ρ preparation. The acquisition parameters were: TR = 9.3 ms, Trec = 1.5s, TE = 6.61, 17.26, 27.92, 49.25 ms, flip angle = 12, bandwidth = 31.25 KHz, matrix = 256 × 256, slice thickness = 4mm, NEX = 1, VPS = 48. The total acquisition time was approximately 10 min.
Image Post-Processing
Images were transferred to a Sun workstation (Sun Microsystems, Palo Alto, CA) for off-line post-processing. Regions of Interest (ROIs) were drawn around tissues of marrow, muscle, subcutaneous fat, and cartilage in slices where they were largest, as seen in Figure 1. For the cartilage tissue, the ROI was drawn in the slice where the patellar cartilage was the thickest. The marrow ROI was drawn in the slice with the largest femoral bone area. Similarly, subcutaneous fat and muscle ROIs were drawn where their regions were the largest. In order to minimize the effects of chemical shifts, JJ coupling effects, and changes in magnetic susceptibility on signal intensities, care was taken to insure that ROIs were not drawn in regions of the interfaces between the tissue being measured and surrounding tissue. Figure 1 shows the image of one knee with typical definition of ROI of these tissues.
Figure 1.
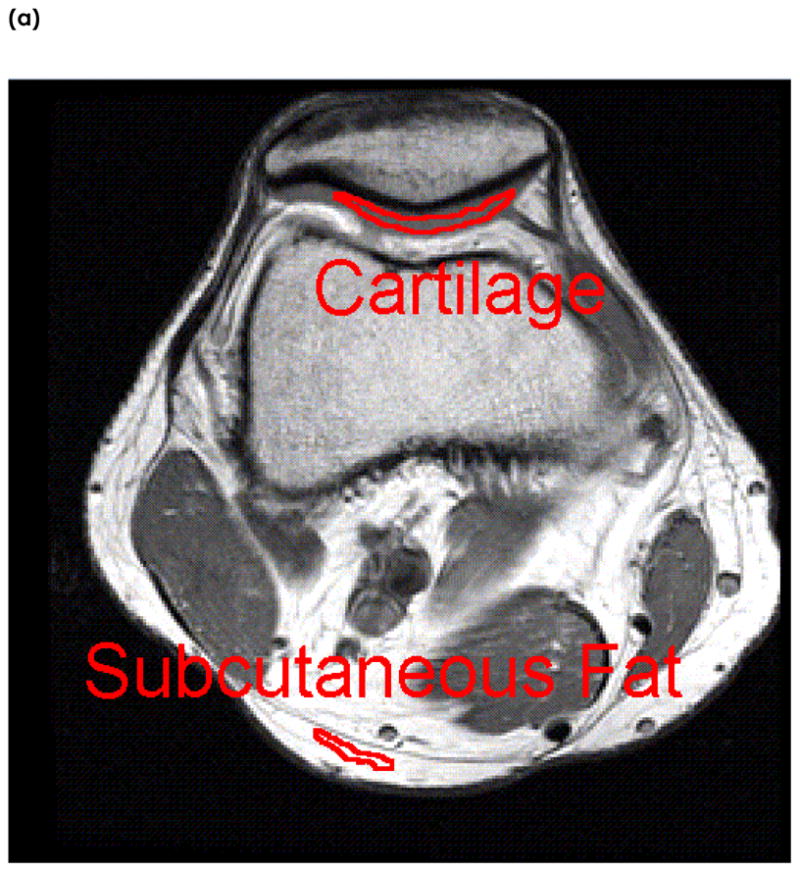
An example of Region of Interest (ROI) selection in one subject. The tissues examined are (a) cartilage and subcutaneous fat, and (b) marrow and muscle. ROIs are taken in slices where the tissues are the largest. ROIs are manually segmented well within the boundaries of surrounding tissues to reduce the effects of chemical shift and magnetic susceptibility on relaxation times.
A T2 map was reconstructed by fitting the image intensity pixel-by-pixel to the equation below using a Levenberg-Marquardt mono-exponential fitting algorithm developed in-house:
| (1) |
We ignored the relaxation times derived from the spiral and SPGR sequences in the subcutaneous fat and marrow regions because the spiral sequence contains a spectral-spatial pulse which suppresses signal in fat, and similarly, our SPGR sequence also contains fat suppression.
Statistical Analysis
Mean, Median, and Standard Deviations of T2 values were calculated for each tissue. A student’s t-test was used to compare the relaxation times acquired with different sequences. The Coefficient of Variance (CV) was also calculated across each tissue and across all sequences using the formula:
| (2) |
where Mi = Mean T2 relaxation time of the ith subject for a particular tissue
The Signal to Noise Ratio (SNR) efficiency was evaluated using the formula:
| (3) |
where
Because there were different voxel sizes among the sequences, SNR was normalized to voxel size.
Results
Phantom
The average CV of T2 quantification was lower than 8% in all three phantoms for all sequences, showing a good overall reproducibility, as seen in Table 1. After combining data from different sequences, the average CV was the highest (5.6%) in phantom #3, indicating the worst reproducibility. This phantom has the longest T2 relaxation time (103 ms) and the longest T1 relaxation time (926 ms). A high CV of 13.6% was observed in the FSE sequence with ETL = 16 in this phantom. After combining data from different phantoms, the average CV was the lowest in the MESE (1.3%) and SPGR (1.3%) acquisitions, and the highest in the FSE acquisition with ETL = 16 (6.7%).
Table 1.
Coefficients of Variation in (a) phantoms and (b) in vivo.
| (a) | ||||||||
|---|---|---|---|---|---|---|---|---|
| SE | MESE | FSE 4 | FSE 8 | FSE 16 | Spiral | SPGR | Average | |
| Phantom 1 | 0.066 | 0.008 | 0.036 | 0.019 | 0.026 | 0.037 | 0.003 | 0.028 |
| Phantom 2 | 0.038 | 0.001 | 0.027 | 0.026 | 0.026 | 0.039 | 0.051 | 0.030 |
| Phantom 3 | 0.068 | 0.028 | 0.061 | 0.045 | 0.075 | 0.016 | 0.006 | 0.043 |
| Average | 0.057 | 0.012 | 0.041 | 0.030 | 0.042 | 0.031 | 0.020 | 0.033 |
| (b) | |||||||
|---|---|---|---|---|---|---|---|
| SE | MESE | FSE 4 | FSE 8 | FSE 16 | Spiral | SPGR | |
| Cartilage | 0.053 | 0.054 | 0.071 | 0.073 | 0.070 | 0.051 | 0.042 |
| Muscle | 0.044 | 0.025 | 0.030 | 0.033 | 0.028 | 0.018 | 0.011 |
| Sub Fat | 0.024 | 0.025 | 0.123 | 0.053 | 0.032 | ||
| Marrow | 0.012 | 0.007 | 0.052 | 0.046 | 0.038 | ||
Figure 2 shows the T2 quantitation by different sequences in the phantoms as compared with the T2 relaxation times provided by the manufacturer. The SE acquisition significantly underestimated the T2 values. The average underestimate of the three phantoms was −21.0%. The T2 values obtained with FSE sequences increased with ETL, showing a 6.8%, 13.6% and 20.9% average overestimate by using the sequence with ETL = 4, 8 and 16, respectively. The T2 quantitation with MESE, spiral and SPGR show relatively good accuracy, with an average underestimate of −1.5%, −4.4% and −5.8% respectively. The quantitation of phantoms did not depend on their placements within the magnet bore.
Figure 2.

Relaxation times of three separate commercial phantoms with known times.
In vivo
The average cartilage T2 relaxation time is 36.38 ± 5.76 ms from all subjects ranging from 27 to 45 ms. The average muscle T2 times is 34.08 ± 6.55 ms, ranging from 27 to 45 ms. The times for subcutaneous fat and marrow were longer and more varying, ranging from 41 to 143 ms and 42 to 160 ms, respectively. The T2 relaxation times obtained from each sequence are shown in Figure 3.
Figure 3.


In vivo relaxation times of (a) cartilage and muscle, and (b) subcutaneous fat and marrow.
As ETL increases, the relaxation time of cartilage in the FSE acquisitions increases, as shown in figure 3(a). This trend was the same as that in phantoms. There was a significant difference (P = 8.4 E −7) between the FSE with ETL = 4 (37.25 ± 5.01 ms) and the FSE with ETL = 8 (41.08 ± 5.07 ms). There was also a significant difference (P= 1.7 E −6) between the FSE with ETL 8 (41.08 ± 5.07 ms) and the FSE with ETL = 16 (44.59 ± 5.50 ms).
In cartilage, the SE acquisition yields the lowest T2 values (27.52 ± 3.10 ms), which is significantly lower than those obtained from other sequences (P < 0.002). T2 values obtained from the spiral sequence (38.27 ± 6.45 ms) were higher than those obtained from MESE (34.35 ± 5.62 ms) and SPGR acquisition (31.64 ± 4.53 ms). These differences, however, were not significant (P > 0.05).
T2 relaxation times in muscles were lower than those in cartilage, while the values in marrow and subcutaneous fat were higher than those in cartilage. A similar trend of T2 relaxation time values using different sequences were observed in these tissues, as indicated in Figure 3(a) and (b).
The SNR efficiency was the greatest in the FSE sequence with ETL = 16 for all tissues, except for muscle, where the MESE sequence maintained the greatest SNR efficiency. In all tissues, the SE sequence maintained the lowest SNR efficiency, as shown in Figure 4.
Figure 4.

In vivo Signal to Noise Ration (SNR) across all sequences and tissues.
The CV in all sequences were all below 8%, as seen in Table 1. The highest CV, 12.3%, was observed in subcutaneous fat using the Fast Spin Echo sequence with 4 echoes. The lowest CV was observed in marrow, 0.7%, using the MSME sequence. In cartilage, the lowest CV was observed using the SPGR sequence. The spiral, SE, and MESE sequences produced similar CVs, but the FSE sequences produced the worst CVs.
Discussion
In this study, different sequences were used to quantify T2 relaxation time at 3T in musculoskeletal tissues, including cartilage, muscle, bone marrow and subcutaneous fat. A new 3D T2 mapping technique based on SPGR sequence was also proposed. The T2 relaxation time for each tissue or phantom was different for the different sequences. However the magnitude and the direction of sequence dependent difference between the T2 times were consistent across all tissues. For example, SE gives lowest T2 times for all tissues and FSE with 16 echoes gives the highest times. The FSE sequences tend to overestimate T2 relaxation time for all tissues.
In the Spin Echo sequence, we found a correspondence to previously reported values, except for the times found for subcutaneous fat (13). In this study, subcutaneous fat was a 38.8% lower than previously reported values. However, this discrepancy could be attributed to our lower TR and lower number of echoes in the SE sequence.
The MESE sequence yielded an increase in relaxation times of tissues, when compared with the SE sequence. An increase of 24.8% was seen in cartilage. This increased T2 relaxation time of MESE corresponds to the results in a previous study at 1.5T (7) where the authors observed a 10–13% increase in T2 using MESE sequences. The increased T2 values may be due to stimulated echoes generated in the multi-echo sequences. In this study, however, we also observed a significant underestimation of T2 values when compared with the known relaxation times provided by the manufacturer of the phantoms. Potential reasons of this underestimation include the imperfect slice profile in the SE sequence and the limited number of echoes.
One consistent trend in the determination of T2 relaxation times is the increase of measured T2 time as echo train length of the fast spin echo sequence increases. The fast spin echo sequence was part of an existing pharmaceutical protocol, which prompted us to test its performance. The estimated higher T2 values that we show with FSEs in phantoms and cartilage is consistent with the literature (6). Utilizing the student’s t test, the mean relaxation time of fast spin echo with 8 echo train lengths is significantly higher than fast spin echo with 4 echo train lengths in all tissues. Similarly, fast spin echo with 16 echo train lengths is significantly higher than fast spin echo with 8 echo train lengths in all tissues. Our FSE results correlate with the literature regarding slower T2 decays, resulting in abnormally high signal intensities in later echoes due to stimulated echo pathway created by the imperfect refocusing pulses in a multi-echo sequence (5,7,14). Other factors that affect the quantification accuracy in a multi-echo sequence include static field inhomogeneities and the error propagation introduced by off-resonance effects (15).
The relaxation times of cartilage and muscle in the spiral sequence correspond to findings in the literature with a study implemented at 3T (8). However, there is a significant difference between spin echo T2 for marrow and fat compared to T2 measured using fast spin echo and spiral sequences. This could be due to the unsaturated fat and saturated fat interactions, J-J coupling, in the preparatory part of the sequences modulating the T2 estimate. This clearly warrants further investigation.
A 3D T2 mapping technique based on SPGR acquisition has been proposed in this study. The data acquisition is right after the T2 magnetization, during the transient signal evolution towards the steady state. Thus acquiring data using centrically reordered phase encoding is critical so that the low spatial frequencies are sampled first. Although its SNR efficiency was mediocre when compared to other sequences, it achieved the lowest CV for the cartilage and muscle tissues. Three-dimensional T2 mapping may allow us to have thinner slices compared with 2D acquisition, and therefore provide more reliable information, e.g., on cartilage degeneration in osteoarthritis.
In conclusion, this study has examined the in vivo T2 quantitation at 3T using different 2D and 3D mapping techniques. The results from this study suggest that, when attempting to quantify, it is important to consider that different sequences have several factors that affect T2 quantitation. Moreover, different scanners can add additionally variability in T2 quantitation. From this study, it is vital to note that when comparing studies, for example, the OsteoArthritis Initiative dataset (16) compared to a smaller natural history study (17), it is not appropriate to compare the actual relaxation times, but the trends of relaxation times may be more appropriate.
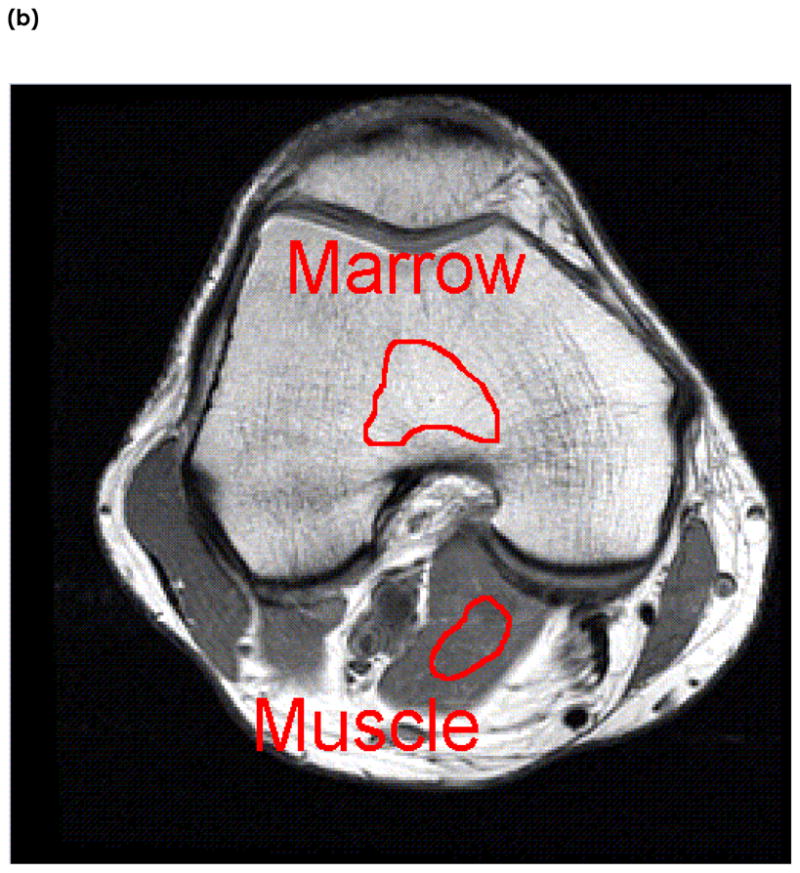
Figure 5.
T2 maps of patellar cartilage in one subject for each sequence. From left to right, then top to bottom, the sequences are SE, MESE, FSE ETL=4, FSE ETL=8, FSE ETL=16, spiral, and SPGR.
Footnotes
Publisher's Disclaimer: This is a PDF file of an unedited manuscript that has been accepted for publication. As a service to our customers we are providing this early version of the manuscript. The manuscript will undergo copyediting, typesetting, and review of the resulting proof before it is published in its final citable form. Please note that during the production process errors may be discovered which could affect the content, and all legal disclaimers that apply to the journal pertain.
References
- 1.Broderick LS, Turner DA, Renfrew DL, Schnitzer TJ, Huff JP, Harris C. Severity of articular cartilage abnormality in patients with osteoarthritis: evaluation with fast spin-echo MR vs arthroscopy. Am J Roentgenol. 1994;162(1):99–103. doi: 10.2214/ajr.162.1.8273700. [DOI] [PubMed] [Google Scholar]
- 2.David-Vaudey E, Ghosh S, Ries M, Majumdar S. T2 relaxation time measurements in osteoarthritis. Magnetic Resonance Imaging. 2004;22(5):673–82. doi: 10.1016/j.mri.2004.01.071. [DOI] [PubMed] [Google Scholar]
- 3.Dunn TC, Lu Y, Jin H, Ries MD, Majumdar S. T2 Relaxation Time of Cartilage at MR Imaging: Comparison with Severity of Knee Osteoarthritis. Radiology. 2004;232(2):592–8. doi: 10.1148/radiol.2322030976. [DOI] [PMC free article] [PubMed] [Google Scholar]
- 4.Mosher TJ, Dardzinski BJ, Smith MB. Human Articular Cartilage: Influence of Aging and Early Symptomatic Degeneration on the Spatial Variation of T2-Preliminary Findings at 3 T1. Radiology. 2000;214(1):259–66. doi: 10.1148/radiology.214.1.r00ja15259. [DOI] [PubMed] [Google Scholar]
- 5.Poon CS, Henkelman RM. Practical T2 quantitation for clinical applications. Journal of Magnetic Resonance Imaging. 1992;2(5):541–53. doi: 10.1002/jmri.1880020512. [DOI] [PubMed] [Google Scholar]
- 6.Bartlett PA, Symms MR, Free SL, Duncan JS. T2 relaxometry of the hippocampus at 3T. AJNR Am J Neuroradiol. 2007;28(6):1095–8. doi: 10.3174/ajnr.A0505. [DOI] [PMC free article] [PubMed] [Google Scholar]
- 7.Maier CF, Tan SG, Hariharan H, Potter HG. T2 quantitation of articular cartilage at 1.5 T. Journal of Magnetic Resonance Imaging. 2003;17(3):358–64. doi: 10.1002/jmri.10263. [DOI] [PubMed] [Google Scholar]
- 8.Gold GE, Han E, Stainsby J, Wright G, Brittain J, Beaulieu C. Musculoskeletal MRI at 3.0 T: Relaxation Times and Image Contrast. Am J Roentgenol. 2004;183(2):343–51. doi: 10.2214/ajr.183.2.1830343. [DOI] [PubMed] [Google Scholar]
- 9.Bottomley PA, Foster TH, Argersinger RE, Pfeifer LM. A review of normal tissue hydrogen NMR relaxation times and relaxation mechanisms from 1–100 MHz: Dependence on tissue type, NMR frequency, temperature, species, excision, and age. Medical Physics. 1984;11(4):425–48. doi: 10.1118/1.595535. [DOI] [PubMed] [Google Scholar]
- 10.Campeau NG, Huston J, 3rd, Bernstein MA, Lin C, Gibbs GF. Magnetic resonance angiography at 3.0 Tesla: initial clinical experience. Top Magn Reson Imaging. 2001;12(3):183–204. doi: 10.1097/00002142-200106000-00005. [DOI] [PubMed] [Google Scholar]
- 11.Kornaat, Reeder, Koo, Brittain, Yu, Andriacchi, Gold MR imaging of articular cartilage at 1.5T and 3.0T: Comparison of SPGR and SSFP sequences. Osteoarthritis and Cartilage. 2005;13(4):338–44. doi: 10.1016/j.joca.2004.12.008. [DOI] [PubMed] [Google Scholar]
- 12.Mendlik T, Faber SC, Weber J, Hohe J, Rauch E, Reiser M, Glaser C. T2 quantitation of human articular cartilage in a clinical setting at 1.5 T: implementation and testing of four multiecho pulse sequence designs for validity. Invest Radiol. 2004;39(5):288–99. doi: 10.1097/01.rli.0000119196.50924.f3. [DOI] [PubMed] [Google Scholar]
- 13.de Bazelaire CMJ, Duhamel GD, Rofsky NM, Alsop DC. MR Imaging Relaxation Times of Abdominal and Pelvic Tissues Measured in Vivo at 3.0 T: Preliminary Results. Radiology. 2004;230(3):652–9. doi: 10.1148/radiol.2303021331. [DOI] [PubMed] [Google Scholar]
- 14.Majumdar S, Orphanoudakis SC, Gmitro A, O’Donnell M, Gore JC. Errors in the measurements of T2 using multiple-echo MRI techniques. I. Effects of radiofrequency pulse imperfections. Magn Reson Med. 1986;3(3):397–417. doi: 10.1002/mrm.1910030305. [DOI] [PubMed] [Google Scholar]
- 15.Majumdar S, Orphanoudakis SC, Gmitro A, O’Donnell M, Gore JC. Errors in the measurements of T2 using multiple-echo MRI techniques. II. Effects of static field inhomogeneity. Magn Reson Med. 1986;3(4):562–74. doi: 10.1002/mrm.1910030410. [DOI] [PubMed] [Google Scholar]
- 16.Vol. 2007. National Institutes of Health; 2007. http://www.oai.ucsf.edu/datarelease/ [Google Scholar]
- 17.Stahl R, Blumenkrantz G, Carballido-Gamio J, Zhao S, Munoz T, Hellio Le Graverand-Gastineau MP, Li X, Majumdar S, Link TM. MRI-derived T2 relaxation times and cartilage morphometry of the tibio-femoral joint in subjects with and without osteoarthritis during a 1-year follow-up. Osteoarthritis Cartilage. 2007 doi: 10.1016/j.joca.2007.04.018. [DOI] [PubMed] [Google Scholar]