Abstract
Repulsive guidance cues induce growth cone collapse or collapse and retraction. Collapse results from disruption and loss of the actin cytoskeleton. Actin rich regions of growth cones contain binding proteins that influence filament organization, such as Arp2/3, cortactin, and fascin, but little is known about the role that these proteins play in collapse. Here we show that Semaphorin 3A (Sema 3A), which is repulsive to mouse dorsal root ganglion neurons, has unequal effects on actin binding proteins and their associated filaments. The immunofluorescence staining intensity of Arp-2 and cortactin decreases relative to total protein, while in unextracted growth cones fascin increases. Fascin and myosin IIB staining redistribute and show increased overlap. The degree of actin filament loss during collapse correlates with filament superstructures detected by rotary shadow electron microscopy. Collapse results in the loss of branched f-actin meshworks, while actin bundles are partially retained to varying degrees. Taken together with the known affects of Sema 3A on actin, this suggests a model for collapse that follows a sequence; depolymerization of actin meshworks followed by partial depolymerization of fascin associated actin bundles and their movement to the neurite to complete collapse. The relocated fascin associated actin bundles may provide the substrate for actomyosin contractions that produce retraction.
Keywords: growth cones, actin, collapse, semaphorin, fascin, Arp2/3, cortactin
INTRODUCTION
During both development and neuronal regeneration, growth cone guidance is essential for pathfinding and target selection. One guidance factor that has been shown to be a key player for influencing pathfinding of both developing and regenerating neurons is the secreted repulsive cue Sema 3A (Kolodkin, 1996), (Pasterkamp et al., 1999). Sema 3A’s primary role in the nervous system is to repel growth cones from inappropriate areas and to help steer both axons and migrating cells along the correct trajectory (Yamamoto et al., 2002). The 65 kD protein is thought to act a dimer (Wong et al., 1999) binding to the receptors neurophilin-1 and Plexin A1 to initiate signal transduction pathways (Adams, 1997; Takahashi et al., 1999). In-vitro characterization of the growth cone response to Sema 3A depicts a collapse phase followed by a retraction phase when conditions are appropriately adjusted (Gallo, 2006; Brown et al., 2009).
F-actin loss is associated with the Sema 3A induced growth cone collapse response (Fan et al., 1993). The actin-severing and depolymerizing protein cofilin (Moriyama and Yahara, 1999), a downstream target of LIM kinase, was both activated and inhibited sequentially during Sema 3A treatment and also correlated with collapse (Aizawa et al., 2001). Although cofilin dependent severing and depolymerization may be the primary pathway responsible for actin filament loss during exposure to Sema 3A, other pathways involving reactive oxygen species have not been eliminated (Terman et al., 2002); (Fiaschi et al., 2006). Experiments with GFP-tagged paxillin have shown that Sema 3A treatment leads to loss of point contacts or increased turnover rates (Wen and Zheng, 2006; Woo and Gomez, 2006), perhaps contributing to growth cone collapse. Sema 3A induced retraction has been shown to be myosin II dependent (Gallo, 2006; Brown et al., 2009). Furthermore myosin-IIA loss from the growth cone correlates with collapse, and redistribution of myosin-IIB (and IIC) to the rear of the growth cone and neck, may drive the active process of retraction (Brown et al., 2009). In addition, (Gallo, 2006) observed movements of YFP-actin spots that may provide the basis for an increase in F-actin in neurites exposed to Sema 3A. The increased f-actin in neurites may provide the substrate for myosin II dependent contractions that lead to retraction. However relatively little is known about the changes that the different actin superstructures undergo during the Sema 3A response or what role the actin-binding proteins that contribute to the formation of these structures play in the response.
While actin monomers are capable of spontaneously self-assembling into polarized bi-helical filaments that are dynamic even at steady state (Pak et al., 2008), higher-order networks require regulation by actin-binding proteins. In growth cones the two primary actin superstructures are lamellipodia or veils, primarily composed of branched actin meshworks but often penetrated by actin bundles (microspikes), and filopodia, which contain a core of actin bundles (Rodriguez et al., 2003; Gallo and Letourneau, 2004; Mongiu et al., 2007). In the case of lamellipodia, both Arp2/3 and cortactin have been shown to be present at the leading edge but largely excluded from filopodia (Svitkina and Borisy, 1999; Cheng et al., 2000). The Arp2/3 complex acts as an actin nucleator that can bind to an existing actin filament and initiate the branching of a new daughter strand off the parent giving rise to a branched network of actin (Pak et al., 2008). It has also been implicated in the initiation of new filopodia formation (Korobova and Svitkina, 2008), but may have less of a role in growth cones (Strasser et al., 2004). Cortactin is known to bind Arp2/3 and potentiate the activity of the Arp2/3 complex (Uruno et al., 2001). Fascin crosslinks and stabilizes actin bundles (Sasaki et al., 1996; Aratyn et al., 2007). In growth cones fascin has been shown to localize to filopodia as well as the microspikes in the lamellipodia (Cohan et al., 2001). The dynamics and cross-linking properties of fascin contribute to the stabilization of bundled actin filaments necessary for filopodial protrusion (Vignjevic et al., 2006). In noneuronal cells fascin stabilized bundles of filopodia can also incorporate into the lamellipodia and contribute to contractile arrays (Nemethova et al., 2008).
While many of these actin-binding proteins and the actin superstructures they help form have been investigated for quite some time, it is only recently that we are beginning to understand how this relates to neuronal guidance. Some intriguing discoveries include the regulation of cortactin activity though phosphorylation. ERK-mediated phosphorylation may increase cortactin’s activity and Src-mediated phosphorylation may decrease it (Martinez-Quiles et al., 2004). However, this on-off switch model may be an oversimplification, because Src-mediated phosphorylation may increase cortactin’s association with myosin light chain kinase (Dudek et al., 2002). Src-mediated phosphorylation of cortactin has also been implicated in EphA mediated axon repulsion (Knoll and Drescher, 2004). Early studies have shown that increased fascin expression increases cell migratory activity (Yamashiro et al., 1998). Fascin-bundled actin has also been implicated in myosin based retraction of filopodia (Ishikawa et al., 2003). Yet this still leaves the question of how actin-binding proteins such as Arp2/3, cortactin, and fascin respond to Sema 3A.
Our goal was to better understand the effect of Sema 3A on the actin cytoskeleton by studying how different actin superstructures and associated binding proteins change during growth cone collapse. Does actin organization affect the degree or rate of change? Can actin binding proteins also influence the response? To accomplish this goal we used a combination of light and electron microscopy to visualize changes in actin organization and levels of the binding proteins cortactin, Arp-2 and fascin.
MATERIALS AND METHODS
Reagents
Sema 3A was purchased from R&D Systems. Stock solutions were stored at −70 ° C for up to three months. The anti-β-actin antibody and rhodamine phalloidin were purchased from Sigma. The monoclonal antibodies to Arp-2, cortactin, and fascin were gifts of Dr. John A. Cooper.
Cell culture
DRG neurons from E13.5–14 mice were used for all experiments. The peripheral nerve culture methods have previously been described by (Bridgman et al., 2001). Explants were plated on separate coverslips coated with polyornithine (0.1 mg/ml) and laminin-1 (9.6 or 32 µg/ml), and then grown overnight at 37 ° C in medium containing 50 ng/ml nerve growth factor (NGF; mouse 2.5s, Harlan). After overnight growth and 40–60 minutes prior to application of Sema 3A, the cultures were switched to low NGF (5 ng/ml) medium. Gradient application of Sema 3A was performed using pulses (2 Hz) from a micropipette as previously described (Brown et al., 2009). For bath application medium pre-equilibrated with CO2 and warmed in the incubator was used to dilute stock solutions of Sema 3A to the appropriate concentration. This was then used to exchange the medium in the culture. Exposure was usually terminated by addition of warm fixative (4% paraformaldehyde). Time-lapse images of bath applied Sema 3A were taken on a Zeiss LSM 510 Meta NLO equipped with a stage incubator that regulated temperature and CO2. For comparison of the laminin concentration on the Sema 3A response, DRG neurons were grown in a culture dish with a glass bottom that was separated into two chambers using a Sylgard seal. The two sides were coated with different concentrations of laminin-1.
Immunofluorescence
For immunofluorescence, cells were prepared as previously described (Rochlin et al., 1995; Brown and Bridgman, 2003), except for those labeled with the monoclonal to fascin or permeabilized prior to fixation. Briefly the normal procedure involved fixation with 4% paraformaldehyde, permeabilization with Triton X 100 and blocking with a mixture of BSA, fish gelatin and goat serum. To stain f-actin, rhodamine phalloidin was added to the Triton X 100 permeabilization solution. For fascin staining cells were fixed and permeabilized using 10 min incubation with cold (−20 ° C) methanol. For ratio imaging and analysis, fixed cells were permeabilized with Triton X 100 and then incubated for 1 hr with activated Cy3 (CyDye; Amersham) to label total protein (Kolega, 2006) prior to blocking and antibody labeling. For extraction of soluble protein prior to fixation, cells were permeabilized with 0.01% saponin in a cytoskeletal stabilization buffer (Bridgman, 2002) supplemented with 6 µM phalloidin (or rhodamine labeled phalloidin) and 12 µM taxol. One to five minutes after permeabilization cells were then fixed with 4% paraformaldehye in stabilization buffer or cold methanol. Labeling was as described above. Controls were stained with Cy3, but were treated only with the secondary antibody. Images were taken using an Olympus confocal or an inverted microscope equipped with a Cooke Sensicam.
Quantitative analysis
For ratio imaging and analysis, Cy3 dye images of growth cones and a short length of connecting neurite (4–5 µm) were individually traced by hand using the ROI tool in IPLab. The ROI boundary was transferred to the complementary immunofluorescence image. The mean intensity values per pixel within the complementary ROIs were measured and expressed as a ratio. Image exposures were taken at times to keep the intensity values within the linear range of the camera or detector. Collapsed growth cones in fixed cultures where defined as a neuronal process that lacks any obvious lamellipodia and fewer then 2 filopodia (Kapfhammer et al., 2007). For purposes of analysis the distal 10 µm of the neurite in fully collapsed growth cones was used for fluorescence intensity measurements. For most of the analysis we did not separate collapsed growth cones from uncollapsed growth cones because a preliminary assessment indicated that segregating the growth cones into such classes did not appear to substantially change the results. However in some cases (indicated in the Results) to verify this assessment, we did separate out fully collapsed growth cones from uncollapsed or partially collapsed for analysis.
Electron Microscopy
Rotary shadow EM was performed on explant cultures as previously described (Bridgman, 2002).
RESULTS
Sema 3A induced growth cone collapse
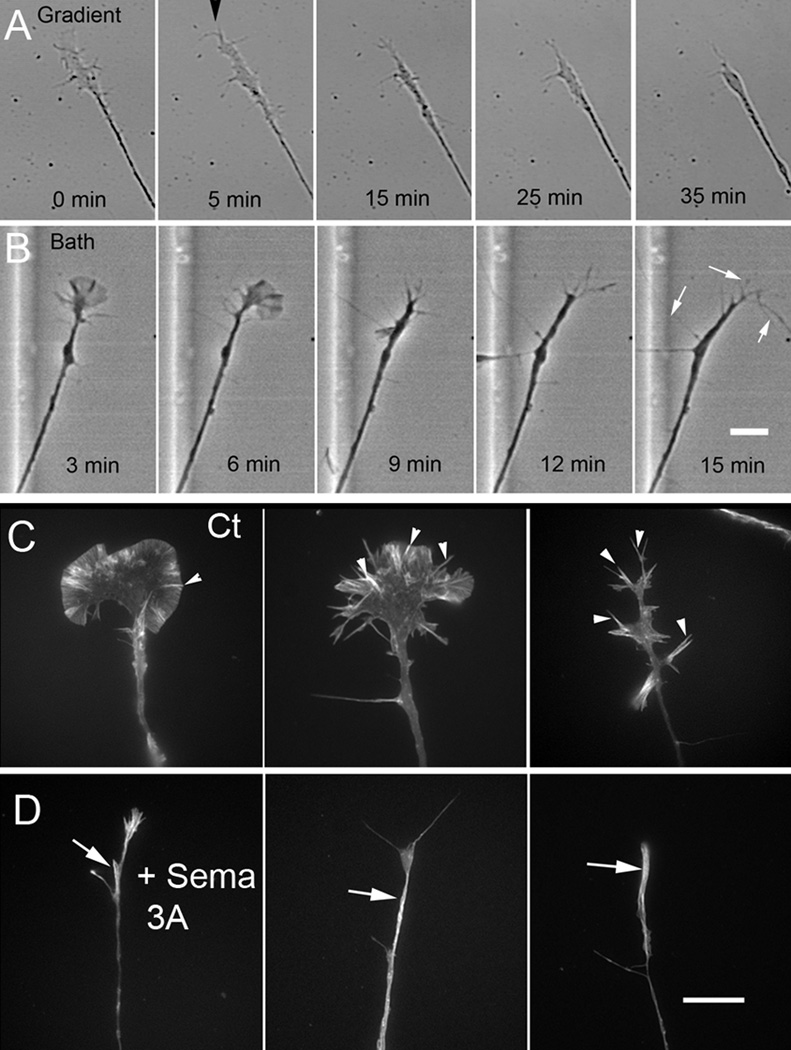
DRG growth cone collapse can be induced by applying Sema 3A either as a gradient or by directly adding it to the bath (Fig. 1). Depending upon the mode of application there are some slight differences in collapse characteristics. Gradient application has a more consistent affect on growth cones. It produces a prolonged collapse phase that is very frequently followed by retraction as the second phase (Brown et al., 2009). Since cytoplasmic volume must be conserved the decrease in growth cone area observed in the collapse phase is usually translated into an increase in neurite volume sometimes in the form of a distinct bulge (Fig. 1A). Bath application of relatively high concentrations of Sema 3A produces a more abrupt collapse phase prior to retraction (Gallo, 2006; Brown et al., 2009). Applications of lower concentrations of Sema 3A (500 ng/ml or below) induces the collapse phase in the majority of growth cones, and only rarely retraction. A minority population show little response and so do not collapse (Brown et al., 2009). The only detectable difference in behavior between collapse observed during gradient application and a low concentration of bath applied Sema 3A is that a transient increase in the length in a subset of filopodia is frequently observed in the latter (Fig. 1B) (Fan et al., 1993). Most growth cones lose the filopodia by 30 minutes of treatment and so appear fully collapsed. However others may retain the long filopodia and collapse is incomplete (retain 2 or more filopodia) despite a large reduction in growth cone area (Kapfhammer et al., 2007). Despite this difference, collapse in response to low concentrations of bath applied Sema 3A is thought to represent the first phase of a response that does not go to completion because desensitization or degradation of Sema 3A in serum containing medium may progress faster than the cytoskeletal changes. This results in an eventual return to normal growth cone structure and advance.
Figure 1.
DRG growth cone collapse in response to a Sema 3A gradient and affect on actin filament staining. (A) or a low concentration applied directly to the bath (B). (A) Gradient application produces a prolonged collapse phase usually followed by retraction (not shown). Gradient application (arrowhead) begins at the 5 min time point. (B) Bath application of 500 ng/ml Sema 3A (applied at 0 min) produces a more abrupt collapse after a short delay. Filopodia often elongate (arrows) prior to full collapse. Retraction with this concentration was rare. Bar= 12 µm. (C) Rhodamine phalloidin staining reveals f-actin distribution in untreated DRG growth cones. Bright streaks of stain (arrowheads) associate with bundled actin in microspikes or filopodia. (D) Bath application of Sema 3A (500 ng/ml for 30 min) causes partial to full collapse but does not eliminate rhodamine phalloidin staining. The increased staining in the neurite (arrows) may represent actin bundles and/or increased thickness. Bar=8 µm.
It has been proposed that actin bundles form in the distal portions of neurites to act as a substrate for the actomyosin contractions that lead to retraction during Sema 3A treatment (Gallo, 2006). Alternatively actin bundles may simply redistribute to provide the substrate for retraction. It is often difficult to determine the organizational state of f-actin by light microscopy especially in thick regions of cells and neurites. For instance we found it difficult to be certain that variations in rhodamine phalloidin staining along neurites following Sema 3A treatment resulted from bundles of f-actin or thickness variations and the close association of two neurites. Therefore we used a combination of light and electron microscopy to study actin organization during the Sema 3A induced collapse phase.
Actin filament loss during collapse is primarily through depolymerization
Growth cone actin filaments are organized either as branched actin filament meshworks or bundles (Letourneau et al., Lewis and Bridgman, 1991). Rhodamine phalloidin staining shows bundles as bright linear arrays in filopodia or as microspike that appear as stripes of staining with varying definition within lamellipodia (Fig. 1C). Actin meshworks appear as bright but ill defined staining within lamellipodia and less bright staining in the central region (Fig. 1C). Collapse has been shown to be associated with an overall reduction of rhodamine phalloidin staining consistent with loss of f-actin (Fan et al., 1993). However, rhodamine phalloidin staining of growth cones following bath applied Sema 3A treatment often shows bright staining in terminal portions of neurites of collapsed growth cones or neck region of growth cones that have not completely collapsed consistent with a population of actin filaments that has persisted and redistributed or reformed (Fig. 1D). The staining intensity sometimes showed intensity variations, bright spots or streaks. As already indicated, it is often difficult to determine if this bright f-actin staining results from the increased staining normally associated with bundles.
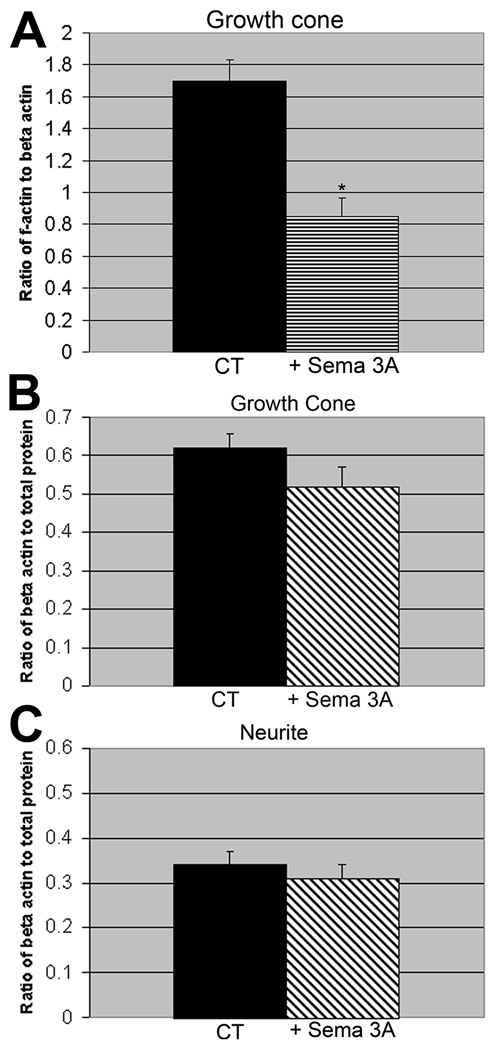
To confirm that f-actin decreases compared to total actin upon bath application of Sema 3A, we determined the ratio of rhodamine phalloidin staining to β actin immunostaining. The ratio decreased significantly indicating that the proportion of filamentous actin decreased in response to Sema 3A treatment (Fig. 2A) consistent with net depolymerization. To determine if growth cone collapse also leads to loss of actin compared to total protein we compared the ratio of β-actin to total protein before and after Sema 3A treatment. No significant change in the ratio was seen in either the growth cone (Fig. 2B) or the process 50µm back from the neck (Fig. 2C). The antibody recognized both G and F-actin and therefore is not sensitive to the polymerization state of the actin. This suggests that Sema 3A treatment results in net actin depolymerization, but does not cause significant loss through modification or degradation of actin relative to other proteins, at least within a 30 minute time period. It is difficult to directly determine loss of total protein with this approach, but we assume that it will be roughly proportional to the decrease in growth cone area or total Cy3 fluorescence (Fig. 1) (Brown et al., 2009), as the cytoplasm moves to the neurite during collapse.
Figure 2.
Sema 3A induced collapse produces a net decrease in f-actin relative to total actin (A), but no significant decrease relative to total protein in the growth cone (B) or neurite (C). (A) The ratio of f-actin (rhodamine phalloidin staining) to total actin (immunostaining with a monoclonal antibody to β-actin) is significantly (*) decreased following bath application of Sema 3A (500 ng/ml for 30 min). (P=0.001, s.e.m.=0.04, 0.11 N= 43). (B) The ratio of β-actin immunostaining to total protein (activated Cy3 dye staining) in the growth cone is not reduced by Sema 3A treatment (500 ng/ml for 30 min). (P=0.13, s.e.m.=0.04, 0.05 N=25). (C) The ratio of β-actin immunostaining to total protein (activated Cy3 dye staining) in the neurite is not reduced by Sema 3A treatment (500 ng/ml for 30 min). (P=0.52, s.e.m.=0.03, 0.03 N=25). The same cells were analyzed for B and C.
Actin filament loss depends on organization
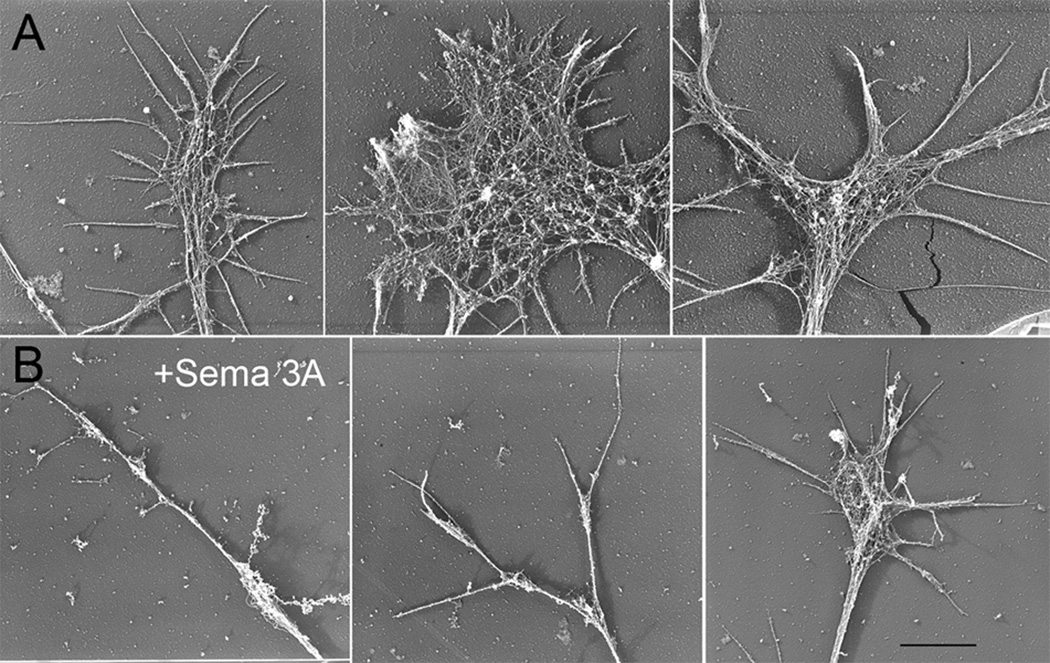
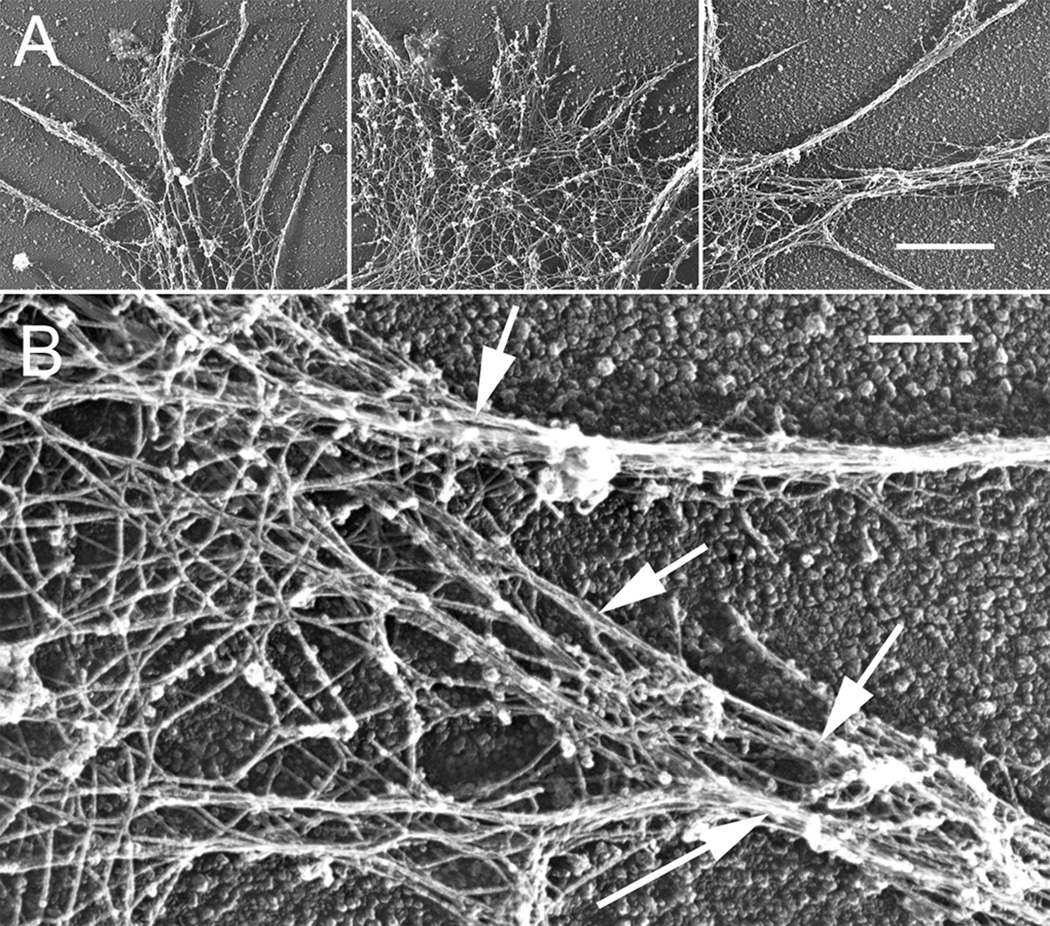
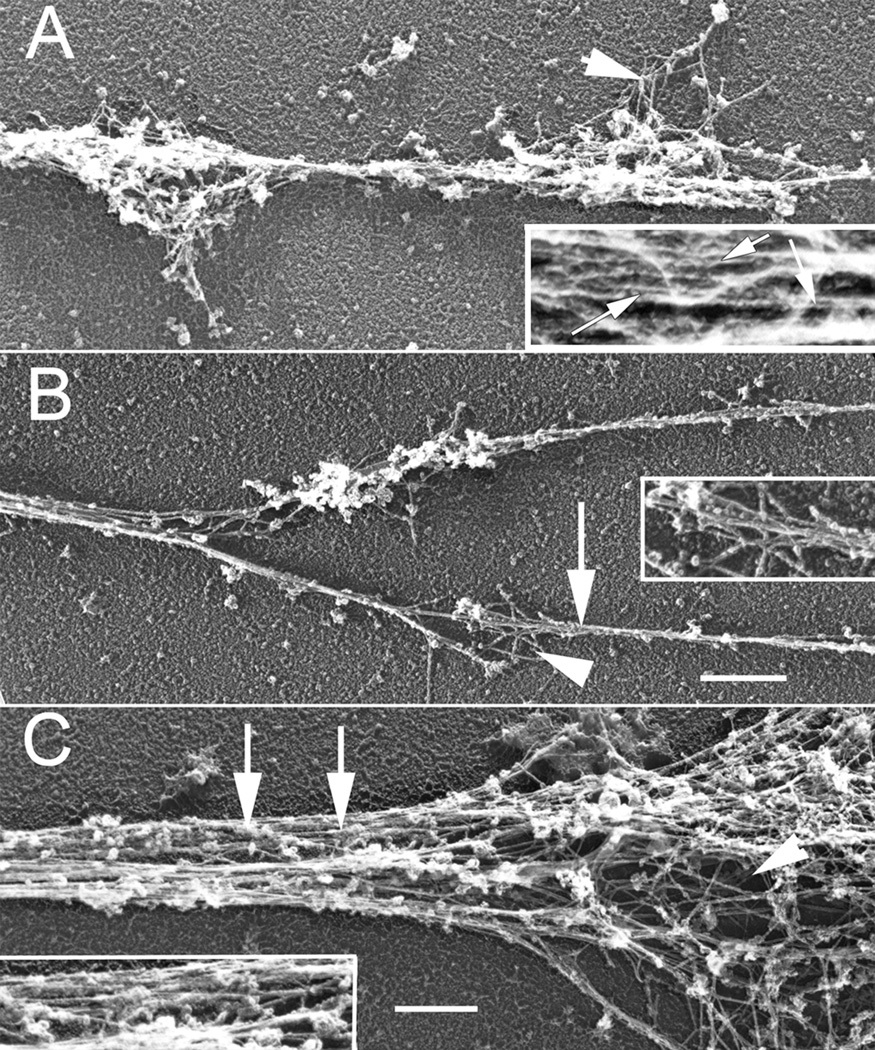
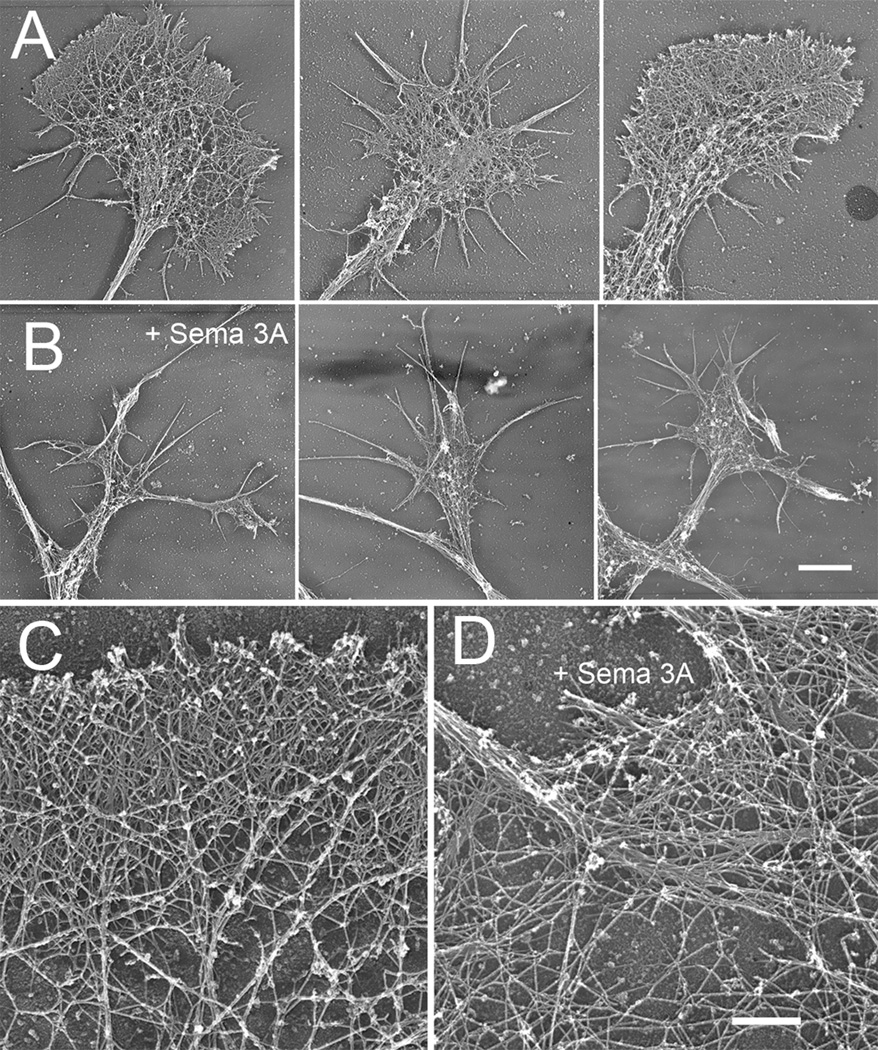
In order to more clearly determine the change in bundled or meshwork actin filaments associated with Sema 3A treatment, we used rotary shadow EM of growth cones (Bridgman, 2002). Low magnification images reflected the range of growth cone morphologies observed by light microscopy for both control and Sema 3A treated growth cones (Fig. 3). Higher magnification images of control growth cones showed the different actin filament populations arranged as either branched meshworks or bundles (Fig. 4). After Sema 3A treatment actin filament meshworks of lamellipodia were nearly entirely eliminated from fully collapsed growth cones (Fig. 5). Bundles of thin filaments were retained in neurites of fully collapsed growth cones (Fig. 5A). In addition, neurites associated with fully collapsed growth cones contained small areas of actin meshwork in periodic expansions (probably varicosities seen by light microscopy) that occurred along their length (Fig. 5A). The residual filopodial structures of partially collapsed growth cones contained bundled actin filaments, although often the bundles were thin compared to those of control growth cones or growth cones that were not as fully collapsed (Fig. 5B, C). Very small areas of actin meshwork were sometimes seen to interdigitate between the bundles (Fig. 5B). Growth cones that were partially collapsed and contained residual lamellipodia and filopodia retained both actin meshworks and bundles (Fig. 5C). Thus both actin meshworks and actin bundles were eliminated to varying degrees by Sema 3A treatment. The degree of elimination correlated with the extent of growth cone collapse. In general branched actin filament meshworks were affected by the Sema 3A treatment to a much greater degree than actin filament bundles.
Figure 3.
Rotary shadow EM of untreated growth cones (A) and following bath application of Sema 3A (500 ng/ml for 30 min) (B). (A) Low magnifications reveal growth cones with varying morphologies similar to those observed by light microscopy. The amount of f-actin organized as bundles and meshworks varies depending on the degree of spreading. (B) Treatment with Sema 3A causes variable decreases in growth cone area from full to partial collapse. Most fully or partially collapsed growth cones lack lamellipodia or a distinct central domain containing actin meshworks. Bar=8 µm.
Figure 4.
Rotary shadowed EM higher magnification views of untreated growth cones. (A) Higher magnification views from the same growth cones in Figure 4 showing f-actin organized as bundles or meshworks. (B) A high magnification view showing f-actin meshworks integrated with bundles (arrows) of varying sizes. A, Bar=2 µm; B, Bar=500 nm.
Figure 5.
Rotary shadowed EM higher magnification views of Sema 3A treated growth cones from Figure 4. (A) The neurite of a fully collapsed growth cone contains small amounts of actin meshwork (arrowhead) in varicosities and bundles (arrows) along its length (inset). (B) A partially collapsed growth cone containing two filopodia with thin f-actin bundles (arrow) and small areas of meshwork (arrowhead)(inset). (C) A partially collapse growth cone that still retains both meshworks (arrowhead) and bundles (arrows and inset). A & B, Bar= 720 nm; C, Bar= 600 nm.
Actin binding proteins associated with actin superstructures are differentially affected by Sema 3A treatment
Elimination of actin meshworks by Sema 3A treatment suggests that actin binding proteins normally found within actin meshworks may also decrease. To determine if this was the case we compared immunofluoresence staining for cortactin and Arp-2 between control and Sema 3A treated cultures. Because the Sema 3A treatment induces a large morphological change, the antibody staining intensities were expressed as ratios with staining for total protein.
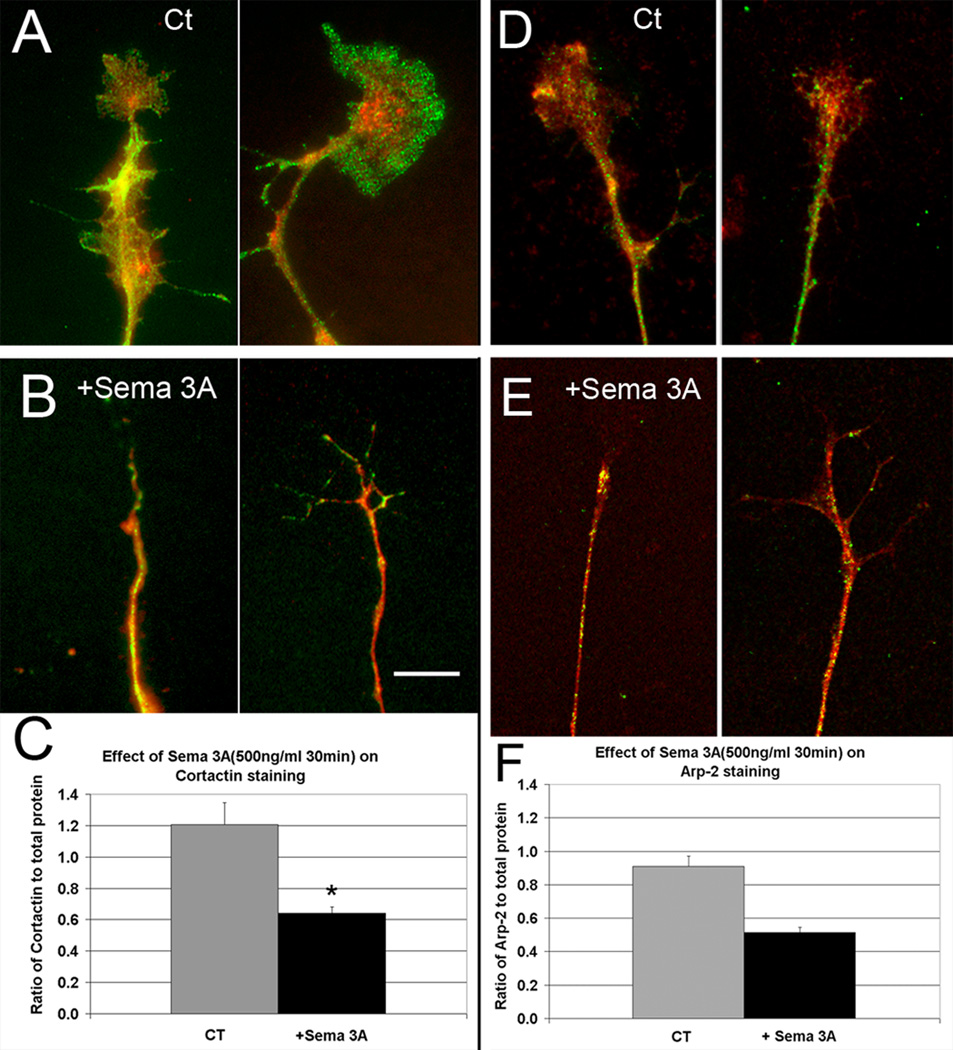
Bath application of a low concentration of Sema 3A (500 µg/ml) decreased cortactin staining relative to total protein (Fig. 6A–C). The same result was seen for Arp-2 (Fig. 6D–F). However the proportion of fascin staining increased relative to total protein (Fig. 7). Since low concentrations of Sema 3A produce a range of responses from total collapse to little detectable collapse, we also compared the staining of fully collapsed growth cones to controls. The staining for all three proteins were still significantly changed in the same directions (P=0.05, 0.03, 0.001 respectively). This suggests that the loss of cortactin and Arp-2 results from release from actin meshworks that are depolymerized upon Sema 3A application and that this occurs even in growth cones that are not fully collapsed but have lost most of their actin meshwork. In contrast the proportion of fascin staining increases relative to total protein upon Sema 3A treatment. This may be because fascin stabilized actin bundles are more resistant to depolymerization and are often retained in growth cones that only partially collapsed, as well as in neurites of fully collapsed growth cones.
Figure 6.
Sema 3A treatment reduces the proportion of cortactin and Arp-2 staining relative to total protein. (A) Untreated growth cones showing cortactin staining (green) compared to staining for total protein (red). (B) Following Sema 3A treatment (bath application of 500 ng/ml for 30 min) cortactin staining is reduced compared to total protein in the residual growth cone and connecting neurite. (C) Quantitative comparison of the ratio of cortactin staining to total protein. The decrease (*) was significant (P=0.0002, s.e.m.=0.14, 0.04, N=40). B, Bar= 8 µm. (D) Sema 3A treatment reduces the proportion of Arp-2 staining relative to total protein. Untreated growth cones showing Arp-2 staining (green) compared to staining for total protein (red). (E) Following Sema 3A treatment (bath application of 500 ng/ml for 30 min) Arp-2 staining is reduced compared to total protein in the residual growth cone and connecting neurite. (F) Quantitative comparison of the ratio of Arp-2 staining to total protein. The decrease (*) was significant (P=0.0001, s.e.m.= 0.06, 0.03 N= 40 for each). E, Bar= 8 µm.
Figure 7.
Sema 3A treatment increases the proportion of fascin staining relative to total protein. (A) Untreated growth cones showing fascin staining (green) compared to staining for total protein (red). (B) Following Sema 3A treatment (bath application of 500 ng/ml for 30 min) fascin staining is increased compared to total protein in the residual growth cone and connecting neurite. (C) Quantitative comparison of the ratio of fascin staining to total protein. The decrease (*) was significant (P=0.001, s.e.m.=0.04, 0.11 N= 43). B, Bar= 10 µm.
In order to more fully characterize the changes in actin binding proteins that occur upon Sema 3A treatment, we also compared the antibody staining in growth cones that were permeabilized in a cytoskeleton stabilization buffer prior to fixation. Under these conditions f-actin was retained because staining with rhodamine phalloidin remained bright in actin rich peripheral regions (Supplemental Figure 1). To insure that soluble protein was released by the permeabilization protocol, we also permeabilized growth cones of cells that were cultured from YFP expressing mice. Within 1 minute following permeabilization, no detectable YFP fluorescence was detectable (data not shown). Permeabilization for 1 minute reduced the antibody staining of both cortactin and fascin in growth cones. By 5 minutes both cortactin and fascin staining was not detectable above background. Staining of Arp-2 was not affected even after 5 minutes. The reduction is staining for fascin was much faster than the reduction in GFP-fascin fluorescence observed following permeabilization of nonneuronal cells in a previous study (Vignjevic et al., 2006). However in that study, polyethyleneglycol slowed fascin dissociation from actin filaments. Faster dissociation was observed in the absence of polyethyleneglycol. We did not use polyethethyleneglycol and this probably contributes to the difference. Loss of fascin (and possibly cortactin) is likely to result from dissociation from actin and diffusion out of the cell upon permeabilization probably because of the low affinity interaction with actin required for fast cycling of fascin binding (Vignjevic et al., 2006). A similar reduction in staining for cortactin has not been reported. Treatment of cells with Sema 3A for 30 minutes prior to permeabilization caused further decreases in staining intensity for all three proteins (Supplemental Figure 2). For cortactin the staining was reduced to background levels making it impossible to obtain quantitative ratio data. The Arp-2 staining ratio was very similar to that of unpermeabilized cells, while the fascin staining ratio differed. Instead of the ratio increasing upon Sema 3A treatment, it decreased. This suggests that the increased ratio observed upon Sema 3A treatment in unpermeabilized growth cones may only partially result from the persistence of fascin stabilized actin filament bundles. A possible explanation for the different result with the two conditions is that increased cycling of fascin binding to f-actin during the Sema 3A treatment may keep the local concentration of fascin in the growth cone high as it collapses. Upon permeabilization free and loosely bound fascin, which may be greater in Sema 3A treated growth cones, can then dissociate from f-actin and diffuses out of the growth cone.
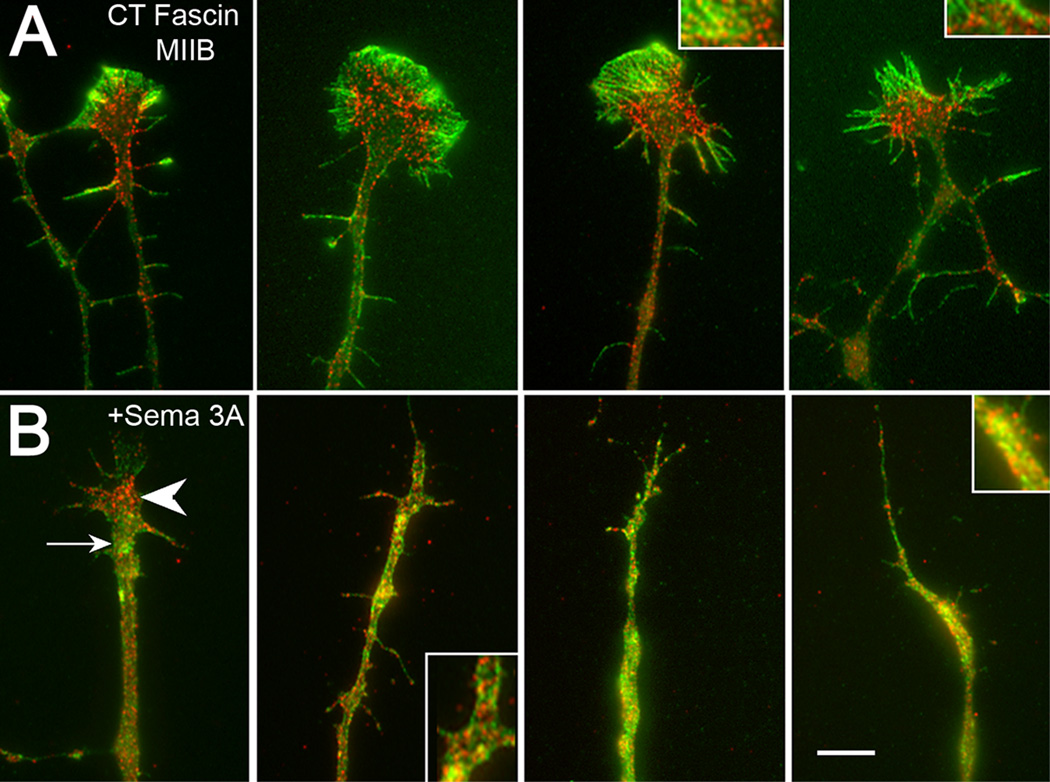
Fascin stabilized actin bundles may provide the substrate for myosin II induced retraction in response to Sema 3A (Gallo, 2006). Myosin IIB is a major contributor to the retraction response (Brown et al., 2009). To determine the relationship between myosin IIB and fascin we double stained control and Sema 3A treated growth cones (Fig. 8). In control growth cones fascin staining was consistently more peripheral than myosin II B staining (Fig. 8A). Overlap only occurred in the region of the transition zone (between peripheral and central domains). This distribution is consistent with a role for myosin IIB in driving retrograde flow normally observed in advancing growth cones (Brown and Bridgman, 2003). Following Sema 3A treatment both fascin and myosin IIB redistributed (Fig. 8B). In partially collapsed growth cones the relationship between fascin and myosin IIB was reversed compared to controls. Fascin was located mainly at the neck of the growth cone, while myosin IIB staining was located peripheral to the fascin staining. In more fully collapsed growth cones the staining showed extensive overlap in growth cones remnants and neurites (Fig. 8B).
Figure 8.
Fascin and myosin IIB show little overlap prior to Sema 3A treatment. After treatment staining redistributes and overlap increases. (A) Control growth cones stained for fascin (green) and myosin IIB (red). Fascin staining is consistently more peripheral than myosin IIB staining. Overlap in staining (insets) occurs only in a restricted area in the transition zone between the peripheral and central domains. (B) Sema 3A treated (500 ng/ml, 30 min) growth cones show varying degrees of collapse and overlap. Partially collapsed growth cones (left panel) show inversion of staining relationship. Fascin staining (arrow) is now predominately associated with the neck of the growth cone, and myosin IIB staining (arrowhead) is peripheral to this distribution. In more fully collapsed growth cones staining overlaps (insets). Bar=5 µm.
Myosin IIA contributes to collapse (Brown et al., 2009) and has also shown to be involved in retraction of neuroblastoma cells (Wylie and Chantler, 2003). Myosin IIA showed less extensive overlap with fascin in controls and the overlap did not appear to increase after Sema 3A treatment except in portions of the neurite further from the growth cone (Supplemental Fig. 3). This is consistent with our previous finding that following Sema 3A treatment myosin IIA increases in the neurite in the region starting 50 µm from the neck of the growth cone (Brown et al., 2009).
High substrate bound laminin-1 inhibits Sema 3A induced changes
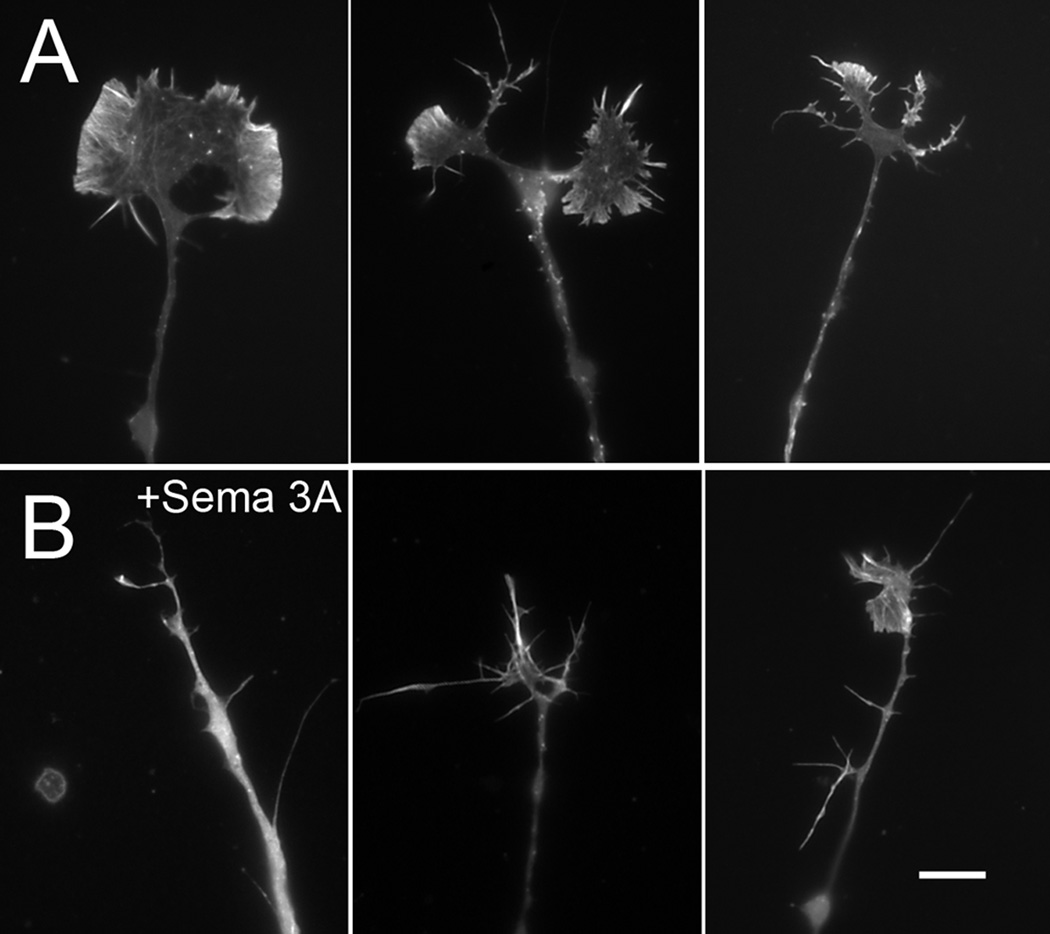
From previous work we know that high substrate bound laminin-1 can inhibit collapse in response to bath application of low concentrations of Sema 3A (Brown et al., 2009). To test if this has an effect on the degree of actin binding protein loss, we determined the staining ratios of growth cones on high laminin-1. No significant change was observed in any of the actin binding proteins upon Sema 3A treatment (Fig. 9). Rhodamine phalloidin staining revealed that growth cones had a range of staining patterns similar to those on low laminin-1, but that a significantly greater proportion of growth cones were not collapsed or only partially collapsed following Sema 3A treatment (Fig. 10) (Brown et al., 2009). Rotary shadow EM of growth cones on high laminin-1 gave similar results. The majority (∼ 55%) of growth cones in Sema 3A treated cultures grown on high laminin-1 were not collapsed consistent with our previous results (Brown et al., 2009) and retained actin filaments organized both as meshwork and bundles (Fig. 11). In these growth cones the density of actin meshworks at the leading edge appeared somewhat reduced (Fig. 11D) consistent with a lack of protrusion and veil retraction (Mongiu et al., 2007). This indicates that the proportional changes in actin binding proteins roughly correlated with the degree of f-actin loss from meshworks and bundles. When both remain relatively intact as on high substrate bound laminin-1 the proportion of actin binding proteins to total protein remains unchanged. When the loss of actin filaments was more extreme due to more extensive collapse as on low substrate bound laminin-1, then actin binding proteins showed significant changes. Therefore the changes observed in binding proteins when DRG neurons are growing on low substrate bound laminin-1 and then treated with Sema 3A are unlikely to be directly induced by the treatment, but most likely reflect the state and organization of the actin filaments with which they normally associate.
Figure 9.
Growing DRG neurons on high substrate bound laminin-1 prevents changes in actin binding proteins in response to Sema 3A treatment (500 ng/ml for 30 min). (A) The proportion of Arp-2 staining relative to total protein was unchanged following Sema 3A treatment (P>0.05). (B) The proportion of fascin staining relative to total protein was unchanged following Sema 3A treatment (P>0.05). (C) The proportion of Arp-2 staining relative to total protein was unchanged following Sema 3A treatment (P>0.05).
Figure 10.
Growing DRG neurons on high substrate bound laminin inhibits growth cone collapse and loss of f-actin. (A) Untreated neurons growing on high substrate bound laminin-1 stained with rhodamine phalloidin to reveal the distribution of f-actin. (B) Treatment with Sema 3A produces a range of morphologies, but the majority of growth cones did not fully collapse and still contain abundant f-actin within filopodia and lamellipodia. Bar= 8 µm.
Figure 11.
Rotary shadow EM of DRG growth cones growing on high substrate bound laminin. Growth cones from both untreated (A) and Sema 3A treated (500 ng/ml, 30 min) (B) contain f-actin organized as meshworks or bundles. The amount of area containing actin meshworks appears reduced. Bar= 6 µm. (C) High magnification rotary shadow EM views showing f-actin organization of untreated growth cones on high substrate bound laminin. (D) Actin meshworks persist after Sema 3A treatment, but sometimes show larger open areas and reduced density at the leading edge. Bundled f-actin appears unchanged. Bar= 700 nm.
DISCUSION
Collapse of growth cones in response to repulsive cues such as Sema 3A involves the loss of the actin rich structure lamellipodia and filopodia and correlates with reduced rhodamine phalloidin staining (Fan et al., 1993). Since phalloidin interacts specifically with f-actin this reduction in staining has been assumed to represent net loss of actin filaments probably through depolymerization. Our data is consistent with this interpretation; actin filament staining decreases relative to staining for total actin. However f-actin organization into superstructures and stabilization depend upon the interaction with multiple actin binding proteins that can affect the turnover or stability of f-actin. Bundled actin that forms the core of filopodia may be stabilized by proteins such as fascin that localize to filopodia, or through mechanisms independent of bundling (Hotta et al., 2005). In at least one case a repulsive cue induced the loss of actin bundles before affecting the actin meshwork suggesting a differential effect on actin filaments that is dependent on their organization (Zhou and Cohan, 2001). Therefore it has been unclear whether repulsive cues such as Sema 3A induce the loss of f-actin independent of location and the association with actin binding proteins or organization. This information is important for understanding why repulsive cues such as Sema 3A can induce different effects on growth cones that include: turning, partial or full collapse without retraction or collapse followed by retraction.
Our results suggest that Sema 3A treatment induces loss of actin filament meshworks to a greater extent than bundled actin filaments irrespective of the degree of collapse. This is supported by the changes in the rotary shadow images of the cytoskeleton, the staining for actin and actin binding proteins. Fascin associated actin bundles appear to be more resistant to Sema 3A induced loss compared to actin meshworks associated with Arp-2 and cortactin. The decrease in Arp-2 and cortactin staining is likely to result from movement to the neurite by diffusion following release from growth cone actin meshworks. In partially collapsed growth cones, f-actin bundles associated with fascin rich peripheral structures such as filopodia and microspikes are partially retained leading to a proportional increase in staining for fascin due to a reduction in total protein in areas that contained actin meshworks.. Full collapse also leads to a proportional increase in fascin staining in the remaining neurite that is likely partially associated through rapid cyclic binding with the actin filament bundles found there (Vignjevic et al., 2006).
If cells are permeabilized prior to fixation, then fascin staining drops upon treatment with Sema 3A possibility because of reduced binding to actin or a change in binding affinity. However the relatively high amount of fascin (bound or unbound) found in the neurite during Sema 3A treatment may stimulate the reformation of larger bundles from the small bundles that have relocated to the neurite and were identified as moving bright YFP-actin spots in a previous report (Gallo, 2006). This is consistent with the role of fascin as an actin filament crosslinker that has been implicated in filopodia elongation through its ability to induce reformation or elongation of bundles (Vignjevic et al., 2006). The reformed fascin associated f-actin bundles can then provide the substrate for myosin II dependent contractions that cause retraction. The increased overlap of fascin and myosin IIB staining following collapse is consistent with this possibility. However reformation of f-actin bundles and association with myosin IIB in response to low concentrations of bath appliead Sema 3A does not usually cause retraction suggesting that the process is incomplete. This may be because desensitization or degradation of Sema 3A in the medium occurs prior to the actomyosin contractions that drive retraction. This may explain why both gradient application of Sema 3A and bath application of high concentrations of Sema 3A more frequently lead to retraction. Gradient application from a micropipette gives a continuous source of new Sema 3A in the medium, while bath applications of high concentrations of Sema 3A induce more rapid changes. Peripheral actin filaments organized as branched meshworks or bundles will be more greatly affected in a Sema 3A gradient than actin filaments and myosin II located toward the rear of the cone and neurite. Similarly, focal complexes in the peripheral domain will be affected to a greater degree by a gradient compared to those at the rear of the cone. However because a gradient is less likely to cause desensitization or result in degradation, these changes can occur leading to a prolonged collapse phase followed by retraction. In contrast bath application of Sema 3A will affect all actin structures simultaneously and if net depolymerization of actin outpaces the relocation of actin bundles and myosin II, as well as decreased peripheral adhesion, then retraction can not occur. A gradient is more likely to mimic the in vivo response of a growth cone to Sema 3A.
Supplementary Material
Supplemental Figure 1. Effect of saponin permeabilization prior to fixation on actin staining. Growth cones were either fixed, permeabilized (A–C) and then stained with rhodamine phalloidin (A) or an antibody to β-actin (B) or first permeabilized with saponin (5 min) (D–F), stained with rhodamine phalloidin (D), fixed and then stained with the antibody to β-actin (E). The staining shows overlap in both cases (C and F) and the peripheral staining is nearly identical indicating that f-actin is preserved. Bar=6 µm.
Supplemental Figure 2. Permeabilization with saponin prior to fixation and its effect on staining for actin binding proteins. Permeabilization (1 min) reduced staining for cortactin (A) even in cells that were not treated with Sema 3A. Treatment with Sema 3A (500 ng/ml, 30 min) caused further reduction in staining that was at background levels (B). Therefore a comparison of the ratios of specific staining was not possible. Staining for Arp-2 showed little change with permeabilization (5 min) (C). Upon treatment with Sema 3A (D), the staining ratio was significantly (*) reduced (P=0.0014). Permeabilization (1 min) also reduced the staining ratio for fascin (F). Treatment with Sema 3A (500 ng/ml, 30 min) caused a further significant (*) reduction (P=0.01). Bar=10 µm.
Supplemental Figure 3. Fascin and myosin IIA show variable overlap prior to Sema 3A treatment. After treatment staining redistributes and overlap increases only in the region of the neurite relatively far from the residual growth cone. (A) Control growth cones stained for fascin (green) and myosin IIA (red). Overlap in staining is more variable from growth cone to growth cone than for myosin IIB. (B) Sema 3A treated (500 ng/ml, 30 min) growth cones still show varying degrees of collapse. Fascin staining (arrow) is now predominately peripheral to the distribution of myosin IIA, but in some growth cones it can interdigitate (middle panel) or overlap in the neurite (right panel). Bar=10 µm.
Acknowledgements
Grady Phillips provided expert technical assistance. This work was supported by NIH grant NS026150, Neuroscience Blueprint Core Grant NS057105 to Washington University and the Bakewell Family Foundation.
REFERENCES
- Adams JC. Characterization of cell-matrix adhesion requirements for the formation of fascin microspikes. Mol Biol Cell. 1997;8:2345–2363. doi: 10.1091/mbc.8.11.2345. [DOI] [PMC free article] [PubMed] [Google Scholar]
- Aizawa H, Wakatsuki S, Ishii A, Moriyama K, Sasaki Y, Ohashi K, Sekine-Aizawa Y, Sehara-Fujisawa A, Mizuno K, Goshima Y, Yahara I. Phosphorylation of cofilin by LIM-kinase is necessary for semaphorin 3A-induced growth cone collapse. Nat Neurosci. 2001;4:367–373. doi: 10.1038/86011. [DOI] [PubMed] [Google Scholar]
- Aratyn YS, Schaus TE, Taylor EW, Borisy GG. Intrinsic dynamic behavior of fascin in filopodia. Mol Biol Cell. 2007;18:3928–3940. doi: 10.1091/mbc.E07-04-0346. [DOI] [PMC free article] [PubMed] [Google Scholar]
- Bridgman PC. Growth cones contain myosin II bipolar filament arrays. Cell Motil Cytoskeleton. 2002;52:91–96. doi: 10.1002/cm.10038. [DOI] [PubMed] [Google Scholar]
- Bridgman PC, Dave S, Asnes CF, Tullio AN, Adelstein RS. Myosin IIB is required for growth cone motility. J Neurosci. 2001;21:6159–6169. doi: 10.1523/JNEUROSCI.21-16-06159.2001. [DOI] [PMC free article] [PubMed] [Google Scholar]
- Brown JA, Wysolmerski RB, Bridgman PC. Dorsal root ganglion neurons react to semaphorin 3A application through a biphasic response that requires multiple myosin II isoforms. Molecular Biology of the Cell. 2009 doi: 10.1091/mbc.E08-01-0065. [DOI] [PMC free article] [PubMed] [Google Scholar]
- Brown ME, Bridgman PC. Retrograde flow rate is increased in growth cones from myosin IIB knockout mice. J Cell Sci. 2003;116:1087–1094. doi: 10.1242/jcs.00335. [DOI] [PubMed] [Google Scholar]
- Cheng Y, Leung S, Mangoura D. Transient suppression of cortactin ectopically induces large telencephalic neurons towards a GABAergic phenotype. J Cell Sci. 2000;113(Pt 18):3161–3172. doi: 10.1242/jcs.113.18.3161. [DOI] [PubMed] [Google Scholar]
- Cohan CS, Welnhofer EA, Zhao L, Matsumura F, Yamashiro S. Role of the actin bundling protein fascin in growth cone morphogenesis: localization in filopodia and lamellipodia. Cell Motil Cytoskeleton. 2001;48:109–120. doi: 10.1002/1097-0169(200102)48:2<109::AID-CM1002>3.0.CO;2-G. [DOI] [PubMed] [Google Scholar]
- Dudek SM, Birukov KG, Zhan X, Garcia JG. Novel interaction of cortactin with endothelial cell myosin light chain kinase. Biochem Biophys Res Commun. 2002;298:511–519. doi: 10.1016/s0006-291x(02)02492-0. [DOI] [PubMed] [Google Scholar]
- Fan J, Mansfield SG, Redmond T, Gordon-Weeks PR, Raper JA. The organization of F-actin and microtubules in growth cones exposed to a brain-derived collapsing factor. J Cell Biol. 1993;121:867–878. doi: 10.1083/jcb.121.4.867. [DOI] [PMC free article] [PubMed] [Google Scholar]
- Fiaschi T, Cozzi G, Raugei G, Formigli L, Ramponi G, Chiarugi P. Redox regulation of beta-actin during integrin-mediated cell adhesion. J Biol Chem. 2006;281:22983–22991. doi: 10.1074/jbc.M603040200. [DOI] [PubMed] [Google Scholar]
- Gallo G. RhoA-kinase coordinates F-actin organization and myosin II activity during semaphorin-3A-induced axon retraction. J Cell Sci. 2006;119:3413–3423. doi: 10.1242/jcs.03084. [DOI] [PMC free article] [PubMed] [Google Scholar]
- Gallo G, Letourneau PC. Regulation of growth cone actin filaments by guidance cues. J Neurobiol. 2004;58:92–102. doi: 10.1002/neu.10282. [DOI] [PubMed] [Google Scholar]
- Hotta A, Inatome R, Yuasa-Kawada J, Qin Q, Yamamura H, Yanagi S. Critical role of collapsin response mediator protein-associated molecule CRAM for filopodia and growth cone development in neurons. Mol Biol Cell. 2005;16:32–39. doi: 10.1091/mbc.E04-08-0679. [DOI] [PMC free article] [PubMed] [Google Scholar]
- Ishikawa R, Sakamoto T, Ando T, Higashi-Fujime S, Kohama K. Polarized actin bundles formed by human fascin-1: their sliding and disassembly on myosin II and myosin V in vitro. J Neurochem. 2003;87:676–685. doi: 10.1046/j.1471-4159.2003.02058.x. [DOI] [PubMed] [Google Scholar]
- Kapfhammer JP, Xu H, Raper JA. The detection and quantification of growth cone collapsing activities. Nat Protoc. 2007;2:2005–2011. doi: 10.1038/nprot.2007.295. [DOI] [PubMed] [Google Scholar]
- Knoll B, Drescher U. Src family kinases are involved in EphA receptor-mediated retinal axon guidance. J Neurosci. 2004;24:6248–6257. doi: 10.1523/JNEUROSCI.0985-04.2004. [DOI] [PMC free article] [PubMed] [Google Scholar]
- Kolega J. The role of myosin II motor activity in distributing myosin asymmetrically and coupling protrusive activity to cell translocation. Mol Biol Cell. 2006;17:4435–4445. doi: 10.1091/mbc.E06-05-0431. [DOI] [PMC free article] [PubMed] [Google Scholar]
- Kolodkin AL. Semaphorins: mediators of repulsive growth cone guidance. Trends Cell Biol. 1996;6:15–22. doi: 10.1016/0962-8924(96)81033-6. [DOI] [PubMed] [Google Scholar]
- Korobova F, Svitkina T. Arp2/3 complex is important for filopodia formation, growth cone motility, and neuritogenesis in neuronal cells. Mol Biol Cell. 2008;19:1561–1574. doi: 10.1091/mbc.E07-09-0964. [DOI] [PMC free article] [PubMed] [Google Scholar]
- Martinez-Quiles N, Ho HY, Kirschner MW, Ramesh N, Geha RS. Erk/Src phosphorylation of cortactin acts as a switch on-switch off mechanism that controls its ability to activate N-WASP. Mol Cell Biol. 2004;24:5269–5280. doi: 10.1128/MCB.24.12.5269-5280.2004. [DOI] [PMC free article] [PubMed] [Google Scholar]
- Mongiu AK, Weitzke EL, Chaga OY, Borisy GG. Kinetic-structural analysis of neuronal growth cone veil motility. J Cell Sci. 2007;120:1113–1125. doi: 10.1242/jcs.03384. [DOI] [PubMed] [Google Scholar]
- Moriyama K, Yahara I. Two activities of cofilin, severing and accelerating directional depolymerization of actin filaments, are affected differentially by mutations around the actin-binding helix. EMBO J. 1999;18:6752–6761. doi: 10.1093/emboj/18.23.6752. [DOI] [PMC free article] [PubMed] [Google Scholar]
- Nemethova M, Auinger S, Small JV. Building the actin cytoskeleton: filopodia contribute to the construction of contractile bundles in the lamella. J Cell Biol. 2008;180:1233–1244. doi: 10.1083/jcb.200709134. [DOI] [PMC free article] [PubMed] [Google Scholar]
- Pak CW, Flynn KC, Bamburg JR. Actin-binding proteins take the reins in growth cones. Nat Rev Neurosci. 2008;9:136–147. doi: 10.1038/nrn2236. [DOI] [PubMed] [Google Scholar]
- Pasterkamp RJ, Ruitenberg MJ, Verhaagen J. Semaphorins and their receptors in olfactory axon guidance. Cell Mol Biol (Noisy-le-grand) 1999;45:763–779. [PubMed] [Google Scholar]
- Rochlin MW, Itoh K, Adelstein RS, Bridgman PC. Localization of myosin II A and B isoforms in cultured neurons. J Cell Sci. 1995;108(Pt 12):3661–3670. doi: 10.1242/jcs.108.12.3661. [DOI] [PubMed] [Google Scholar]
- Rodriguez OC, Schaefer AW, Mandato CA, Forscher P, Bement WM, Waterman-Storer CM. Conserved microtubule-actin interactions in cell movement and morphogenesis. Nat Cell Biol. 2003;5:599–609. doi: 10.1038/ncb0703-599. [DOI] [PubMed] [Google Scholar]
- Sasaki Y, Hayashi K, Shirao T, Ishikawa R, Kohama K. Inhibition by drebrin of the actin-bundling activity of brain fascin, a protein localized in filopodia of growth cones. J Neurochem. 1996;66:980–988. doi: 10.1046/j.1471-4159.1996.66030980.x. [DOI] [PubMed] [Google Scholar]
- Strasser GA, Rahim NA, VanderWaal KE, Gertler FB, Lanier LM. Arp2/3 is a negative regulator of growth cone translocation. Neuron. 2004;43:81–94. doi: 10.1016/j.neuron.2004.05.015. [DOI] [PubMed] [Google Scholar]
- Svitkina TM, Borisy GG. Arp2/3 complex and actin depolymerizing factor/cofilin in dendritic organization and treadmilling of actin filament array in lamellipodia. J Cell Biol. 1999;145:1009–1026. doi: 10.1083/jcb.145.5.1009. [DOI] [PMC free article] [PubMed] [Google Scholar]
- Takahashi A, Camacho P, Lechleiter JD, Herman B. Measurement of intracellular calcium. Physiol Rev. 1999;79:1089–1125. doi: 10.1152/physrev.1999.79.4.1089. [DOI] [PubMed] [Google Scholar]
- Terman JR, Mao T, Pasterkamp RJ, Yu HH, Kolodkin AL. MICALs, a family of conserved flavoprotein oxidoreductases, function in plexin-mediated axonal repulsion. Cell. 2002;109:887–900. doi: 10.1016/s0092-8674(02)00794-8. [DOI] [PubMed] [Google Scholar]
- Uruno T, Liu J, Zhang P, Fan Y, Egile C, Li R, Mueller SC, Zhan X. Activation of Arp2/3 complex-mediated actin polymerization by cortactin. Nat Cell Biol. 2001;3:259–266. doi: 10.1038/35060051. [DOI] [PubMed] [Google Scholar]
- Vignjevic D, Kojima S, Aratyn Y, Danciu O, Svitkina T, Borisy GG. Role of fascin in filopodial protrusion. J Cell Biol. 2006;174:863–875. doi: 10.1083/jcb.200603013. [DOI] [PMC free article] [PubMed] [Google Scholar]
- Wen Z, Zheng JQ. Directional guidance of nerve growth cones. Curr Opin Neurobiol. 2006;16:52–58. doi: 10.1016/j.conb.2005.12.005. [DOI] [PubMed] [Google Scholar]
- Wong JT, Wong ST, O'Connor TP. Ectopic semaphorin-1a functions as an attractive guidance cue for developing peripheral neurons. Nat Neurosci. 1999;2:798–803. doi: 10.1038/12168. [DOI] [PubMed] [Google Scholar]
- Woo S, Gomez TM. Rac1 and RhoA promote neurite outgrowth through formation and stabilization of growth cone point contacts. J Neurosci. 2006;26:1418–1428. doi: 10.1523/JNEUROSCI.4209-05.2006. [DOI] [PMC free article] [PubMed] [Google Scholar]
- Wylie SR, Chantler PD. Myosin IIA drives neurite retraction. Mol Biol Cell. 2003;14:4654–4666. doi: 10.1091/mbc.E03-03-0187. [DOI] [PMC free article] [PubMed] [Google Scholar]
- Yamamoto N, Tamada A, Murakami F. Wiring of the brain by a range of guidance cues. Prog Neurobiol. 2002;68:393–407. doi: 10.1016/s0301-0082(02)00129-6. [DOI] [PubMed] [Google Scholar]
- Yamashiro S, Yamakita Y, Ono S, Matsumura F. Fascin, an actin-bundling protein, induces membrane protrusions and increases cell motility of epithelial cells. Mol Biol Cell. 1998;9:993–1006. doi: 10.1091/mbc.9.5.993. [DOI] [PMC free article] [PubMed] [Google Scholar]
- Zhou FQ, Cohan CS. Growth cone collapse through coincident loss of actin bundles and leading edge actin without actin depolymerization. J Cell Biol. 2001;153:1071–1084. doi: 10.1083/jcb.153.5.1071. [DOI] [PMC free article] [PubMed] [Google Scholar]
Associated Data
This section collects any data citations, data availability statements, or supplementary materials included in this article.
Supplementary Materials
Supplemental Figure 1. Effect of saponin permeabilization prior to fixation on actin staining. Growth cones were either fixed, permeabilized (A–C) and then stained with rhodamine phalloidin (A) or an antibody to β-actin (B) or first permeabilized with saponin (5 min) (D–F), stained with rhodamine phalloidin (D), fixed and then stained with the antibody to β-actin (E). The staining shows overlap in both cases (C and F) and the peripheral staining is nearly identical indicating that f-actin is preserved. Bar=6 µm.
Supplemental Figure 2. Permeabilization with saponin prior to fixation and its effect on staining for actin binding proteins. Permeabilization (1 min) reduced staining for cortactin (A) even in cells that were not treated with Sema 3A. Treatment with Sema 3A (500 ng/ml, 30 min) caused further reduction in staining that was at background levels (B). Therefore a comparison of the ratios of specific staining was not possible. Staining for Arp-2 showed little change with permeabilization (5 min) (C). Upon treatment with Sema 3A (D), the staining ratio was significantly (*) reduced (P=0.0014). Permeabilization (1 min) also reduced the staining ratio for fascin (F). Treatment with Sema 3A (500 ng/ml, 30 min) caused a further significant (*) reduction (P=0.01). Bar=10 µm.
Supplemental Figure 3. Fascin and myosin IIA show variable overlap prior to Sema 3A treatment. After treatment staining redistributes and overlap increases only in the region of the neurite relatively far from the residual growth cone. (A) Control growth cones stained for fascin (green) and myosin IIA (red). Overlap in staining is more variable from growth cone to growth cone than for myosin IIB. (B) Sema 3A treated (500 ng/ml, 30 min) growth cones still show varying degrees of collapse. Fascin staining (arrow) is now predominately peripheral to the distribution of myosin IIA, but in some growth cones it can interdigitate (middle panel) or overlap in the neurite (right panel). Bar=10 µm.


