Abstract
Background and objectives: The erythropoietic response in hemodialysis patients depends on several physiologic factors. Most epidemiologic studies include the effect of these factors by representing them as confounders. This study tested the hypothesis that iron stores, inflammation, dialysis adequacy, nutritional status, and hyperparathyroidism act as nonlinear effect modifiers of the erythropoietic response and quantified the magnitude of those effects over clinically relevant ranges.
Design, setting, participants, & measurements: The following retrospective data from 209 hemodialysis patients receiving Epoetin alfa (Epo) were collected: monthly: predialysis hemoglobin (Hgb), transferrin saturation, serum albumin, dialysis adequacy (Kt/V); quarterly: predialysis serum ferritin and intact parathyroid hormone over a period of 13 to 69 months. The study analyzed the dynamic relationship between hemoglobin and Epo, considering nonlinear effect modification by ferritin, transferrin saturation, Kt/V, albumin, and parathyroid hormone individually.
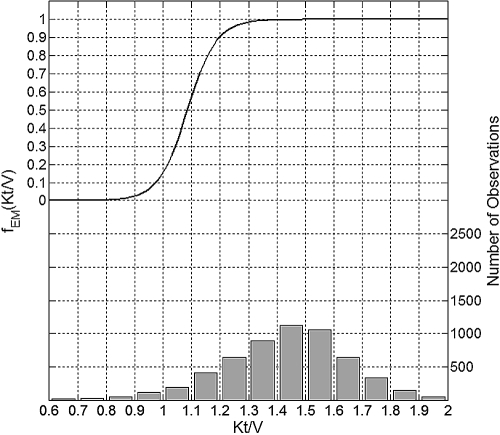
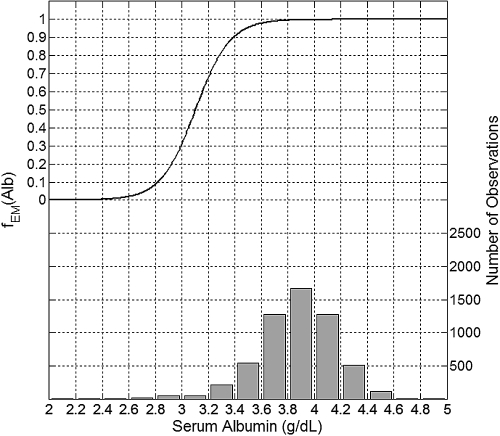
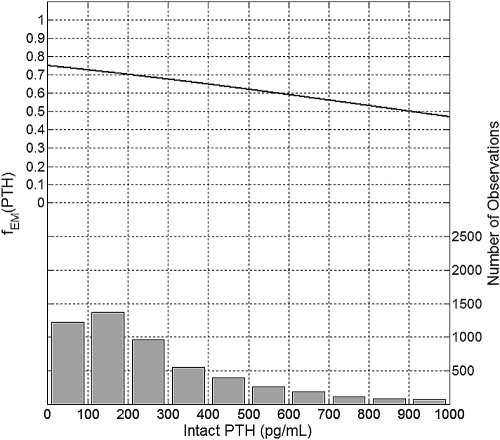
Results: Maximum Hgb response to Epo was achieved for serum ferritin between 350 and 500 ng/ml, transferrin saturation greater than 30%, Kt/V greater than 1.4, and albumin greater than 3.8 g/dl. Hgb sensitivity to Epo decreases by about 30% as parathyroid hormone increases from 0 through 1000 pg/ml.
Conclusions: Serum ferritin, transferrin saturation, Kt/V, serum albumin, and intact parathyroid hormone are markers of nonlinear effect modification of the erythropoietic response in hemodialysis patients.
Recent reports describe hemoglobin (Hgb) variability in the anemia of chronic kidney disease (1–4) as a risk factor for increased mortality. One retrospective study (2) associates increased mortality with persistently and transiently low Hgb levels. However, the Correction of Hemoglobin and Outcomes in Renal Insufficiency study and its secondary analysis (5,6) indicate that driving Hgb levels up by excessive dosing of erythropoiesis stimulating agents (ESA) may not be of benefit. Given these findings, it is important to understand what factors modify the Hgb sensitivity to ESA and to describe that relationship. Among these factors, iron stores are most thoroughly described (7–11). Other factors include inflammation (12,13), adequacy of dialysis (14,15), nutritional status (16), and hyperparathyroidism (17).
Typically, in epidemiologic studies, factors affecting a dose-response relationship are modeled as independent covariates, as in the case of multivariate regression. Such an approach treats these factors as confounders, assuming that their effect on the response is independent of the administered dose. Although these factors may indeed confound the relationship between Hgb and ESA, this confounding is likely due to the anemia management (confounding by medical indication) and does not necessarily represent the physiology of erythropoiesis.
We studied the sensitivity of Hgb to ESA in a novel way. We assumed that the factors that affect Hgb sensitivity to ESA do not act as confounders, but rather as effect modifiers. In dose-response models, confounding occurs when there is a factor that is associated with the dose and the response but does not lie on a physiologic pathway between them. Effect modification occurs when there is a factor that is associated with the response through an interaction with the dose; i.e., it physiologically changes the effect the dose has on the response. Using analysis of covariance with stratification, which is the traditional way of testing for effect modification, we have previously demonstrated that the effect of ESA dose may be modified by iron stores, nutritional status, and dialysis adequacy (18,19). On the basis of these preliminary results, we tested the hypothesis that markers of iron stores, nutritional status, hyperparathyroidism, and dialysis adequacy act as nonlinear effect modifiers of Hgb sensitivity to ESA. We used a novel mathematical approach developed on the basis of a dynamic regression model of the Hgb response to ESA dose that does not require the stratification step. We tested for effect modification by analyzing the behavior of the model coefficients as a function of the studied effect modifiers.
Materials and Methods
We performed a retrospective observational cohort study of all 209 patients receiving in-center hemodialysis at the Kidney Disease Program, University of Louisville, between January 1996 and December 2001. All patients were dialyzed three times weekly and received Epoetin alfa (Epo) intravenously. The data were right-censored if any of the following events occurred: death, discontinuation of hemodialysis, or transfer out of the unit. We recorded monthly Hgb levels, weekly Epo dose, monthly transferrin saturation (TSat), serum albumin (Alb), dialysis adequacy (Kt/V), as well as quarterly serum ferritin (Ferr) and intact parathyroid hormone (PTH) levels. We abstracted the data from an electronic medical record with approval from the Institutional Review Board at the University of Louisville. We eliminated outliers and erroneous entries by limiting the Epo dose to between 0 and 100,000 units per week, TSat level between 0 and 100%, Ferr level between 0 and 2000 ng/ml, serum Alb between 0 and 5 g/dl, Kt/V between 0 and 2.5, and intact PTH between 0 and 2000 pg/ml. We averaged Epo doses over the number of treatments per month. We obtained monthly Ferr and PTH values using the last observation carry forward method (20).
Statistical Analyses
To analyze the Hgb sensitivity to Epo with effect modification by Ferr, TSat, Kt/V, Alb, or PTH, we formulated the following regression model:
In this model, ΔHgb(k) is the Hgb change from last month to the current month, and ΔEpo(k − i) is the Epo dose adjustment from 2 months ago to last month, where i changes from 1 through N, and where N represents the number of past months of Epo dose adjustments that affect the current Hgb change.
The symbol βi represents the unknown regression coefficients that we determined from the data. These coefficients determine the Hgb sensitivity to Epo, or a change in Hgb for a 1000-unit change in Epo dose.
The symbol fEM() represents the effect modification function, and EM(k − i) is the effect modifier level at month −1, −2, −3, etc. We assume that the effect modifiers may limit the maximum amount of Hgb produced in response to Epo administration. Our preliminary study (18,19) showed a unidirectional effect modification by TSat, Kt/V, and Alb. The effect modification by PTH is also believed to be unidirectional (17,21,22). To represent this unidirectional effect modification, we used the following logistic curve:
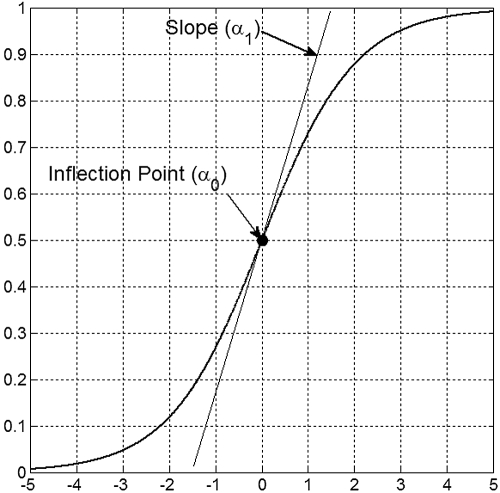
The coefficients α0 and α1 are called the inflection point and the slope and are displayed in Figure 1.
Figure 1.
Graphical depiction of the sigmoid (logistic) effect modification function and its parameters.
Effect modification by Ferr might be bidirectional, as we have previously shown (19). We used a bell-shaped curve obtained as a product of two logistic curves (2) to represent this function.
In this equation, α0l and α1l are the inflection point and the slope of the left shoulder, and α0r and α1r are the inflection point and the slope of the right shoulder.
The symbol ε in Equation 1 represents normally distributed random error with mean zero and variance corresponding to model uncertainty. We used a standard nonlinear mixed-effect approach to estimate model parameters in Equations 1, 2, and 3. For each of the studied effect modifiers, we estimated models using data from −1 to −4 months and selected the best model using a likelihood ratio test (23). We used the first-order conditional estimation method with unstructured covariance matrix for random effects. We performed all computations using MATLAB® Release 2008b (The Mathworks, Natick, MA).
Results
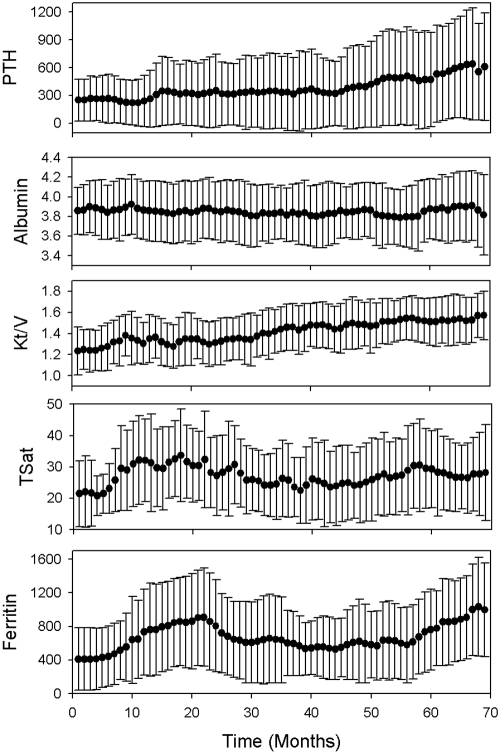
The baseline characteristics of the study population are shown in Table 1. Figure 2 shows population means and SD over time for all of the analyzed effect modifiers. After removing data vectors containing missing values, outliers, or erroneous values, 5738 data vectors were available for estimating the model (Equations 1, 2, and 3).
Table 1.
Baseline data characteristics
| Age, yr, median/IQR/min/max | 58/23/15/92 |
| Gender, n, M/F | 116/93 |
| Race, n, white/black/other | 49/158/2 |
| Length of treatment, mo, median/IQR/min/max | 131/143/22/277 |
| Hgb, g/dl, mean ± SD | 11.7 ± 1.6 |
| Epo dose 1000 U/wk, median/IQR/min/max | 9/18/0/90 |
| Ferr, ng/ml, median/IQR/min/max | 612/582/2/2000 |
| TSat, %, mean ± SD | 27.2 ± 13.4 |
| Kt/V, mean ± SD | 1.43 ± 0.25 |
| Alb, g/dl, mean ± SD | 3.8 ± 0.3 |
| Intact PTH, pg/ml, median/IQR/min/max | 240/368/5/2000 |
| Missing data proportion, % | |
| Hgb | 1.9 |
| Ferr | 7.9 |
| TSat | 4.4 |
| Kt/V | 7.1 |
| Alb | 2.3 |
| PTH | 9.3 |
| Number of repeated measures, median/IQR/min/max | |
| Hgb | 48/49/8/2 |
| Ferr | 9/11/2/23 |
| TSat | 29/33/4/67 |
| Kt/V | 30/33/4/73 |
| Alb | 31/34/5/67 |
| PTH | 9/10/1/25 |
IQR, interquartile range.
Figure 2.
Time plots of the mean values and SD for the analyzed effect modifiers.
Statistically, the best model incorporates 3 months of historical data. Table 2 shows the estimated model parameters with their corresponding P values, as well as the values of −2 log likelihood function and the mean squared error. The mean squared error can be regarded as the variance of the model error term ε.
Table 2.
Means and (in parentheses) P values of the estimated model parameters for the analyzed effect modifiers
| Ferr | TSat | Kt/V | Alb | PTH | |
|---|---|---|---|---|---|
| α0l | 164 (0.002) | 13 (0.001) | 1.1 (0.001) | 3.1 (0.001) | |
| α1l | 0.02 (0.011) | 0.4 (0.001) | 19.7 (0.001) | 7.7 (0.006) | |
| α0r | 1655 (0.017) | 1344 (0.001) | |||
| α1r | −0.003 (0.001) | −0.0013 (0.002) | |||
| β1 | 0.41 (0.001) | 0.32 (0.001) | 0.29 (0.001) | 0.32 (0.001) | 0.33 (0.001) |
| β2 | 0.17 (0.001) | 0.13 (0.001) | 0.13 (0.001) | 0.13 (0.001) | 0.15 (0.001) |
| β3 | 0.13 (0.001) | 0.10 (0.001) | 0.09 (0.001) | 0.10 (0.001) | 0.11 (0.001) |
| −2 log likelihood | 15873 | 15464 | 15549 | 15498 | 15710 |
| Mean squared error | 0.69 | 0.70 | 0.70 | 0.70 | 0.69 |
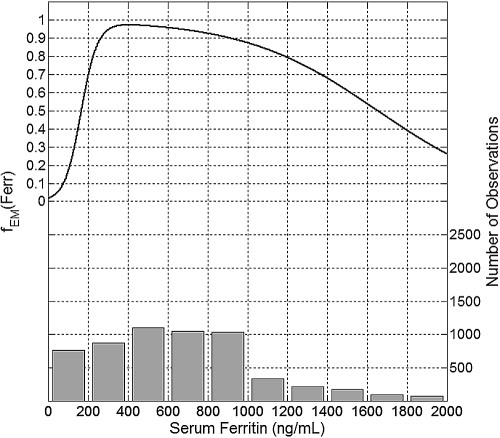
Figures 3 through 7 show a plot of the effect modification function fEM (left axis) for each of the studied effect modifiers and the corresponding data histogram (right axis). The maximum response to Epo is associated with Ferr between 350 and 500 ng/ml (Figure 3). Ferr below 350 ng/ml is associated with a drastic decrease of the erythropoietic response, about 30% at Ferr of 200 ng/ml and as much as 80% at Ferr of 100 ng/ml. Ferr above 500 ng/ml is associated with a gradually decreasing erythropoietic response, by about 5% when Ferr is equal to 800 ng/ml and 20% for Ferr equal to 1200 ng/ml.
Figure 3.
Plot of the mean effect modification by Ferr (top, left y-axis) and the histogram of data distribution (bottom, right y-axis).
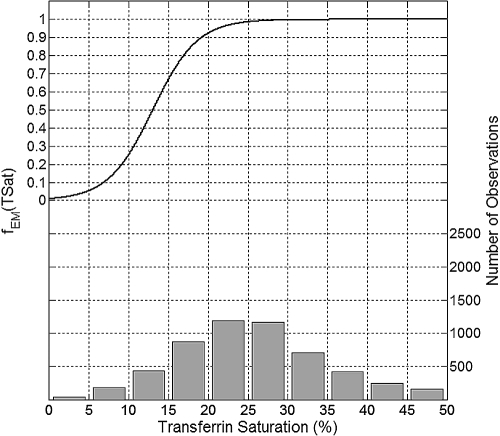
The maximum erythropoietic response was associated with TSat levels greater than 30% (Figure 4). TSat levels of 20% and 10% are associated with erythropoietic response decreases by approximately 8% and 75%, respectively.
Figure 4.
Plot of the mean effect modification by TSat (top, left y-axis) and the histogram of data distribution (bottom, right y-axis).
The maximum erythropoietic response associated with Kt/V occurred when Kt/V was 1.4 or greater (Figure 5). Kt/V values of 1.2 and 1.0 were associated with about 10% and as much as 85% decrease in the erythropoietic response, respectively.
Figure 5.
Plot of the mean effect modification by Kt/V (top, left y-axis) and the histogram of data distribution (bottom, right y-axis).
The maximum erythropoietic response was associated with Alb greater than 3.8 g/dl (Figure 6). Alb levels of 3.4 and 3.0 g/dl were associated with a decrease of erythropoietic response by about 10% and 70%, respectively.
Figure 6.
Plot of the mean effect modification by Alb (top, left y-axis) and the histogram of data distribution (bottom, right y-axis).
Intact PTH levels between 0 and 100 pg/ml were associated with the maximum erythropoietic response (Figure 7). PTH levels of 300, 600, and 900 pg/ml were associated with about 90%, 79%, and 67% of the maximum erythropoietic response, respectively.
Figure 7.
Plot of the mean effect modification by intact PTH (top, left y-axis) and the histogram of data distribution (bottom, right y-axis).
Discussion
We proposed a bivariate, nonlinear model of Hgb response to Epo dose that aims to explore how various physiologic markers may be associated with the modification of the dose-response relationship between Epo and Hgb. As potential effect modifiers, we selected the most common physiologic markers routinely measured as a part of monthly or quarterly laboratory collections in hemodialysis patients. We made a physiologically plausible assumption that iron stores, nutritional-inflammatory status, dialysis adequacy, and bone metabolism disorders may have a moderating effect on erythropoiesis. Unlike traditional methods for studying univariate effect modification, which require that the analyzed effect modifier be stratified by the user into clinically relevant intervals, our method automatically determines the shape of the effect modification curve without any user input.
According to Baron and Kenny (24), a moderator is a variable that determines under what conditions the dose (Epo) produces the response (Hgb). We hypothesized that the amount of Hgb produced after Epo administration may be limited by physiologic phenomena represented by the markers we selected. Furthermore, we hypothesized that this limiting activity might be nonlinear.
Physiologically, erythropoiesis involves a close interaction of Epo and iron. Serum Ferr and TSat have been used as the two primary markers of iron available for erythropoiesis. However, many studies have failed to show the effect that these markers have on the erythropoietic response (7,16,25–27). Our analysis indicates that both markers are associated with the moderation of the erythropoietic response. Our findings are consistent with those reported by Kalantar-Zadeh et al. (21) and confirm that iron deficiency indicated by low levels of TSat or Ferr is associated with an impaired erythropoietic response. Our analysis shows that the impaired erythropoietic response is also present when Ferr is elevated (>500 ng/ml). The physiologic mechanism through which the erythropoietic response is compromised at high ferritin levels could be explained by the malnutrition-inflammation complex syndrome inhibiting the erythropoiesis (28).
A link between the dialysis adequacy and the erythropoietic response has been established before (14,15,29). Our results confirm the finding by Movilli et al. (29), who established a negative correlation between the total Epo dose and Kt/V when Kt/V is below 1.33 and no correlation when it is above 1.33. The physiology behind the effect modification represented by this marker is not yet fully understood. It could be explained by a number of phenomena, including inflammation or vascular access complications.
Alb has been positively correlated with the erythropoietic response (12,16). We show that severe hypoalbuminemia is associated with a significant impairment of the erythropoietic response. Similarly to high ferritin, the mechanism behind this effect modification can be attributed to the malnutrition-inflammation complex syndrome.
A detrimental effect of hyperparathyroidism on the Hgb response to Epo has also been reported (17,22). Our study shows that increased PTH level is associated with a decreased erythropoietic response. However, in our study this effect is not as pronounced as that of the other markers. The potential physiologic mechanisms that may affect the erythropoiesis and could be represented by this marker include bone marrow fibrosis and the hormonal effects on erythroid precursors.
There are some limitations to the work presented. Because of the retrospective nature of the study, our results should be interpreted as associative rather than causative. Furthermore, some factors that may be of interest either were not collected or were not measured in this population of patients at the time of their treatment. For instance, it has been reported that hospitalizations are associated with a decrease of Hgb level (30). Because we did not measure hospitalization rate, we cannot determine its effect on our data, and therefore the resulting error term of the model may be increased. One way to address this shortcoming could be through a carefully designed prospective cohort study with an a priori statistical model. The results we present can be used to guide such a prospective study.
Conclusions
We individually analyzed five markers of physiologic phenomena that are known to be associated with changes in erythropoietic response, collected as part of the routine laboratory measurements in ESRD patients. The techniques we propose can be used to analyze the effect modification by other physiologic markers with known associations to erythropoietic response. The method can also be extended to analyze the joint effect modification of the erythropoietic response by all of the markers considered at the same time.
Disclosures
M.E.B. is a consultant to Fresenius and Hospira. G.R.A. is a consultant to AMAG, Amgen, Fresenius, and Merck.
Acknowledgments
A.E.G. is supported by the National Institutes of Health grant K25 DK072085. M.E.B. is supported by a grant from the Department of Veterans' Affairs. The authors are indebted to the anonymous reviewers for their insightful comments.
Footnotes
Published online ahead of print. Publication date available at www.cjasn.org.
Access to UpToDate on-line is available for additional clinical information at http://www.cjasn.org/
References
- 1.Kalantar-Zadeh K, Aronoff GR: Hemoglobin variability in anemia of chronic kidney disease. J Am Soc Nephrol 20: 479–487, 2009 [DOI] [PubMed] [Google Scholar]
- 2.Gilbertson DT, Ebben JP, Foley RN, Weinhandl ED, Bradbury BD, Collins AJ: Hemoglobin level variability: Associations with mortality. Clin J Am Soc Nephrol 3: 133–138, 2008 [DOI] [PMC free article] [PubMed] [Google Scholar]
- 3.Brunelli SM, Lynch KE, Ankers ED, Joffe MM, Yang W, Thadhani RI, Feldman HI: Association of hemoglobin variability and mortality among contemporary incident hemodialysis patients. Clin J Am Soc Nephrol 3: 1733–1740, 2008 [DOI] [PMC free article] [PubMed] [Google Scholar]
- 4.Yang W, Israni RK, Brunelli SM, Joffe MM, Fishbane S, Feldman HI: Hemoglobin variability and mortality in ESRD. J Am Soc Nephrol 18: 3164–3170, 2007 [DOI] [PubMed] [Google Scholar]
- 5.Szczech LA, Barnhart HX, Inrig JK, Reddan DN, Sapp S, Califf RM, Patel UD, Singh AK: Secondary analysis of the CHOIR trial epoetin-alpha dose and achieved hemoglobin outcomes. Kidney Int 74: 791–798, 2008 [DOI] [PMC free article] [PubMed] [Google Scholar]
- 6.Singh AK, Szczech L, Tang KL, Barnhart H, Sapp S, Wolfson M, Reddan D: Correction of anemia with epoetin alfa in chronic kidney disease. N Engl J Med 355: 2085–2098, 2006 [DOI] [PubMed] [Google Scholar]
- 7.Coyne DW, Kapoian T, Suki W, Singh AK, Moran JE, Dahl NV, Rizkala AR: Ferric gluconate is highly efficacious in anemic hemodialysis patients with high serum ferritin and low transferrin saturation: Results of the Dialysis Patients' Response to IV Iron with Elevated Ferritin (DRIVE) Study. J Am Soc Nephrol 18: 975–984, 2007 [DOI] [PubMed] [Google Scholar]
- 8.Coyne D: Challenging the boundaries of anemia management: A balanced approach to i.v. iron and EPO therapy. Kidney Int Suppl (101): S1–S3, 2006 [DOI] [PubMed] [Google Scholar]
- 9.Besarab A: Resolving the paradigm crisis in intravenous iron and erythropoietin management. Kidney Int Suppl (101): S13–S8, 2006 [DOI] [PubMed] [Google Scholar]
- 10.Besarab A, Dalton CL: Maintaining higher TSATs and other iron indices is beneficial in management of anemic hemodialysis patients. Nephrol Nurs J 28: 429–434, 2001 [PubMed] [Google Scholar]
- 11.Besarab A, Amin N, Ahsan M, Vogel SE, Zazuwa G, Frinak S, Zazra JJ, Anandan JV, Gupta A: Optimization of epoetin therapy with intravenous iron therapy in hemodialysis patients. J Am Soc Nephrol 11: 530–538, 2000 [DOI] [PubMed] [Google Scholar]
- 12.Locatelli F, Andrulli S, Memoli B, Maffei C, Del Vecchio L, Aterini S, De Simone W, Mandalari A, Brunori G, Amato M, Cianciaruso B, Zoccali C: Nutritional-inflammation status and resistance to erythropoietin therapy in haemodialysis patients. Nephrol Dial Transplant 21: 991–998, 2006 [DOI] [PubMed] [Google Scholar]
- 13.Del Vecchio L, Pozzoni P, Andrulli S, Locatelli F: Inflammation and resistance to treatment with recombinant human erythropoietin. J Ren Nutr 15: 137–141, 2005 [DOI] [PubMed] [Google Scholar]
- 14.Locatelli F, Del Vecchio L, Pozzoni P, Andrulli S: Dialysis adequacy and response to erythropoiesis-stimulating agents: What is the evidence base? Semin Nephrol 26: 269–274, 2006 [DOI] [PubMed] [Google Scholar]
- 15.Movilli E, Cancarini GC, Zani R, Camerini C, Sandrini M, Maiorca R: Adequacy of dialysis reduces the doses of recombinant erythropoietin independently from the use of biocompatible membranes in haemodialysis patients. Nephrol Dial Transplant 16: 111–114, 2001 [DOI] [PubMed] [Google Scholar]
- 16.Agarwal R, Davis JL, Smith L: Serum albumin is strongly associated with erythropoietin sensitivity in hemodialysis patients. Clin J Am Soc Nephrol 3: 98–104, 2008 [DOI] [PMC free article] [PubMed] [Google Scholar]
- 17.Drueke TB, Eckardt KU: Role of secondary hyperparathyroidism in erythropoietin resistance of chronic renal failure patients. Nephrol Dial Transplant 17 [Suppl 5]: 28–31, 2002 [DOI] [PubMed] [Google Scholar]
- 18.Gaweda AE, Brier ME, Jacobs AA, Aronoff GR: Nutritional status and dialysis adequacy predict hemoglobin response to erythropoietin. J Am Soc Nephrol 19: 272A, 2008 [Google Scholar]
- 19.Gaweda AE, Brier ME, Jacobs AA, Aronoff GR: Measures of iron stores predict sensitivity to EPO. J Am Soc Nephrol 19: 708A, 2008 [Google Scholar]
- 20.Shao J, Zhong B: Last observation carry-forward and last observation analysis. Stat Med 22: 2429–2441, 2003 [DOI] [PubMed] [Google Scholar]
- 21.Kalantar-Zadeh K, Lee GH, Miller JE, Streja E, Jing J, Robertson JA, Kovesdy CP: Predictors of hyporesponsiveness to erythropoiesis-stimulating agents in hemodialysis patients. Am J Kidney Dis 53: 823–834, 2009 [DOI] [PMC free article] [PubMed] [Google Scholar]
- 22.Tutal E, Sezer S, Afsar B, Arat Z, Ozdemir FN, Haberal M: Additional effect of hyperparathyroidism on inflammatory status and rHuEPO requirements in hemodialysis patients. Transplant Proc 38: 2807–2812, 2006 [DOI] [PubMed] [Google Scholar]
- 23.Pinheiro JC, Bates DM: Mixed-Effects Models in S and S-PLUS, New York, Springer, 2000 [Google Scholar]
- 24.Baron RM, Kenny DA: The moderator-mediator variable distinction in social psychological research: Conceptual, strategic, and statistical considerations. J Pers Soc Psychol 51: 1173–1182, 1986 [DOI] [PubMed] [Google Scholar]
- 25.Fishbane S, Galgano C, Langley RC, Jr., Canfield W, Maesaka JK: Reticulocyte hemoglobin content in the evaluation of iron status of hemodialysis patients. Kidney Int 52: 217–222, 1997 [DOI] [PubMed] [Google Scholar]
- 26.Singh AK, Coyne DW, Shapiro W, Rizkala AR: Predictors of the response to treatment in anemic hemodialysis patients with high serum ferritin and low transferrin saturation. Kidney Int 71: 1163–1171, 2007 [DOI] [PubMed] [Google Scholar]
- 27.Tessitore N, Solero GP, Lippi G, Bassi A, Faccini GB, Bedogna V, Gammaro L, Brocco G, Restivo G, Bernich P, Lupo A, Maschio G: The role of iron status markers in predicting response to intravenous iron in haemodialysis patients on maintenance erythropoietin. Nephrol Dial Transplant 16: 1416–1423, 2001 [DOI] [PubMed] [Google Scholar]
- 28.Kalantar-Zadeh K, Rodriguez RA, Humphreys MH: Association between serum ferritin and measures of inflammation, nutrition and iron in haemodialysis patients. Nephrol Dial Transplant 19: 141–149, 2004 [DOI] [PubMed] [Google Scholar]
- 29.Movilli E, Cancarini GC, Vizzardi V, Camerini C, Brunori G, Cassamali S, Maiorca R: Epoetin requirement does not depend on dialysis dose when Kt/N > 1.33 in patients on regular dialysis treatment with cellulosic membranes and adequate iron stores. J Nephrol 16: 546–551, 2003 [PubMed] [Google Scholar]
- 30.Yaqub MS, Leiser J, Molitoris BA: Erythropoietin requirements increase following hospitalization in end-stage renal disease patients. Am J Nephrol 21: 390–396, 2001 [DOI] [PubMed] [Google Scholar]


