Abstract
A volume-displacement counterpulsation device (CPD) intended for chronic implantation via a superficial surgical approach is proposed. The CPD is a pneumatically driven sac that fills during native heart systole and empties during diastole through a single, valveless cannula anastomosed to the subclavian artery. Computer simulation was performed to predict and compare the physiological responses of the CPD to the intraaortic balloon pump (IABP) in a clinically relevant model of early stage heart failure. The effect of device stroke volume (0–50 ml) and control modes (timing, duration, morphology) on landmark hemodynamic parameters and the LV pressure–volume relationship were investigated. Simulation results predicted that the CPD would provide hemodynamic benefits comparable to an IABP as evidenced by up to 25% augmentation of peak diastolic aortic pressure, which increases diastolic coronary perfusion by up to 34%. The CPD may also provide up to 34% reduction in LV end-diastolic pressure and 12% reduction in peak systolic aortic pressure, lowering LV workload by up to 26% and increasing cardiac output by up to 10%. This study demonstrated that the superficial CPD technique may be used acutely to achieve similar improvements in hemodynamic function as the IABP in early stage heart failure patients.
Over the past four decades, counterpulsation with an intraaortic balloon pump (IABP) has been widely and successfully used for the short-term treatment of cardiac dysfunction.1,2 Approximately 160,000 patients receive this treatment annually worldwide with 43% to 65% successful clinical outcomes.3 Counterpulsation has many important clinical benefits for the heart (lower ventricular workload and increased myocardial perfusion) and the peripheral circulation (increased end-organ perfusion), which may make chronic counterpulsation a very effective treatment for patients with moderate myocardial dysfunction.3 However, the location of an IABP catheter (descending thoracic aorta) and biocompatibility issues limit the application of IABP to short durations (typically <14 days). When IABP support was attempted for a prolonged period (>20 days), the frequency of vascular complications, infections, and bleeding were significantly higher.4,5 Furthermore, in its current form, a balloon device mounted on a catheter is advanced from a groin artery into the descending aorta, requiring a patient to remain supine for the duration of therapy, which virtually immobilizes the patient. Consequently, the number of patients who could benefit from the IABP as an extended therapy for myocardial support and possible myocardial recovery is limited.
Devices like the permanent implantable IABP,6 dynamic aortic patch,7 valveless counterpulsation device,8 and the artificial vasculature device9 have been developed to provide chronic counterpulsation therapy. However, each of these devices requires major open heart surgery for implantation. To overcome these limitations, we are currently developing a volume displacement counterpulsation device (CPD) for long-term application to treat early stage heart failure patients that can be implanted using a superficial surgical approach. In this article, we present the predicted hemodynamic and left ventricular (LV) pressure–volume responses to CPD and IABP support during simulated clinically relevant early stage heart failure test conditions over a range of device stroke volumes (0–50 ml) and control modes (timing, duration, morphology) using a computer model of the human cardiovascular system. Based on these findings, a 40-ml prototype CPD was then tested in a mock circulation system to validate the predicted computer simulation results. This article compares the acute hemodynamic benefits of the CPD device with those of the IABP.
Materials and Methods
Counterpulsation Device Concept
The objective of any counterpulsation technique is to use a mechanical device to generate a pressure pulse during native heart diastole to augment myocardial perfusion and reduce aortic pressure during native heart systole reducing ventricular workload and vascular after load. For example, an IABP catheter positioned in the aorta inflates a balloon with bursts of shuttle gas during native heart diastole pushing blood toward the heart and end organs. It deflates the balloon during native heart systole reducing the aortic pressure. The CPD was designed to provide similar hemodynamic benefits to those achieved by IABP, but uses a volume displacement technique designed for long-term application of counterpulsation therapy. A superficial surgical procedure using a “pacemaker pocket” approach to implant the CPD has been developed. The CPD is controlled to fill with blood volume during native heart systole (deflation) and eject blood during native heart diastole (inflation) through a single valveless cannula anastomosed to the subclavian artery (Figure 1).
Figure 1.
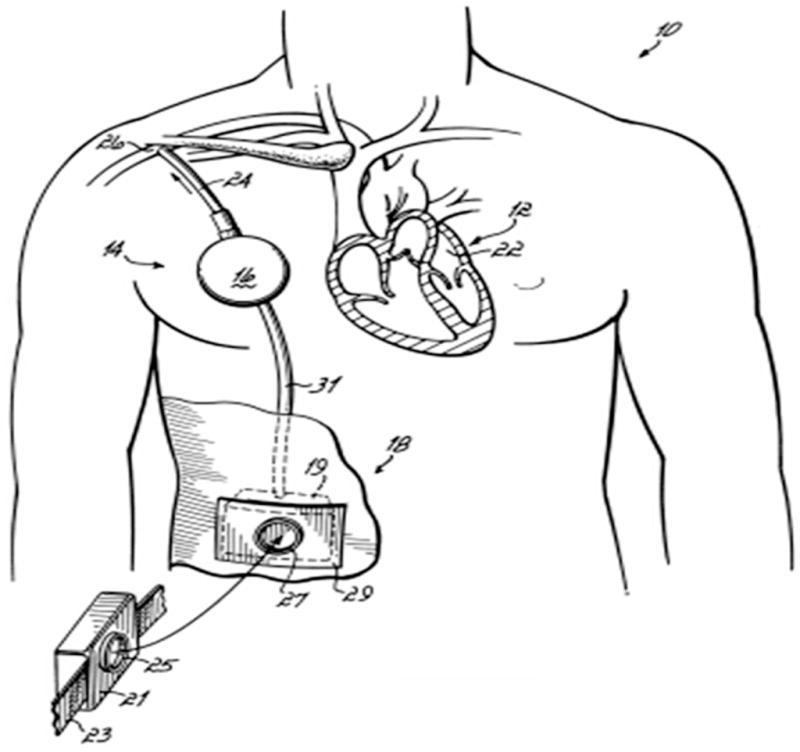
Anatomical illustration of the placement of the clinical counterpulsation device (CPD). This drawing demonstrates a final generation completely enclosed battery-powered system attached to the subclavian artery.
Experimental Design
Dynamic computer models of a CPD and IABP were developed and incorporated into a computer model10 of the cardiovascular system (Figure 2). Ventricular failure was simulated with a native heart rate of 92 bpm. Computer simulations were conducted to predict hemodynamic responses and ventricular pressure–volume loops over a wide range of device flow rates (0–50 ml/beat), device filling and ejection morphologies (linear, sinusoidal), device filling and ejection timings and duration (25%, 50%, 75%, and 100% of systolic and diastolic time), and support modes (1:1, 1:2). Three different timing algorithms were simulated for the CPD device: (1) early filling late ejection (CPDEFLE) algorithm—the CPD filling is initiated just before the end of LV diastole and the CPD ejection is initiated just after the isovolumetric relaxation phase of the native left ventricle; (2) late filling early ejection (CPDLFEE) algorithm—the CPD filling is initiated just before the opening of the aortic valve and the CPD ejection is initiated at the dicrotic notch; and (3) early filling early ejection IABP (CPDI-ABP) algorithm—the CPD filling is initiated at the end of ventricular diastole such that 50% of the filling is completed at the opening of the aortic valve2 and the CPD ejection is initiated at the dicrotic notch. The IABP was simulated with the late filling early ejection (IABPLFEE) and the early filling early ejection (IABP) algorithms.
Figure 2.
Illustration of the computer simulation model of the human circulatory system for comparing clinical counterpulsation device (CPD) to the intraaortic balloon pump (IABP).
The timing sequence of the IABP inflation/deflation and CPD filling/ejection are referenced to the aortic root and does not account for the time delay due to the distance between the device and the aortic root, and the pulse wave velocity. To implement the timing algorithms, the CPD and IABP have to be inflated and deflated earlier to compensate for the time delay. In this simulation study, the CPD device filling and ejection were initiated 28 milliseconds earlier. The simulation was initiated with limit cycle (steady state) values of a failing heart and circulatory system volumes, pressures and flow rates. At time t = 0, the device was turned on. The modeled circulatory system reached a limit cycle within 100 cardiac cycles. The simulation was continued for 400 cardiac cycles. The mean values of pressures, flows and volumes were reported only for the last 50 beats. The computer model was assumed to have no process noise, and the deviation in steady state value was less than 1 mm Hg for pressures, 0.05 l/min for flow rates, and 2 ml for ventricular volume.
A 40-ml CPD was tested in a mock circulation system to validate the findings predicted by the computer simulation model. The mock circulation system (Figure 3) was tuned to produce cardiovascular pressures, flows, and volumes comparable to values reported clinically for normal, moderate, and severe ventricular function (Table 1). The CPD was cannulated to the subclavian artery. Hemodynamic waveforms were recorded for (1) baseline normal, (2) baseline failures (moderate and severe), and (3) failures (moderate and severe) with 10-ml to 40-ml CPD volume displacements in 1:1 and 1:2 support modes.
Figure 3.
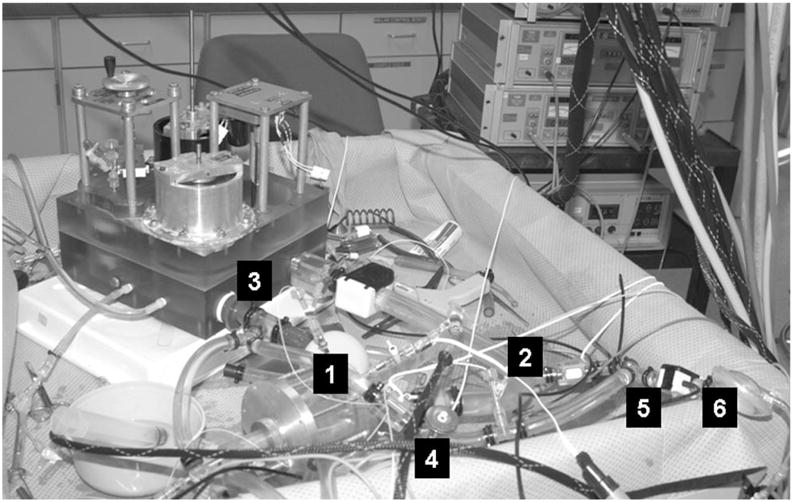
Photograph of the mock circulatory system used for testing the CPD. The mock circulatory system consists of the (1) left ventricle, (2) aorta, (3) systemic resistance and compliance chambers, (4) coronary artery, (5) subclavian artery, and (6) counterpulsation device (CPD). In a previous study (Pantalos, 200414), the adult mock circulation was shown to mimic physiological responses as defined by characterizing hemodynamic parameters, ventricular pressure–volume relationship, aortic input impedance, and vascular mechanical properties for normal, failing, and recovering human ventricle.
Table 1.
Baseline Values of Aortic Pressure (AoP), Cardiac Output (CO), Left Ventricular End-Diastolic Pressure (LVPed), and Heart Rate (HR) for Normal, Failing, and Moderately Failing Left Ventricle
| Parameter | Normal | Failure | Moderate Failure |
|---|---|---|---|
| AoP (mm Hg) | 95 | 65 | 80 |
| CO (l/min) | 5 | 3.8 | 4.4 |
| LVPed (mm Hg) | 2–5 | 15–25 | 12–20 |
| HR (bpm) | 72 | 92 | 92 |
Computer Simulation Model
A detailed description of the computer simulation model of the human cardiovascular system used in this study has been previously provided10 and used to develop and test physiologic control algorithms for VADs.9–13 Briefly, the human circulatory model subdivides the human circulatory system into an arbitrary number of lumped parameter blocks, each characterized by its own resistance, compliance, pressure, and volume of blood. Two idealized elements, resistance and storage, were used to characterize each block. The storage element provides zero resistance to the flow, while the resistive element has zero volume. In its simplest configuration, the model has eleven elements: four heart valves and seven blocks including left heart, right heart, pulmonary and systemic circulation, vena cava, and aorta. A left main coronary circulation and subclavian artery blocks were added to the model to predict the coronary flow to the left ventricle and the subclavian artery flow (Figure 2). The model of the CPD is given by Vp = a − b, where Vp is the volume of blood in the CPD, a is the flow rate into the pump during device filling, and b is the flow rate out of the pump during device ejection. The value of a and b is given by the desired stroke volume, time of filling and ejection, and the volumetric profile of the CPD. The value of b is zero during pump systole and the value of a is zero during pump diastole. The model of the IABP is similar to that of the CPD, except that the values a and b denote the flow rates of air into and out of the IABP. The integration of the circulatory system with the CPD and IABP is straightforward and only affects equations for the subclavian and aorta blocks, respectively.
Mock Circulatory System
The adult mock circulation consists of atrium, ventricle, and systemic and coronary vasculature components as illustrated in Figure 3. In a previous study,14 the adult mock circulation was shown to mimic human normal ventricle, failing ventricle, and partial cardiac recovery physiological responses as defined by characterizing hemodynamic parameters, ventricular pressure–volume relationship, aortic input impedance, and vascular mechanical properties. An artificial atrium,15 made of a flexible polymer sphere 50 mm in diameter, is connected upstream of the inflow valve of a mock ventricle. The mock ventricle consists of a flexing, polymer sac inside a pressurization chamber.16 The ventricular sac is hemi-ellipsoid shaped and is 70 mm wide at the base and 83 mm long from base to apex. The base is covered by a semirigid polymer dome 20 mm high, with mounts for inflow (mitral) and outflow (aortic) prosthetic valves. Metered pulses of compressed air (Cardio-West Utah Drive, Tucson, AZ) are delivered to the pressurization chamber during systole, compressing the ventricular sac to form coapting quadrants simulating contraction of the normal and dysfunctional ventricle and the delivery of cardiac stroke volume. An artificial aorta (PVC tube segment, 25 mm diameter) is connected downstream of the outflow valve of the ventricular sac to the mock systemic vasculature. A branch vessel off of the arch region of the aorta represented the subclavian to which the monoport from the 40 cc CPD device was connected end-to-side. The CPD device was operated by an IABP console (System 97, Datascope, Fairfield, NJ) using pressure trigger mode with various combinations of synchronization and augmentation levels. The mock systemic vasculature consists of four integrated chambers that represent lumped proximal resistance, systemic compliance, peripheral resistance, and venous compliance.14
Instrumentation
A high-fidelity pressure–volume conductance catheter (Millar Instruments Inc.) was inserted into an aortic introducer port and passed retrograde through the aortic valve and down to the ventricular apex for simultaneous ventricular pressure, root aortic pressure, and ventricular volume measurements. Single-tip high-fidelity catheters (Millar Instruments Inc.) were inserted into introducer ports for measuring atrial pressure, distal aortic pressure, subclavian root, subclavian distal, and driveline pressures. Aortic root, aortic distal, subclavian root, subclavian distal, and CPD flows were measured with inline transit-time flow probes (Transonics, Ithaca, NY). Pressure, flow, and volume transducers were precalibrated and postcalibrated, and transducer gains and offsets calculated and applied to ensure measurement accuracy. Gains were calculated for the LV volume data to match the stroke volume of the LV, as sensed by the aortic root flow probe. Offsets for the LV volume data were calculated taking into consideration the total flow and LV end-diastolic pressure (LVPed) data. Placement of instrumentation for hemodynamic measurements of pressures, flows, and volume is shown in Figure 3. Signal conditioning was accomplished using transducer amplifiers (Ectron, San Diego, CA), transit-time flow meters (Transonics), a volume conductance unit (Leycom, Sigma V, Netherlands), and other peripheral conditioners integrated in an instrumentation system compliant with Good Laboratory Practice guidelines.17 Signal-conditioned data were low-pass filtered at 60 Hz, analog-to-digitally converted (AT-MIO-16E-10 and LabVIEW, National Instruments) at a sampling rate of 400 Hz, and stored on a personal computer for postprocessing and analysis.18
Data Analysis
Differences in characterizing hemodynamic parameter values and ventricular pressure–volume loop responses were calculated using a Hemodynamic Evaluation and Assessment Research Tool (HEART) program19 and supporting m-files developed in Matlab (MathWorks, Natick, MA). Pressure, flow, and volume waveforms were used to calculate the following hemodynamic parameters: cardiac output; aortic systolic, diastolic, and mean pressures; LV systolic, end-diastolic and peak pressures; LV external work; and aortic, subclavian artery, coronary artery, and CPD flows. All hemodynamic parameters were calculated on a beat-to-beat basis, with all limit cycle beats in each data set averaged to obtain a single representative mean value for each parameter. Pressure–volume loops were constructed by plotting ventricular pressure against ventricular volume, in which each loop represents one complete cardiac cycle (one beat). Characterizing hemodynamic parameters and pressure–volume loops were calculated for all experimental conditions.
Results
Effect of Device Timing
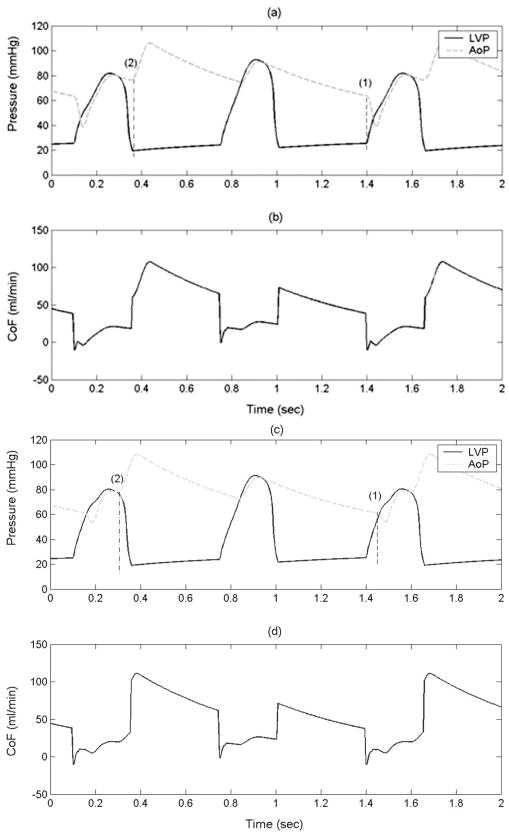
The mean LV ejection pressure is reduced considerably if the CPD filling is initiated just before LV systole such that the device is almost fully filled before the opening of the aortic valve (early filling late ejection algorithm Figures 4a and 4b) device filling timing is marked as (1) and the device ejection timing is marked as (2) compared with when the device filling is initiated just before the opening of the aortic valve (late filling early ejection algorithm, Figures 4c and 4d). The reduction in mean ejection LVP translates directly into reduced LV external work (LVEW) (Figure 5). A modest increase in mean diastolic coronary flow (1–2%) was observed (Figure 6b) when the device ejection was delayed until the completion of isovolumetric relaxation (Figures 4a and 4b) compared with when the device ejection was initiated immediately after the aortic valve closure (Figures 4c and 4d). The reduction in mean ejection LVP and LVEW (Figure 5), and increases in the CoF is higher with the CPD operating with the early filling late ejection algorithm depicted in Figures 4a and 4b, in comparison with the IABP operating at the early filling early ejection algorithm described in literature.2 The CPD device with early filling late ejection algorithm reduces the LVEW considerably with minimal tradeoff on cardiac output increase (< 0.1 L/min) in comparison to the IABP.
Figure 4.
Aortic pressure (AoP, dotted), LV pressure (LVP, solid), and coronary artery flow (CoF) with the counterpulsation device (CPD) operating with the early filling late ejection (a, b) and late filling early ejection algorithms (c, d). These figures show the (1) device filling and (2) device ejection timings. These data demonstrate lower LVP during ejection with the early filling late ejection algorithm.
Figure 5.
Comparison of LV pressure volume loops between baseline failure (solid), 40-ml CPD with early filling late ejection (dashed) and late filling early ejection (dotted), and 40-ml IABP operating with early filling early ejection (dash-dot). These data indicate lower mean ejection LV pressure (LVP) and external work (LVEW) with the early filling late ejection algorithm compared with early filling early ejection and late filling early ejection algorithms.
Figure 6.
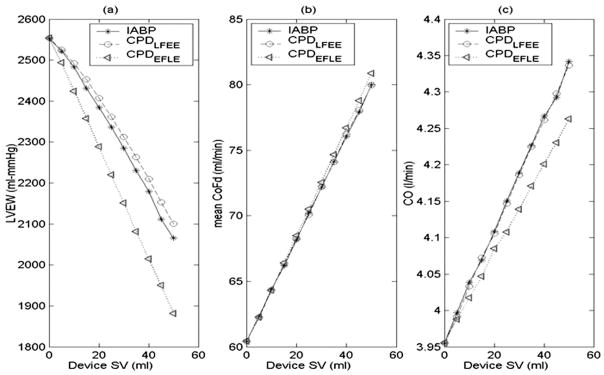
Comparison of the effect of device stroke volume (SV) between counterpulsation device (CPD) and IABP on (a) LV external work (LVEW), (b) mean diastolic coronary flow, and (c) cardiac output (CO). The 30-ml CPD operating in the early filling late ejection mode (dotted) reduces LVEW as much as the 40-ml IABP with minimal impact on the increase in CO.
Both the CPD and the IABP reduce the mean ejection pressure, LVEW and the mean LV volume (Figure 5) irrespective of the tested timing scenarios of the device. The CPD with early filling late ejection algorithm (Figures 4a and 4b) reduces the LVEW the most, but has higher end-systolic and end-diastolic ventricular volumes (Figure 5). The CPD with the late filling early ejection algorithm (Figures 4c and 4d) is best at reducing end-diastolic and end-systolic ventricular volumes but has the highest mean ejection pressure and LVEW (Figure 5). The IABP with the early filling early ejection IABP algorithm described in literature has values of peak LVP, end-systolic and end-diastolic pressures, and LVEW between the CPD operating at early filling late ejection and late filling early ejection algorithms.
Effect of Device Stroke Volume
The mean CoF, mean diastolic CoF, and cardiac output (CO) increase linearly and LV external work (LVEW) decreases linearly with increase in device stroke volume (SV) for both the IABP and the CPD (Figure 6). The IABP is more effective in reducing the LVEW than the CPD if operated with the same timing algorithm. However, with the early filling late ejection algorithm, the CPD device reduces the LVEW by up to an additional 10% in relation to the IABP (Figure 6a). Significantly, a 30-ml CPD device could produce an equivalent reduction in LVEW as a 40-ml IABP. Additionally, the CPD operating with the early filling late ejection algorithm provides a slightly higher (1–2%) mean diastolic CoF (Figure 6b). However, the CO with the IABP is slightly more than the CPD operating at the early filling late ejection algorithm (Figure 6c).
Effect of Device Filling Duration
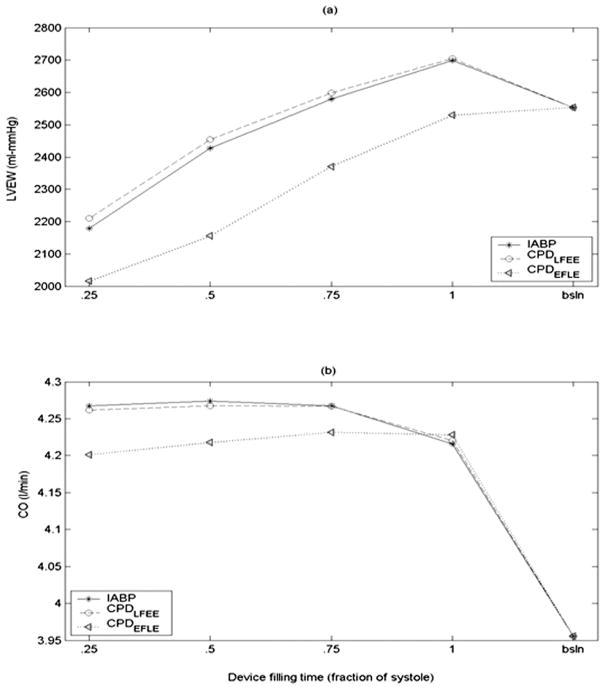
Figure 7 shows the effects of the device filling time as a fraction of systole on LVEW and CO with a 40-ml CPD and IABP. The peak LVP and LVEW increase with increase in duration of device filling irrespective of the timing (Figure 7a). The cardiac output remains essentially unchanged as a function of device filling time (Figure 7b). The CPD device with early filling late ejection algorithm reduces the LVEW considerably with minimal tradeoff on cardiac output increase.
Figure 7.
Comparison of the effect of device filling period as a fraction of the total systolic time on (a) LV external work (LVEW) and (b) cardiac output (CO). These data suggest that shorter device filling times are better at reducing LVEW.
Effect of Device Ejection Duration
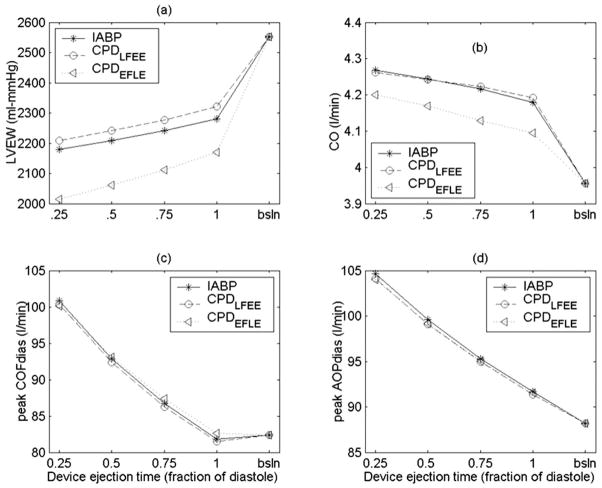
The LVEW increases and CO, peak diastolic CoF, and peak diastolic AoP decrease with increase in device ejection duration (Figure 8). Additionally, the mean diastolic AoP and mean diastolic CoF also decrease with an increase in device ejection duration. Additionally, a shorter device ejection duration increases the AoP augmentation and lowers the end-diastolic AoP.
Figure 8.
Comparison of the effect of device ejection period as a fraction of the total diastolic time on (a) LV external work (LVEW), (b) cardiac output (CO), (c) peak diastolic coronary artery flow (CoF), and (d) peak diastolic aortic pressure (AoP). These data suggest shorter device ejection times are better at reducing LVEW and increasing CO, peak diastolic CoF, and AoP.
Effect Of Support Modes And Profile
The hemodynamic benefits (e.g., reduction in LVEW, increase in CO) decrease with decrease in ratio of supported beats to unsupported beats. A sinusoidal profile is less efficient than a linear profile hemodynamically, but places less stress on the driving element of the pump.
Comparison of Computer Simulation and In Vitro Experiments
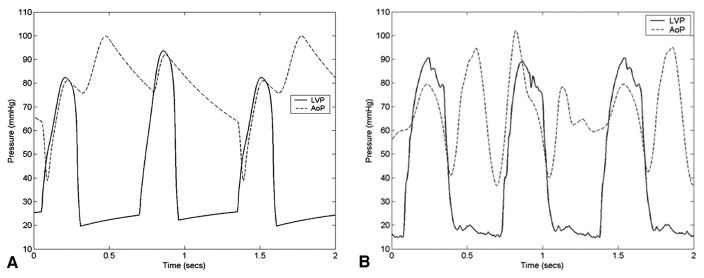
The hemodynamic waveforms recorded in the adult mock circulation model (Figure 9b) were similar to those predicted by the computer simulation (Figure 9a). Differences in waveform morphology can be attributed to slight deviations in CPD timing associated with performance limitations of our CPD driver. Specifically, in the mock circulation model there was no timing delay between CPD ejection and filling, resulting in an immediate reduction in AoP after augmentation within the same diastolic period. By contrast, in the computer simulation model CPD filling took place at the beginning of every assisted beat, enabling a time delay between CPD ejection and filling that could not be simulated in the mock circulation model. The degree of reduction in AoP during CPD filling was similar in the computer simulation and mock circulation models. Because the flexible ventricular sac of the mock circulation is compressed at the same driveline pressure for every ventricular contraction, the peak LVP is not reduced for assisted beats as predicted by the computer simulation.
Figure 9.
Comparison of the LV pressure (LVP) and the aortic pressure (AoP) waveforms obtained from the computer simulation and mock circulation models show the similarity in the hemodynamic waveform morphology. Differences in waveform morphology can be attributed to slight deviations in CPD timing associated with performance limitations of our CPD driver.
Discussion
The key finding from the computer simulation and mock circulation studies was that a 40-ml CPD cannulated to the subclavian artery may provide similar acute physiologic benefits of diastolic coronary augmentation and lower LVEW as an IABP, thus supporting concept feasibility and efficacy. Because almost all of the endocardial perfusion takes place during cardiac diastole, by counterpulsation, the CPD promotes diastolic flow and presumably improves endocardial perfusion. In this computer simulation and mock studies, the CPD provided up to 25% augmentation of peak diastolic aortic pressure which increased diastolic coronary perfusion by up to 34% compared to baseline (indicated as CPD SV = 0) failure (Figure 6a). The increased coronary flow increases the oxygen delivered to the myocardium, preventing myocardial hypoxia, and in some cases, helps the myocardium to recover from an ischemic injury.1
Additionally, the CPD also provided up to 34% reduction in LV end-diastolic pressure and 12% reduction in peak systolic aortic pressure, lowered LV workload by up to 26% and increased cardiac output by up to 10% from baseline failure.
The hemodynamic benefits provided by an IABP are slightly higher than the benefits provided by the CPD with the same timing algorithm, due to the losses associated with the CPD being farther away from the aorta. However, with the early filling late ejection algorithm, some of the hemodynamic benefits (lower mean ejection LVP and LVEW) afforded by the CPD could be increased considerably. Literature suggests that IABP inflation should be initiated at the aortic valve closure and deflation should be initiated just before the end of ventricular diastole and one half of the deflation completed before the end of LV diastole.2 Our simulation results indicate that by initiating the CPD filling just before the beginning of ventricular systole and completing the device filling before the opening of the aortic valve, a lower mean LV ejection pressure and LVEW (up to 10%) can be achieved in comparison to the early filling early ejection control algorithm for IABP described in literature. However, this timing does not directly volume unload the LV, resulting in higher end-systolic and end-diastolic LV volumes (Figure 5). The chronic benefit of a lower LVEW compared with a lower end-systolic and end-diastolic LV volume is unknown.
Our simulation results suggest that a 30-ml CPD with an early filling late ejection algorithm could be as effective as a 40 ml IABP with early filling early ejection algorithm in reducing LVEW (Figure 6a). However, this comes at the cost of a slightly reduced augmentation in CO. Shorter CPD filling times reduce the LVEW. However, a shorter CPD filling time may increase the likelihood of subclavian artery collapse. Simulation results predict a modest increase (1–2%) in mean diastolic CoF if the device ejection is initiated at the end of isovolumetric relaxation rather than at the dicrotic notch, because the resistance to the coronary and endocardial perfusion is lower at the end of isovolumetric relaxation than at the dicrotic notch. Shorter device ejection times lead to higher AoP augmentation and increased diastolic CoF. The implementation of the early filling late ejection algorithm requires precise knowledge of the timing of events in the cardiac cycle and hence requires high-fidelity sensors. Additionally, high-fidelity sensors are needed for adequate prediction of the cardiac cycle, especially in the presence of arrhythmias. The proposed CPD early filling late ejection algorithm can be potentially applied to IABPs.
Hemodynamic waveforms and characteristic flow and pressure parameters obtained from our mock circulatory system were in agreement to our computer simulation results for all the tested scenarios. However, due to limitations of the CPD driver we were unable to test every CPD duration and morphology control state evaluated in the computer simulation model in the mock circulation system. The computer simulation results suggest that development of drivers with the ability to control timing, morphology, and duration may enable further improvement in hemodynamics.
The ability of the CPD to control and adjust the device stroke volume, timing, and duration might be suitable for the development of weaning and testing procedures. For example, the LVEW may be gradually increased by gradually reducing the CPD SV or varying the support modes to strengthen the myocardium after confirmation of sufficient myocardial recovery. Further, ventricular response to the reduction in CPD support may be used as a potential measure of myocardial recovery.
Ventricular assist devices have been used as an effective therapy in patients with end-stage heart failure by “volume unloading” the heart to restore end-organ perfusion, but require major open heart surgery. The IABP has successfully treated cardiac dysfunction patients by “pressure unloading” the heart using a minimally invasive surgical procedure, but is limited to short-term application and immobilizes the patient in a supine position. The CPD has been designed to extend the duration of counterpulsation therapy beyond that of the IABP without the major surgical requirements of the VAD. The immediate hemodynamic benefits of “volume unloading” by a VAD are much greater than “pressure unloading” by counterpulsation. However, we hypothesize that patients with a moderate degree of heart failure are likely to benefit from a CPD. An attractive advantage of the CPD is that it requires only a simple superficial surgery which does not require cardiopulmonary bypass, thus simplifying the operative procedure and minimizing medical management costs and the risk of potential complications.
Limitations
The performance of the computer simulation and mock circulatory system during normal, failing, and recovering heart test conditions is representative of clinical observations from a purely hemodynamic viewpoint. Clearly, computer simulation and mock circulation studies are not intended to replace the importance and significance of in vivo models and are incapable of replicating all expected clinical responses, but do provide a valuable initial step in the device development process and detailed evaluation of a multitude of operation algorithms. Computer models rely on many assumptions that may have a dramatic influence on the interpretation of results. For example, the computer model for this study assumes ideal valves that open and close instantaneously, Newtonian blood, and does not account for inertial or gravitational effects, but does enable prediction of hemodynamic and ventricular pressure–volume responses. Additionally, only a comparison of waveform morphology, pressure–volume loops, and ejection pressures could be made with the mock circulation tests. An exhaustive comparison of the computer simulation and mock experiment results was not possible owing to the timing limitations of the current CPD driver. However, it is hoped that the computer simulation and mock circulation experimental findings enable the further development and testing of optimal timings, device control strategies, and experimental protocols that can be translated into an in vivo model to validate the viability of techniques for myocardial support and recovery.
In conclusion, the results of this study predict that a 30-ml CPD may provide acute hemodynamic benefits similar to that of a 40-ml IABP supporting device concept feasibility. Of the three timing protocols tested, the early filling late ejection algorithm may provide optimal hemodynamic support. The next step in the development process will be evaluation of the CPD in an acute large-animal model. The primary advantage of the CPD approach is the ability to provide chronic counterpulsation support using a superficial surgical approach.
Acknowledgments
Funding for this project was provided for by a grant from the Whitaker Foundation (RG-01-0310).
This project was funded by a grant from the Whitaker Foundation (RG-01-0310).
References
- 1.Nanas JN, Moulopoulos SD. Counterpulsation: Historical background, technical improvements, hemodynamic and metabolic effects. Cardiology. 1994;84:156–167. doi: 10.1159/000176394. [DOI] [PubMed] [Google Scholar]
- 2.Papaioannou GT, Stefanadis C. Basic principles of the intraaortic balloon pump and mechanisms affecting its performance. ASAIO J. 2005;51:296–300. doi: 10.1097/01.mat.0000159381.97773.9b. [DOI] [PubMed] [Google Scholar]
- 3.Torchiana DF, Hirsch G, Buckley MJ, et al. Intraaortic balloon pumping for cardiac support: trends in practice and outcome, 1968 to 1995. J Thor Cardiovasc Surg. 1997;113:758–764. doi: 10.1016/S0022-5223(97)70235-6. [DOI] [PubMed] [Google Scholar]
- 4.Freed PS, Wasfie T, Zado B, Kantrowitz A. Intraaortic balloon pumping for prolonged circulatory support. Am J Cardiol. 1988;61:554–557. doi: 10.1016/0002-9149(88)90763-1. [DOI] [PubMed] [Google Scholar]
- 5.Manord JD, Garrard CL, Mehra MR, et al. Implications for the vascular surgeon with prolonged (3 to 89 days) intraaortic balloon pump counterpulsation. J Vasc Surg. 1997;26:511–516. doi: 10.1016/s0741-5214(97)70044-2. [DOI] [PubMed] [Google Scholar]
- 6.Jeevanandam V, Jayakar D, Anderson AS, et al. Circulatory assistance with a permanent implantable IABP: Initial human experience. Circulation. 2002;24:I183–I188. [PubMed] [Google Scholar]
- 7.Schraut W, Kiso I, Freed P, et al. Permanent in-series cardiac assistance with the dynamic aortic patch: Blood-prosthesis interaction in long-term canine experiments. Surgery. 1976;79:193–201. [PubMed] [Google Scholar]
- 8.Nanas JN, Lolas CT, Charitos CE, et al. A valveless high stroke volume counterpulsation device restores hemodynamics in patients with congestive heart failure and intractable cardiogenic shock awaiting heart transplantation. J Thorac Cardiovasc Surg. 1996;111:55–61. doi: 10.1016/s0022-5223(96)70401-4. [DOI] [PubMed] [Google Scholar]
- 9.Giridharan GA, Ewert DL, Pantalos GM, et al. Left ventricular and myocardial perfusion responses to volume unloading and afterload reduction in a computer simulation. ASAIO J. 2004;50:512–518. doi: 10.1097/01.mat.0000136513.21369.75. [DOI] [PubMed] [Google Scholar]
- 10.Giridharan GA, Skliar M, Olsen DB, Pantalos GM. Modeling and control of a brushless DC axial flow ventricular assist device. ASAIO J. 2002;48:272–289. doi: 10.1097/00002480-200205000-00013. [DOI] [PubMed] [Google Scholar]
- 11.Giridharan GA, Skliar M. Control strategy for maintaining physiological perfusion with implantable rotary blood pumps. Artif Organs. 2003;27:639–48. doi: 10.1046/j.1525-1594.2003.07089.x. [DOI] [PubMed] [Google Scholar]
- 12.Giridharan GA, Skliar M. Nonlinear controller for ventricular assist devices. Artif Organs. 2002;26:980–984. doi: 10.1046/j.1525-1594.2002.07136.x. [DOI] [PubMed] [Google Scholar]
- 13.Giridharan GA, Skliar M. Modeling of the human circulatory system with an axial flow ventricular assist device. Proceedings of the American Control Conference; 2001. pp. 3801–3806. [Google Scholar]
- 14.Pantalos GM, Gillars KJ, Ewert DL, et al. Characterization of an adult mock circulation for testing cardiac support devices. ASAIO J. 2004;50:37–46. doi: 10.1097/01.mat.0000104818.70726.e6. [DOI] [PubMed] [Google Scholar]
- 15.Rosenberg G, Phillips WG, Landis DL, Pierce WS. Design and evaluation of the Pennsylvania State University mock circulatory system. ASAIO J. 1981;4:41–49. [Google Scholar]
- 16.Pantalos GM, Hayes J, Khanwilkar P, et al. Left ventricular simulator for cardiovascular device testing. ASAIO J. 1996;42:46. [Google Scholar]
- 17.Koenig SC, Woolard C, Drew G, et al. Integrated data acquisition system for medical device testing and physiology research in compliance with good laboratory practices. Biomed Instrum Technol. 2004;38:229–240. doi: 10.2345/0899-8205(2004)38[229:IDASFM]2.0.CO;2. [DOI] [PubMed] [Google Scholar]
- 18.Drew GA, Koenig SC. LabVIEW for Automative, Telecommunications, Semiconductor, Biomedical, and other Applications. Upper Saddle River, NJ: Prentice Hall PTR; 2000. Biomedical patient monitoring, data acquisition, and playback with labview; pp. 92–98. [Google Scholar]
- 19.Schroeder MJ, Perrrault B, Ewert DL, Koenig SC. HEART: An automated beat-to-beat cardiovascular analysis package using Matlab™. Comput Biol Med. 2004;34:371–388. doi: 10.1016/S0010-4825(03)00087-8. [DOI] [PubMed] [Google Scholar]


