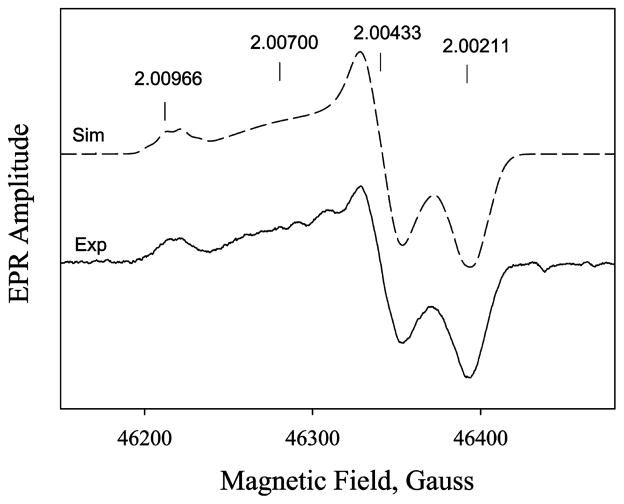
Figure 5.
D-band (130 GHz) EPR spectra of 240 μM PGIS reacted with a 10-fold excess PA for 100 ms and freeze quenched in <1 s. Exp, the experimental spectrum (solid line); Sim, the simulated spectrum (dash line) using the parameter values shown in Table 2. The experimental spectrum is the first derivative of an average of five echo-detected spectra obtained at 15 K with ~22 min total acquisition time and parameters described in Materials and Methods.

