Abstract
The hypothesis was tested that estradiol (E2) from the ovarian follicles controls time of luteolysis. Time of luteolysis was evaluated by multiple measures of corpus luteum (CL) structure (area, volume) and function (progesterone [P4], luteal blood flow). The hypothesis for experiment 1 was that repeated ablation of follicles would reduce circulating E2 and delay luteolysis. Heifers were randomly assigned on Day 9 (Day 0 = ovulation) to three groups. All follicles ≥4 mm were ablated on Day 9 (group FA9; n = 6); Days 9–15 (group FA15; n = 6); or Days 9–21 (group FA21; n = 7). As expected, follicular ablation delayed (P < 0.001) the rise in circulating E2 and peak E2 concentrations (FA9, Day 17.6 ± 0.7; FA15, Day 20.3 ± 0.3; FA21, Day 24.9 ± 0.3). Luteolysis (based on each measure) was delayed (P < 0.005) by repeated ablation of follicles, with earlier luteolysis (based on P4 decrease) in FA9 (Day 15.2 ± 0.8) than FA15 (Day 16.5 ± 0.4), and a further delay in FA21 (Day 18.3 ± 0.5). The hypothesis of experiment 2 was that exogenous treatment with E2 would stimulate prostaglandin F2alpha (PGF) secretion and prevent the delay in luteolysis associated with follicular ablations. Follicles ≥4 mm were ablated from Day 9 to Day 17 (n = 15). Heifers were treated on Days 13 and 15 with 1.0 mg of estradiol benzoate (FAE2; n = 7) or vehicle (FAV; n = 8). Treatment with E2 induced PGF secretion (detected by PGF metabolite) and induced earlier (P < 0.02) luteolysis in FAE2 than in FAV, whether determined by circulating P4 or by area, volume, or blood flow of CL. In summary, ablation of follicles (≥4 mm) delayed and treatment with E2 hastened luteolysis in heifers with ablated follicles. Thus, these results are consistent with an essential role for follicle E2 in timing of luteolysis.
Keywords: blood flow, corpus luteum, estradiol, luteolysis, progesterone
Timing of CL regression is determined by estradiol-17β (E2) from follicles induction of uterine PGF2α secretion with subsequent decrease in blood flow, size, and steroidogenesis of the CL.
INTRODUCTION
In cattle, the reported average length of the estrous cycle varies from 18 to 24 days [1–3]. The lifespan of the corpus luteum (CL) is the major determinant of the length of the cycle. Functional and structural regression of the CL (luteolysis) starts on Day 15 (Day 0 = ovulation) in heifers [4] and is attributed to secretion of prostaglandin F2α (PGF) from the uterus. Current models on the mechanisms regulating luteolysis in ruminants contain critical roles for changes in expression of endometrial receptors for estradiol (E2), progesterone (P4), and oxytocin in regulation of the timing of uterine PGF secretion and subsequent luteolysis (reviewed in Silvia et al. [5], Arosh et al. [6], and Weems et al. [7]). In these models, E2 receptor expression is suppressed in the endometrium during early and mid luteal phases, presumably by an inhibitory action of the increasing P4 concentrations [8]. There is also an inhibitory action of P4 on oxytocin receptor gene expression in cows during the early and mid luteal phases of the cycle [9]. A critical aspect of these models is an increase in E2 receptor (ESR1) in the uterus after a decrease in uterine P4 receptor (PGR) and/or decreased uterine P4 sensitivity [10]. Subsequently, activation of E2 receptor by circulating E2 is postulated to stimulate the synthesis of endometrial oxytocin receptors, with subsequent oxytocin-induced secretion of PGF from the uterus [5, 11, 12]. In cattle, the initial rise in oxytocin receptors preceding luteolysis occurs 15–16 days after estrus [13, 14]. In this regard, uterine venous PGF first increases 15–16 days after estrus in cows [15], with increases in circulating concentrations of the PGF metabolite, 13,14-dihydro-15-keto-PGF2α (PGFM), generally used as a monitor for uterine PGF secretion [4, 16].
Circulating E2 has been proposed to have a central role in the physiologic cascade involved in luteolysis [17]. In this regard, it is well known that follicle growth in cattle is characterized by follicular waves, with selection of a single dominant follicle from each wave [18]. After emergence, circulating E2 increases from nondetectable concentrations (<0.2 pg/ml) during wave emergence to low but increasing concentrations (1–2 pg/ml) at the beginning of follicular deviation, a time when the future dominant follicle begins to have a greater growth rate than the future largest subordinate follicle [18, 19]. The source of E2 during luteolysis would be expected to be the ovarian follicles, especially the largest or future dominant follicle that would become the ovulatory follicle [19]. Several experiments conducted before the introduction of ultrasound for follicle evaluation [20] have supported the involvement of the follicles in regulation of the luteolytic cascade. Destruction of ovarian follicles by electro cauterization in sheep [21, 22] or x-ray irradiation in heifers [23–25] extended CL lifespan. More recently, a delay in luteolysis was found in heifers when follicle-stimulating hormone (FSH), and therefore follicle growth, was suppressed by treatment with charcoal-extracted bovine follicular fluid [17]. However, no difference was observed in mean serum E2 concentrations between control and follicular fluid-treated cows. Although the follicle destruction and suppression studies have shown that the follicles are needed for luteolysis to occur at the expected time, such studies did not demonstrate that the active follicular factor was E2. However, other studies are compatible with a pivotal role for E2 in luteolysis. Treatment with pharmacological doses of exogenous E2 stimulated PGF secretion and premature luteolysis in cows and sheep [26–28]. However, a role for endogenous E2 from follicles as a stimulator of PGF secretion in the timing of luteolysis was not demonstrated directly in any of these studies.
The present experiments evaluated the physiologic relationship between production of E2 by follicles and timing of luteolysis. Experiment 1 was designed to study the effects of repeated follicular ablations on the timing of luteolysis. Experiment 2 used the delayed-luteolysis model developed in experiment 1 to study the effects of exogenous E2 treatment on timing of uterine PGF secretion and luteolysis. The cow was chosen as the animal model for these studies because ultrasound-guided follicular ablation can be used to continuously eliminate follicles even as multiple measures of CL structure and function (size, blood flow, circulating P4) are monitored to determine the timing of luteolysis. The hypotheses were: 1) repeated ablation of follicles reduces circulating E2 and delays luteolysis (experiment 1) and 2) exogenous treatment with E2 induces uterine secretion of PGF and luteolysis (experiment 2). To provide additional information on the CL during these experiments, transrectal grayscale (B-mode) and color Doppler ultrasonography were used to measure the area, volume, and blood flow of the CL.
MATERIALS AND METHODS
Animals
Animals were handled in accordance with the U.S. Department of Agriculture's guide for Care and Use of Agricultural Animals in Research, with procedures approved by the Animal Care and Use Committee of the University of Wisconsin-Madison College of Agriculture and Life Sciences. A total of 34 Holstein and crossbred heifers were used in two experiments during March to May (experiment 1) and September to October (experiment 2). In experiment 1, heifers (n = 19) were ages 18–24 mo and weighed 505–737 kg (587.6 ± 16.7 kg). In experiment 2, heifers (n = 15) were ages 12–16 mo and weighed 325–468 kg (376 ± 10.9 kg). During both experiments, heifers had free access to a mixture of grass and alfalfa hay, mineralized salt, and water. Heifers were in good body condition throughout the experiments (>2.75 on scale of 1 to 5, with 1 being emaciated and 5 being obese). The heifers had been selected previously for docile temperament and no apparent abnormalities of the reproductive tract, as determined by ultrasound examinations [29].
Ultrasound Scanning
A duplex B-mode (grayscale) and pulsed-wave color Doppler ultrasound instrument (Aloka SSD 3500; Aloka America, Wallingford, CT) equipped with a linear-array, 7.5-MHz transducer was used for transrectal scanning as described previously [29, 30]. To generate optimal ultrasound images, heifers were sedated during scanning with xylazine hydrochloride (14 mg per heifer i.m.; Xila-ject; Phoenix Pharmaceutical Inc., St. Joseph, MO), as described previously [31]. This sedation method did not induce local changes in vascular perfusion in the ovaries or endometrium, as determined by color Doppler ultrasonography [31]. The heifers were scanned daily to identify the day of ovulation (Day 0). The experiment started on Day 9, and heifers were scanned once a day until the next ovulation. The maximum CL area (in square centimeters) and volume (in cubic centimeters) were determined at each examination using a B-mode still image and the tracing function (area) or the three-dimensional volume option (volume) in each experiment. The CL cavity was subtracted from the area and volume. The time of day for ultrasound examinations was kept constant during each experiment. Heifers were scanned between 1900 and 2300 h in experiment 1 and between 1500 and 1900 h in experiment 2.
In color Doppler (Power-flow mode), the displayed color signals were used to estimate the percentage of CL area with blood flow during real-time scanning, as described [4, 32] and validated [4, 32, 33] previously. All scans were performed at a constant color-gain setting and a velocity setting of 6 cm/sec. A velocity setting was used that maximized detection of blood flow by color signals with minimal aliasing [30]. The principles and techniques of transrectal Doppler ultrasonography in large-animal reproduction have been reviewed previously [30, 34].
Follicle Ablations
Ultrasound-guided transvaginal ablation of follicles was performed as described previously [35, 36]. Briefly, the ultrasound scanner was equipped with a 7.5-MHz sector transducer and was used transvaginally to image the follicles during transrectal ovarian manipulation. A 17-gauge needle (connected to a vacuum pump) was inserted through the transvaginal transducer and into each follicle ≥4 mm, and the contents were removed under vacuum suction (∼130 mm Hg). The ablation procedures were done after obtaining the CL and follicular data. Caudal epidural anesthesia (2–4 ml of 2% lidocaine hydrochloride; Phoenix Pharmaceutical) was used to minimize abdominal straining. The ovaries were reexamined by transrectal ultrasonography to assess whether all follicles ≥4 mm were ablated successfully.
Experiment 1
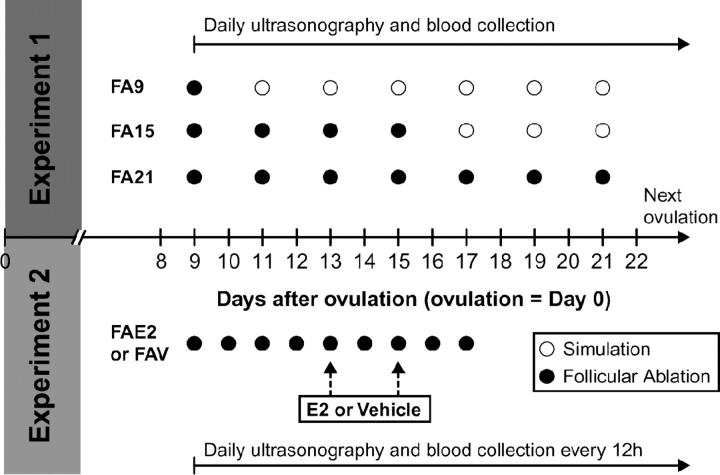
On Day 9, heifers were assigned randomly by replicate to three treatment groups. All follicles ≥4 mm were ablated on Day 9 (group FA9; n = 6); Days 9, 11, 13, and 15 (group FA15; n = 6); or Days 9, 11, 13, 15, 17, 19, and 21 (group FA21; n = 7). Any follicle >5.5 mm found between two ablation sessions (for groups FA15 and FA21) was also ablated; this criterion was based on a previous trial. It was assumed that follicles that continued to grow or refill with fluid during a 2-day interval between ablations may secrete E2. A sham ablation procedure was performed for group FA9 (on Days 11, 13, 15, 17, 19, and 21) and for group FA15 (on Days 17, 19, and 21). After the last ablation for each group, the four largest follicles were tracked until ovulation by ultrasonography, as described previously [29]. Blood samples were taken by puncture of the coccygeal vein once a day just before each ultrasound examination until ovulation occurred. The protocol is shown (Fig. 1).
FIG. 1.
Experimental procedures used in experiment 1 (upper diagram) and in experiment 2 (lower diagram). FA9, FA15, and FA21 (experiment 1), and FAE2 and FAV (experiment 2) represent the groups in which heifers were allocated to different ablation sessions. Filled circles represent a follicular ablation session, and open circles represent a simulation of the procedure.
Experiment 2
All follicles ≥4 mm were ablated every day in 15 heifers, starting on Day 9 and lasting until Day 17. On Day 13, heifers were assigned randomly by replicate into a follicle-ablation estradiol group (FAE2; n = 7) and a follicle-ablation vehicle group (FAV; n = 8). The heifers in FAE2 received two treatments of 1.0 mg of estradiol benzoate diluted in sesame oil i.m. at 0700 h on Days 13 and 15, as shown in Figure 1. The heifers in group FAV received an equivalent volume of sesame oil. After the last ablation, the four largest follicles were tracked until next ovulation by ultrasonography, as in experiment 1. Blood samples were taken by puncture of the coccygeal vein every 12 h from Day 9 to ovulation. On Days 13 and 15, blood samples were also taken 2 h before, immediately before, and 2, 4, 8, and 12 h after E2 or vehicle injection to measure plasma E2 and PGFM.
Blood Samples and Hormone Assays
Blood samples were collected into heparinized tubes and immediately placed in ice-cold water for 10 min. The tubes were centrifuged (2000 × g for 10 min), and plasma was separated and stored at −20°C until assayed. The plasma samples were assayed for P4, E2, and FSH in experiments 1 and 2 and also for PGFM in experiment 2.
Plasma P4 concentrations were measured using a solid-phase radio immunoassay (RIA) kit containing antibody-coated tubes and 125I-labeled P4 (Coat-A-Count Progesterone; Diagnostic Products Corp., Los Angeles, CA). The assay procedure for bovine plasma was validated in our laboratory as described previously [4]. The intraassay coefficient of variation (CV) and sensitivity were 8.0% and 0.04 ng/ml, respectively, for experiment 1. The intraassay CV, interassay CV, and sensitivity were 3.0%, 4.8%, and 0.02 ng/ml, respectively, for experiment 2.
Plasma concentrations of E2 were determined using a commercial RIA kit (Double Antibody Estradiol; Diagnostic Products). The procedure in our laboratory has been described previously for cattle [18, 37], with the following modifications. Standards (0.78–100 pg/ml) were prepared in steroid-free (charcoal-treated) bovine plasma. The standards and plasma samples (500 μl in duplicate) were extracted with 3 ml of diethyl ether, frozen in a dry-ice/methanol bath, decanted into assay tubes, and dried overnight under the hood. The dried samples and standards were resuspended with 100 μl of assay buffer (0.1% gelatin in PBS). The intra-assay CV, interassay CV, and sensitivity were 6.2%, 7.7%, and 0.08 pg/ml, respectively, for experiment 1, and 5.0%, 7.0%, and 0.09 pg/ml, respectively, for experiment 2.
Plasma FSH concentrations were measured by RIAs as previously described [38, 39] and modified [40] in our laboratories. Intraassay CV and sensitivity for experiment 1 were 6.5% and 0.03 ng/ml, respectively. For experiment 2, the intraassay CV, interassay CV, and sensitivity were 8.3%, 6.5%, and 0.03 ng/ml, respectively. The RIA procedure for plasma concentrations of PGFM has been described [41, 42] and validated in our laboratory [4]. The intraassay CV and the sensitivity were 8.3% and 45.4 pg/ml, respectively.
Definitions
The beginning of luteolysis was indicated by the first significant decrease in mean P4 concentrations between two consecutive days (experiment 1) or at 24-h intervals (experiment 2) based on paired t-tests within a group. The 24-h interval was used to avoid potential confusion from diurnal variation in P4 concentration. For comparisons among end points, timing of functional luteolysis was defined as the day after ovulation before serum P4 declined to less than 50% of the average for the four maximum P4 concentrations in the cycle, as described previously [43]. Similarly, timing of morphologic luteolysis was based on a 50% decrease in CL blood flow, CL volume, or CL area. Thus, to provide uniformity in comparing the different methods for defining functional versus structural luteolysis, all calculations were based on a 50% decrease from the four maximal values.
Day of follicular wave emergence was defined as the day subsequent to ablation (FA9 in experiment 1) or after the last ablation (FA15 and FA21 in experiment 1, and FAE2 and FAV in experiment 2) in which follicles greater than 4 mm were identified and continued to grow. For each follicular wave, the follicle that reached the largest diameter was defined as the largest follicle. Growth rate of the largest follicle was calculated by subtracting the follicular diameter at emergence from the greatest diameter of the largest follicle before ovulation and dividing by the number of days between these values. One ablation session was defined as the procedure in which follicles ≥4 mm in each heifer were ablated after each ultrasound scanning. A period of ablation was defined as the interval (in days) between the first ablation session and the last session for each group. For example, group FA15 had a period of ablation of 7 days.
Statistical Analysis
Data were examined for normality with the Shapiro-Wilk test. Data that were not normally distributed were transformed to natural logarithms, square roots, or rank, except that percentage CL blood flow was transformed by arcsine. The data were analyzed by SAS MIXED procedure (version 9.1.3; SAS Institute Inc., Cary, NC) with a REPEATED statement for main effects of group and time (day or hour) and their interaction. Differences between two means were evaluated by Student t-test, and differences among more than two means were further analyzed by Duncan multiple-range test. A probability of P ≤ 0.05 was used to indicate significance, and probabilities between P > 0.05 and P ≤ 0.10 indicated that a difference approached significance. Data are given as the mean ± SEM unless otherwise indicated.
RESULTS
Experiment 1
The mean (±SEM) number of ablations per heifer for groups FA9, FA15, and FA21 was 1.3 ± 0.2, 5.8 ± 0.3, and 10.3 ± 0.6, respectively. There were no significant differences for the interval between ablations (1.2 ± 0.06 and 1.3 ± 0.09 days) or for mean diameter of the largest follicle during the ablation period (6.4 ± 0.2 and 6.2 ± 0.2 mm) between FA15 and FA21, respectively.
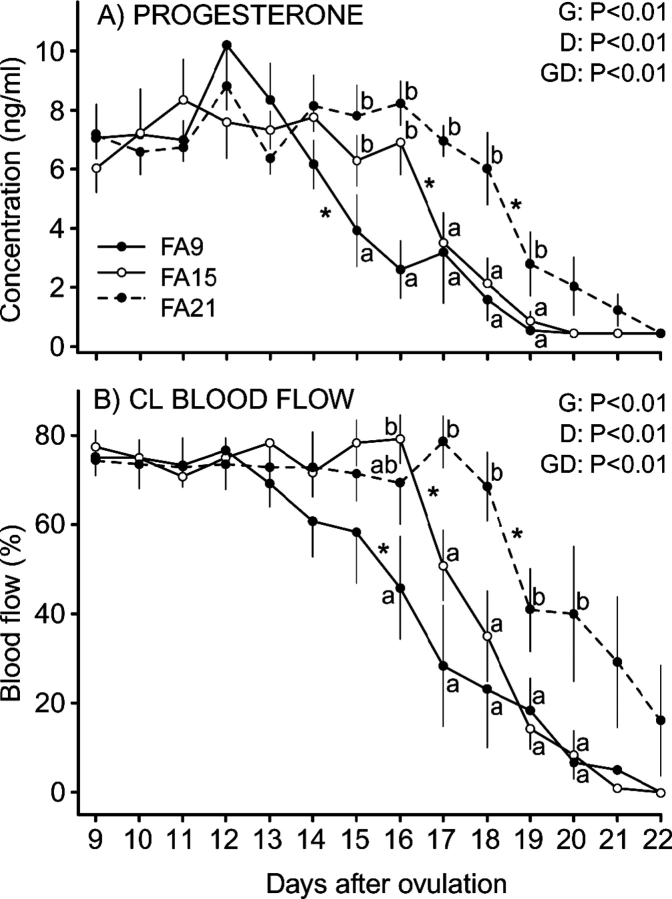
Circulating concentrations of P4 and results of statistical analyses are shown (Fig. 2A). The main effects of day and group and the interaction were significant. The interaction of group by day reflected an earlier decrease (initiation of functional luteolysis; P <0.05) in concentrations for FA9 (after Day 14) compared with after Day 16 in FA15 and after Day 18 in FA21. At Days 15 and 16, P4 was lower in FA9 than in the other two groups, and P4 was higher on Days 17, 18, and 19 in FA21 than in the other two groups. The changes in CL blood flow and the results of statistical analyses are presented (Fig. 2B). Main effects and the interaction were significant. The first decrease (P < 0.05) in blood flow began after Days 15, 16, and 18 for FA9, FA15, and FA21, respectively. Differences between groups on specific days after ovulation are shown (Fig. 2B).
FIG. 2.
Mean (±SEM) plasma P4 concentrations (A) and changes in CL blood flow (B) during luteolysis in heifers in which all follicles ≥4 mm were ablated once on Day 9 (FA9; n = 6); ablated every 2 days from Day 9 to Day 15 (FA15; n = 6); or ablated every 2 days from Day 9 to Day 21 (FA21; n = 7). Main effects of group (G), day (D), and their interaction (GD) are shown. Different lowercase letters (a and b) indicate differences (P < 0.05) among groups within a time period. An asterisk (*) indicates the first significant decrease between 2 days.
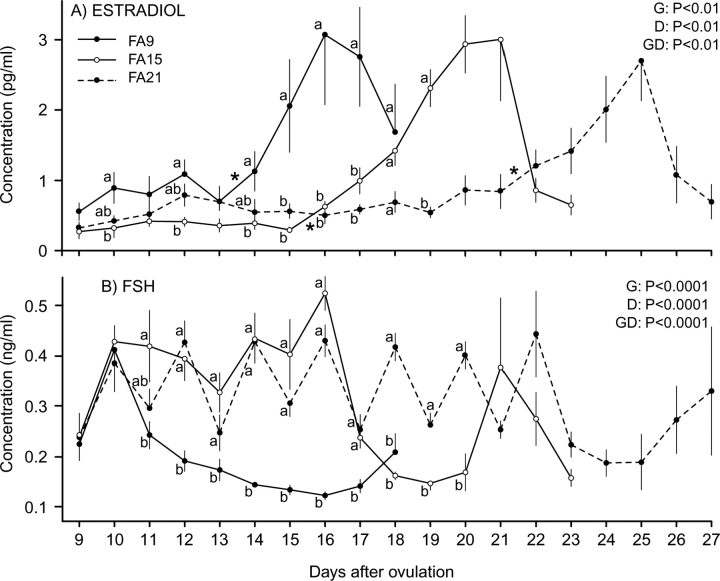
For circulating E2 concentrations, the main effects of group and day and their interaction were significant (Fig. 3A). The interaction was primarily due to the first increase (P < 0.05) in E2 beginning at different days for FA9 (Day 13), FA15 (Day 15), and FA21 (Day 21), and peak E2 on different days for FA9 (Day 16), FA15 (Day 21), and FA21 (Day 25). In FA21, the increase in E2 approached significance (P < 0.08) on Day 20. Other differences among groups are shown in Figure 3A. The mean FSH concentrations and the statistical analyses are presented (Fig. 3B). Main effects of group and day and their interaction were significant. The interaction involved greater (P < 0.05) FSH concentrations in FA15 and FA21 than in FA9 from Day 12 until Day 17 and greater (P < 0.05) concentrations in FA21 than in FA15 on Days 18, 19, and 20. Concentrations increased (P < 0.05) in all three groups between Days 9 and 10, following the first follicle ablation, and began to decrease on Days 11, 17, and 22 in groups FA9, FA15, and FA21, respectively.
FIG. 3.
Mean (±SEM) plasma E2 concentrations (A) and plasma FSH concentrations (B) during luteolysis in heifers in which all follicles ≥4 mm were ablated once on Day 9 (FA9; n = 6); ablated every 2 days from Day 9 to Day 15 (FA15; n = 6); or ablated every 2 days from Day 9 to Day 21 (FA21; n = 7). Main effects of group (G), day (D), and their interaction (GD) are shown. Different lowercase letters (a and b) indicate differences (P < 0.05) among groups within a time period. An asterisk (*) indicates the first significant increase in plasma E2 concentration between 2 days.
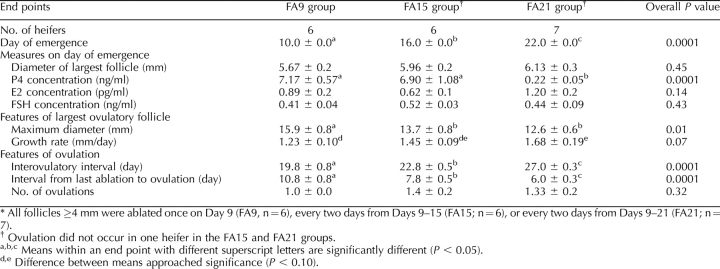
The key results of experiment 1 are summarized in Tables 1 and 2. The day of wave emergence differed among groups; emergence occurred on the day following the last follicular ablation in all groups (Table 1). Concentrations of P4, E2, and FSH on day of emergence of the follicular wave are shown for each group (Table 1). Only P4 concentration differed among groups and was lower (P < 0.05) in the FA21 group than in the other two groups. As expected, the intervals from ovulation to ovulation and from emergence to ovulation increased and decreased progressively in groups FA9, FA15, and FA21. Maximum diameter of the largest follicle was greater for group FA9 than for the other two groups. Differences in growth rate of the largest follicle approached significance, with a greater growth rate in the FA21 group than in the FA9 group and an intermediate value for the FA15 group.
TABLE 1.
Effects (mean ± SEM) of repeated follicular ablations on P4, E2, and FSH concentrations and follicle characteristics in heifers during experiment 1.*
TABLE 2.
Effects (mean ± SEM) of repeated follicular ablations on timing of luteolysis and hormonal and luteal characteristics on the day before luteolysis in heifers during experiment 1, as measured by multiple methods.*
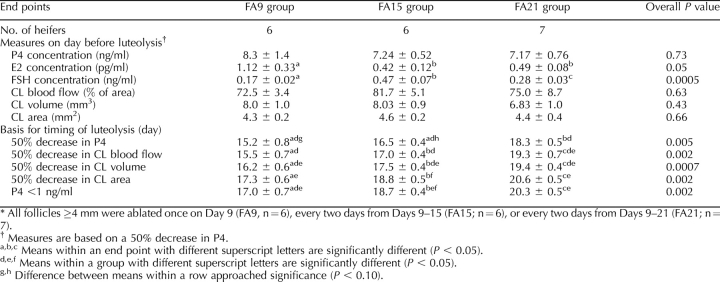
Table 2 summarizes the key analyses related to luteolysis in experiment 1. Concentrations of P4 and CL characteristics (blood flow, volume, and area) did not differ among groups on the day prior to luteolysis (based on a 50% decrease in P4). Concentration of E2 on the day before luteolysis was greater for FA9 than for the other two groups. Concentrations of FSH were lower in FA9 than in the other two groups, with FA15 and FA21 also differing. Day of luteolysis—functional or structural (Table 2)—significantly differed among groups for all end points. Luteolysis was delayed in that the interval (days) from ovulation to luteolysis was greater for FA21 than for FA15 and was greater for FA15 than for FA9 for all end points, except that the day of luteolysis based on a 50% decrease in P4 approached a significant difference between FA9 and FA15. In general, luteolysis occurred 1.5 days later in FA15 than in FA9, and another 1.9 days later in FA21 than in FA15. The day of luteolysis significantly differed among end points (comparisons within columns) within a group. Luteolysis was similar when based on a 50% decrease in P4, CL blood flow, and CL volume, but it occurred later when based on CL area or P4 <1 ng/ml.
Experiment 2
The number of ablation sessions was greater (P = 0.05) for FAV (8.8 ± 0.3) than for FAE2 (7.3 ± 0.9), and the interval between ablations (1.04 ± 0.04 and 1.39 ± 0.22 days, respectively) approached a significant difference (P = 0.06). Diameter of the largest follicle during the ablation period was greater (P < 0.01) for FAV (5.68 ± 0.13 mm) than for FAE2 (4.94 ± 0.17 mm).
For E2 (Fig. 4A), main effects of group and time and their interaction were significant. The interaction reflected greater (P < 0.05) E2 concentrations in FAE2 than in FAV from Day 13 until Day 18. The mean circulating E2 concentrations were below 0.5 pg/ml during the ablation period from Day 9 (1900 h) until Day 13 (0700 h) in FAE2 or until Day 17 (1900 h) in FAV. In FAV, mean plasma E2 concentration remained below 0.5 pg/ml until 2 days after ablation ended (Day 19 at 0700 h). Mean plasma E2 concentration for FAV first increased (P < 0.05) on Day 21 (0700 h).
FIG. 4.
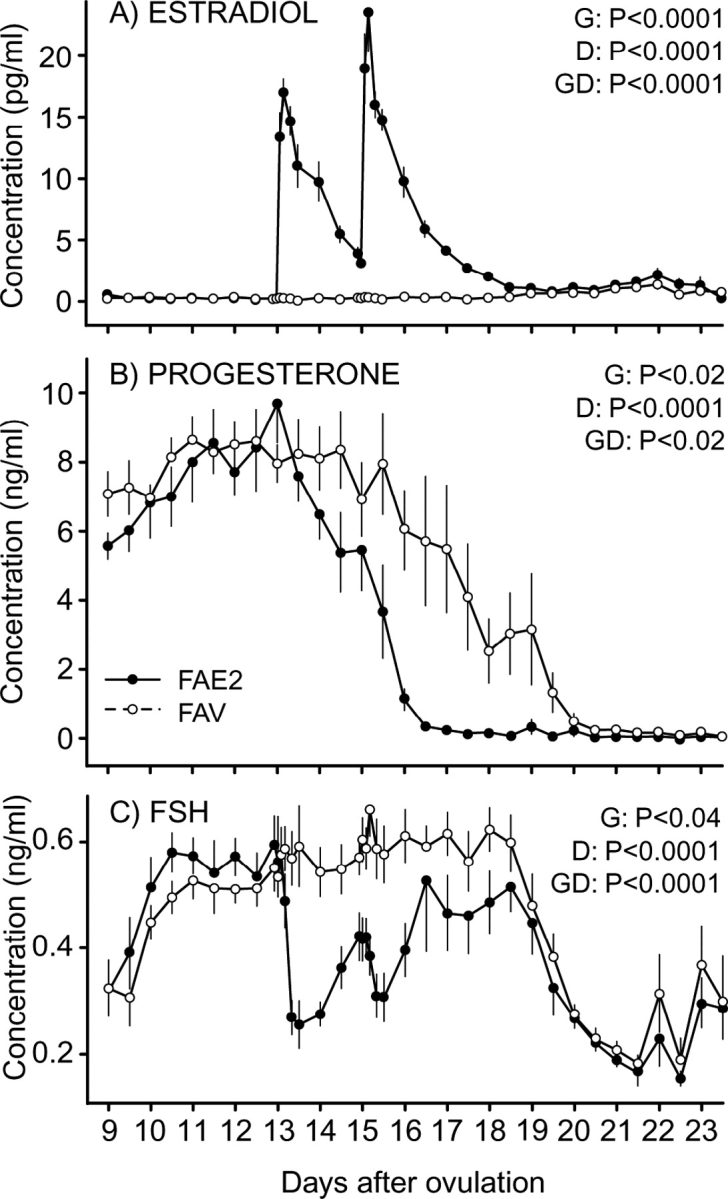
Mean (±SEM) concentrations of plasma E2 (A), P4 (B), and FSH (C) during luteolysis in heifers in which all follicles ≥4 mm were ablated every day from Day 9 to Day 17. Heifers were assigned to receive two i.m. injections of 1.0 mg of estradiol benzoate diluted in sesame oil on Day 13 and Day 15 (FAE2) or the equivalent volume of vehicle (sesame oil; FAV). Main effects of group (G), day (D), and their interaction (GD) are shown.
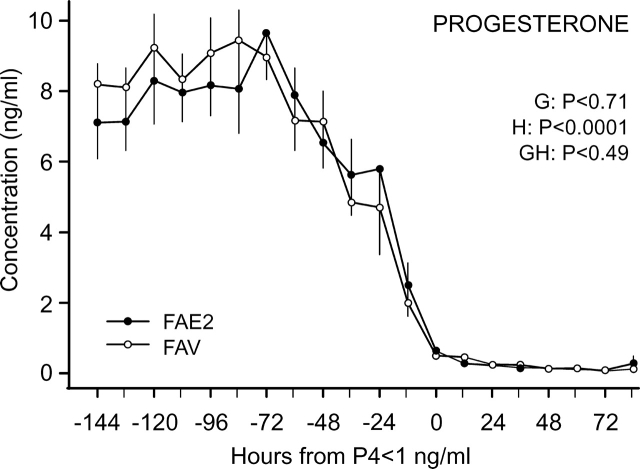
Both main effects and the interaction were significant for circulating P4 concentrations (Fig. 4B). The interaction reflected the beginning of an earlier (P < 0.01) decrease in FAE2 (Day 14) than in FAV (Day 16). Concentrations reached less than 1 ng/ml earlier in FAE2 (Day 16) than in FAV (Day 19), with concentrations lower (P < 0.05) in FAE2 than in FAV at most days from Day 14 to Day 19. Concentrations of P4 were also normalized in each heifer to the hour when the decreasing plasma P4 concentrations reached <1 ng/ml (Hour 0; Fig. 5) and were analyzed from Hour −144 to Hour 84. The timing of the decrease in P4 did not differ between the two groups after this normalization, with no significant group effect or interaction, as shown.
FIG. 5.
Mean (±SEM) P4 concentrations during luteolysis in heifers in which all follicles ≥4 mm were ablated every day from Day 9 to Day 17. Data were normalized to the first hour that P4 decreased to <1 ng/ml. Heifers were assigned to receive two i.m. injections of 1.0 mg of estradiol benzoate diluted in sesame oil on Day 13 and Day 15 (FAE2) or the equivalent volume of vehicle (sesame oil; FAV). Main effects of group (G), hour (H), and their interaction (GH) are shown.
For FSH concentration (Fig. 4C), the interaction of group by time was due to a precipitous decrease (P < 0.05) in FAE2 beginning 8 h after treatment on Day 13, followed by a recovery and then another decrease after the second treatment (Day 15), and final recovery reaching values similar to those of FAV on Day 17. The concentrations did not decrease in FAV. In both groups, the concentrations increased (P < 0.01) on Day 10 (1 day after ablation) and decreased (P < 0.001) between Days 18 and 19 (2 days after last ablation).
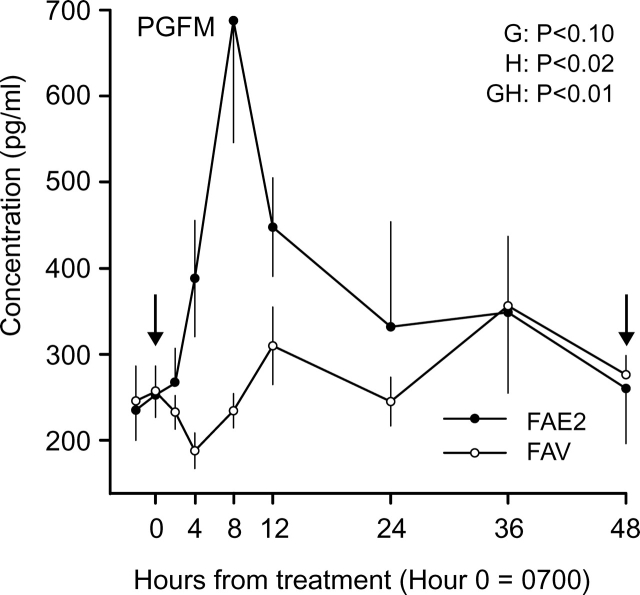
For PGFM concentrations, the main effect of hour and interaction of group by hour were significant, but the main effect of group only approached significance (Fig. 6). The interaction reflected greater (P < 0.002) concentrations in FAE2 than in FAV between Hours 4 and 24 after E2 treatment. In FAE2, the mean PGFM concentration first increased (P < 0.04) at Hour 4, reached a peak at Hour 8, and decreased (P < 0.04) by Hour 24, followed by a plateau.
FIG. 6.
Mean (±SEM) concentrations of PGFM during luteolysis in heifers in which all follicles ≥4 mm were ablated every day from Day 9 to Day 17. Heifers were assigned to receive two i.m. injections of 1.0 mg of estradiol benzoate diluted in sesame oil on Day 13 and Day 15 (FAE2) or the equivalent volume of vehicle (sesame oil; FAV). Main effects of group (G), hour (H), and their interaction (GH) are shown. The arrows indicate the time of E2 treatment.
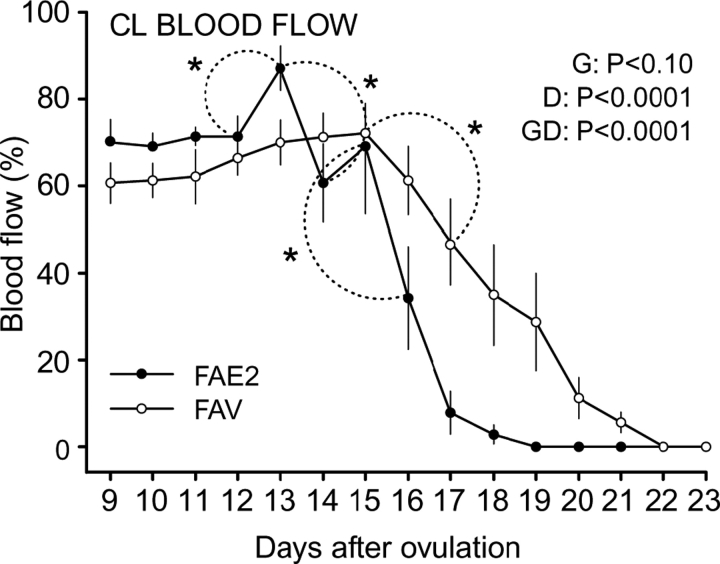
For CL blood flow, the day effect and interaction were significant, and the group effect approached significance (Fig. 7). The interaction was due to increased (P < 0.005) and greater (P < 0.01) blood flow on Day 13 and an earlier decrease (P < 0.01) between Days 13 and 14 in FAE2, with a subsequent decline between Days 15 and 16 that reached minimal values on Day 18. The FAV group had a significant decline in CL blood flow by Day 17, with minimal values by Day 22 (Fig. 7).
FIG. 7.
Mean (±SEM) changes in CL blood flow (percent of CL area) as determined by color Doppler ultrasonography during luteolysis in heifers in which all follicles ≥4 mm were ablated every day from Day 9 to Day 17. Heifers were assigned to receive two i.m. injections of 1.0 mg of estradiol benzoate diluted in sesame oil on Day 13 and Day 15 (FAE2) or the equivalent volume of vehicle (sesame oil; FAV). Main effects of group (G), day (D), and their interaction (GD) are shown. An asterisk (*) indicates differences among means within a group.
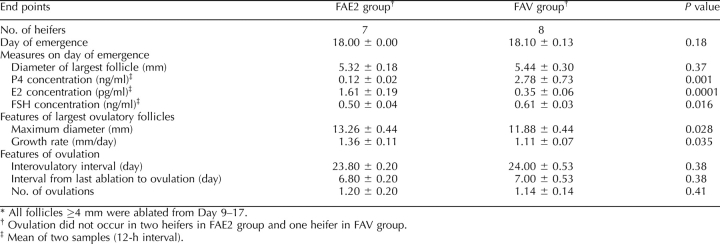
The day of emergence and the diameter of the largest follicle on the day of emergence (Table 3) did not differ (P > 0.10) between treatment groups. However, concentrations of P4, E2, and FSH on the day of emergence differed (P < 0.02) between groups because of lower (P < 0.02) P4 and FSH and greater (P < 0.0001) E2 concentrations in FAE2 than in FAV. No differences (P > 0.10) were observed for interovulatory interval, interval from emergence to ovulation, or number of ovulations among groups (Table 3). However, the maximum diameter of the largest ovulatory follicle was greater (P < 0.03) for FAE2 than for FAV, likely reflecting the greater (P < 0.04) growth rate of the largest ovulatory follicle observed for FAE2.
TABLE 3.
Effects (mean ± SEM) of repeated follicular ablations on circulating P4, E2, and FSH, and various follicular measures in heifers during experiment 2.*
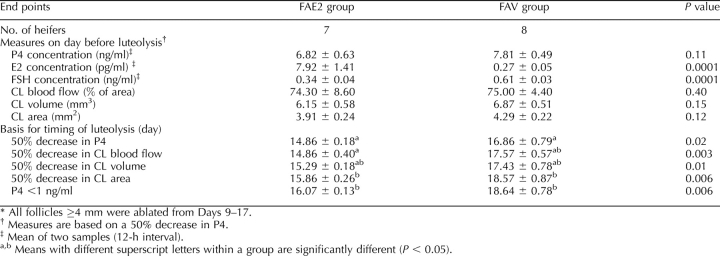
The key analyses related to luteolysis in experiment 2 are summarized in Table 4. On the day prior to luteolysis (based on a 50% decrease in P4), the concentrations of P4 and the CL measurements (blood flow, volume, and area) did not differ between groups. Concentration of E2 was higher and FSH lower for FAE2 than for FAV. Day of luteolysis (Table 4) differed between groups for each end point, with luteolysis occurring ≥2 days earlier in FAE2 than in FAV for each of the characteristics of luteolysis. There were differences in the day of luteolysis among the methods used for measuring luteolysis. Day of luteolysis was similar when based on a 50% decrease in P4, CL blood flow, or CL volume, but it was 2 days later when based on CL area and P4 <1 ng/ml.
TABLE 4.
Effects (mean ± SEM) of repeated follicular ablations on timing of luteolysis and hormonal and luteal characteristics on the day before luteolysis in heifers during experiment 2, as measured by multiple methods.*
DISCUSSION
The functional communication between the uterus and ovary has been investigated and demonstrated at multiple stages of the reproductive cycle. One of the most intriguing aspects of this relationship is the critical role of the uterus in regression of the CL in nonpregnant animals. In many species, including ruminant species, PGF is the critical uterine factor that determines the timing of CL regression, and therefore it is the primary determinant of cycle length. In the present study, we provide compelling evidence that the ovary, through secretion of follicular E2, is an important regulator of the timing of uterine PGF secretion, and therefore luteolysis. These studies used a follicle-ablation approach that has been extensively used in previous experiments to evaluate the relationships between follicle dynamics and concentrations of circulating hormones [44–47]. This procedure was effective in our studies, as demonstrated by lower circulating E2 concentrations that were similar to concentrations in ovariectomized cows [12], a consistent elevation in FSH concentrations for as long as follicle ablations continued, and a delay in the increase in E2 concentrations and peak E2 until after follicle ablation was discontinued. The first experiment provided clear evidence that ablation of follicles decreased circulating E2 and delayed the timing of luteolysis, both functional and structural. Multiple structural and functional measures of luteolysis were used in this study, and each indicated a later time of luteolysis when ovarian follicles ≥4 mm were eliminated. In the second experiment, reintroduction of E2 in the follicle-ablated animals caused an earlier increase in PGF secretion (as indicated by circulating PGFM) and eliminated the delay in luteolysis. However, the concentration of E2 achieved by the 1-mg estradiol benzoate treatment clearly exceeded the normal circulating concentrations that were present at this time in the follicle-intact animals (experiment 1). Doses of 0.1 mg or less of estradiol benzoate would be needed in future experiments to mimic the exceedingly low physiological concentrations present near the time of follicle deviation. This study used the classical approach of ablation of an endocrine gland with subsequent hormone replacement to demonstrate that ovarian follicles, and specifically E2 secretion by ovarian follicles, is critical for timing of uterine PGF secretion and subsequent luteolysis. Thus, the study used a novel approach and multiple measures of luteolysis to provide data that follicular E2 does control the timing of luteolysis, consistent with most [17, 21–24, 48] but not all [8, 49–51] previous studies in this area.
On the basis of our results and other published results [5–7, 52], a physiological model is proposed for the timing of luteolysis in ruminants (Fig. 8). Pulses of oxytocin arise from pulsatile release of oxytocin from the posterior pituitary gland, and during luteolysis these pulses are amplified by oxytocin from the CL. Following acquisition of oxytocin receptors in the luminal epithelium of the endometrium, secretion of PGF is stimulated by these pulses of oxytocin after binding of oxytocin to the oxytocin receptor [5, 52, 53]. The acquisition of responsiveness to oxytocin by the endometrial epithelium appears to depend on a coordinated action of P4 and E2 and their respective receptors [54–57]. During early and mid luteal phases, E2 receptor expression is suppressed in the endometrium, presumably by an inhibitory action of increasing P4 concentrations [8, 57]. However, this has been questioned in one study using cattle [51]. During the late luteal phase, E2 receptors in the uterus increase after the decrease in uterine P4 receptors and/or decreased uterine P4 sensitivity [10, 51], in part because of E2 upregulating the expression of its own receptor in endometrial cells [58–60]. In addition, stimulation of uterine E2 receptor by circulating/follicular E2 stimulates synthesis of oxytocin receptors in the endometrium, with subsequent oxytocin-induced secretion of PGF from the uterus [5, 11, 12]. Oxytocin receptors in the uterus are synthesized in the presence of circulating E2 after P4 receptor downregulation, which occurs after P4 exposure of 12 days in cows or 10–12 days in sheep [51, 61–64]. Priming by P4 is required for PGF secretion in response to E2 [64, 65].
FIG. 8.
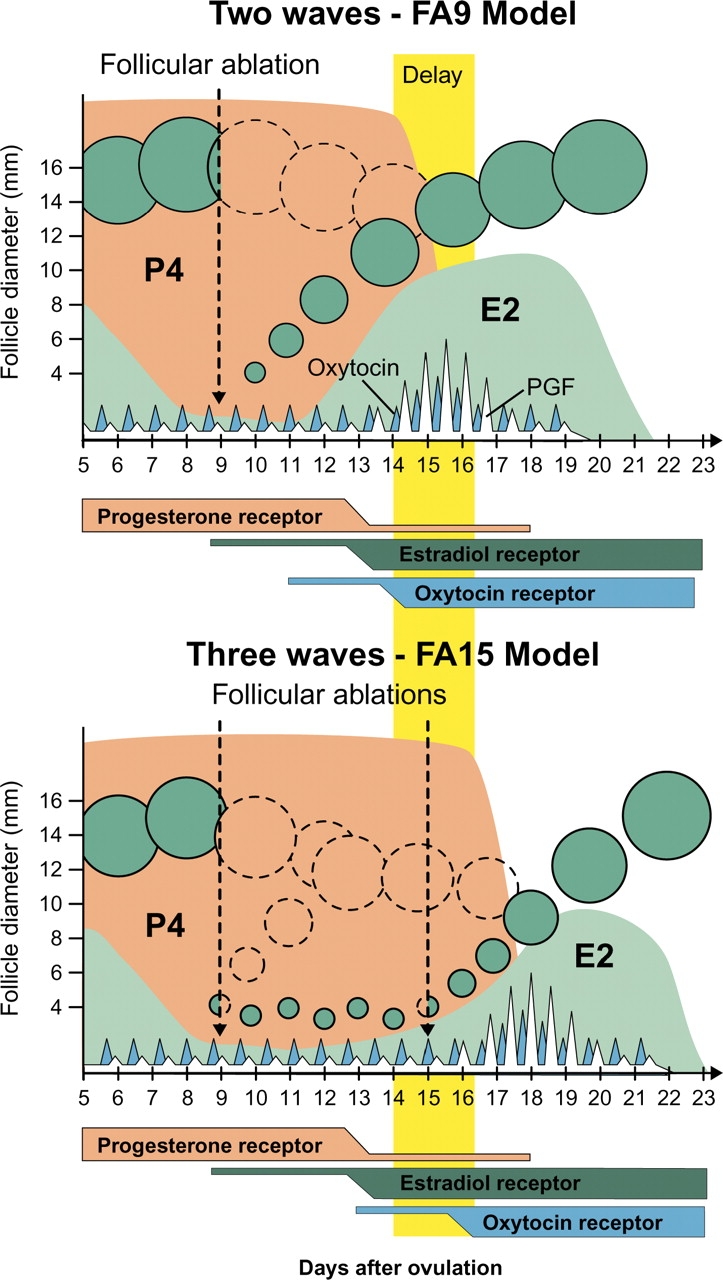
Simplified model to explain the physiology regulating the timing of luteolysis based on the results of the present study and other relevant studies (see Discussion).
Evidence for the role of follicular E2, as proposed in this model, is provided by the results of this study and from previous results [17]. For example, concentrations of E2 were higher in FA9 than FA15 on the day before luteolysis. It is hypothesized that heifers in the FA9 group already had sufficient circulating E2 prior to initiation of luteolysis, but that the rate-limiting step in these heifers was the acquisition of E2 receptors in the uterus. In contrast, later luteolysis in FA15 and FA21 heifers would be postulated to occur because of later E2 activation of E2 receptors, and not because of later acquisition of uterine E2 receptors. Thus, the timing of upregulation of oxytocin receptors and subsequent oxytocin-induced PGF secretion would be postulated to be regulated either by timing of E2 receptor upregulation (FA9; circulating E2 present prior to E2 receptor) or by timing of follicular E2 secretion (FA15 and FA21; E2 receptor present prior to circulating E2). A delay in either of these events could delay PGF secretion and luteolysis, resulting in a longer luteal phase. Similarly, Salfen et al. [17] reported that delaying the subsequent follicular wave by treatment with steroid-stripped follicular fluid resulted in delayed luteolysis; however, the authors did not show any delay in E2 secretion, as was shown in the present study. Thus, the results of multiple studies are consistent with this physiological model. However, key aspects of this model, particularly the timing of uterine E2 and oxytocin receptors in the absence of follicular E2, and the precise temporal relationship between acquisition of these receptors, increases in circulating E2, and uterine PGF secretion need to be tested. In addition, previous results with high doses of exogenous E2 indicate that E2 may induce PGF secretion at earlier times in the cycle (Day 9–10 in ewes; [26]) suggesting that uterine E2 responsiveness may be a relative value and not a categorical shift from an unresponsive to a responsive state.
This simplified model does not address the role of intraluteal PGF production and intraluteal E2 action in the luteolytic process (for review, see Niswender et al. [66]). Indeed, PGF secretion from ruminant luteal cells is well documented [67], and E2 appears to enhance the luteolytic effects of low doses of PGF in hysterectomized ewes with ovarian follicles removed by x-irradiation [68]. Thus, the initiation of luteolysis is clearly dependent on uterine PGF secretion, which relies on follicular E2 as described in this model; however, intraluteal mechanisms must clearly be considered in more complete models of luteolysis, including the possible intraluteal actions of E2 and intraluteal production of PGF.
The model and the results of this study provide a rational basis for explaining the occurrence of luteolysis 2 or 3 days earlier in cows with two versus three follicular waves during an estrous cycle [3, 43, 69–71]. Additionally, emergence of the second follicular wave occurs earlier in cows with three waves versus two waves during the estrous cycle (Days 8–9 versus Days 10–12 [3, 18, 72–74]). The FA9 animals in experiment 1 might be compared to cows with two follicular wave cycles because they had similarities in emergence of the second follicular wave (on Day 10), length of the interovulatory interval, interval from emergence to ovulation, as well as growth rate and diameter of the largest ovulatory follicle [3, 43, 73]. Conversely, heifers in FA15 had emergence of the new follicular wave on Day 16, similarly to heifers with three follicular waves during a spontaneous estrous cycle (emergence of third wave on Day 16 [18, 43]). In addition, FA15 animals were similar to heifers with three follicular waves in length of the interovulatory interval, interval from emergence to ovulation, as well as growth rate and diameter of the preovulatory follicle [3, 18, 43, 73]. For both groups (FA9 and FA15), concentrations of P4 were high (≥6.90 ng/ml) on day of emergence of the follicular wave. Thus, the hypothesis proposed by McCracken et al. [74] that E2 binding to its receptors in the endometrium initiates a chain of events that culminates in luteolysis is supported, because E2 increased as the follicular wave was allowed to emerge and subsequently was followed by the initiation of luteolysis.
The model also predicts that the later increase in circulating E2 associated with emergence of a new wave in animals with three follicular waves (FA15) than in animals with two follicular waves (FA9) was responsible for delaying luteolysis. Authors of earlier studies suggested that the time of luteolysis relative to the time of emergence of the second wave might determine whether cycles would have two or three waves of follicular development [2, 3, 69]. The results of the present studies support the opposite interpretation. The correspondence between the timing of an E2-active dominant follicle and the responsiveness of the uterus to follicular E2 seems to be the major determinant of luteal phase length. Thus, if the second-wave dominant follicle loses dominance and E2 secretion prior to acquisition of uterine E2 responsiveness, then luteolysis would be delayed until the increase in E2 secretion from the third-wave dominant follicle, similar to our results in FA15. Thus, we postulate that there are two independent events that must occur for initiation of luteolysis to occur. First, there must be E2 responsiveness in the uterus; second, there must be sufficient circulating E2 to activate a uterine E2 response. In heifers with two follicular waves, high E2 (from the second-wave dominant follicle) is already present at the time uterine E2 responsiveness is acquired; therefore, timing of luteolysis is set by the time of acquisition of sufficient uterine E2 responsiveness. In contrast, cows with three follicular waves have loss of E2 secretion from the second follicular wave prior to acquisition of uterine E2 responsiveness; therefore, the timing of luteolysis is delayed, not because of delays in acquisition of E2 responsiveness but because of a delay in sufficient circulating E2 until the third-wave dominant follicle produces sufficient E2 to activate the luteolytic cascade. In addition, previous researchers have suggested that serum E2 concentrations achieved by the second-wave dominant follicles in animals with three follicular waves, as well as the timing of E2 production, may be insufficient to trigger the luteolytic cascade [17]. Thus, the factors (genetic, environmental, nutritional, age, etc.) that determine the timing of emergence and duration of the first and second follicular waves would determine whether a third follicular wave emerges prior to acquisition of sufficient uterine E2 responsiveness (approximately Days 14–15 after ovulation), and therefore would be the key determinants of the timing of luteolysis.
One puzzling observation in our study was the lack of a more extensive delay of luteolysis in the FA21 group. The various designators of luteolysis began at Days 18–20 in this group, even though follicle ablations continued until Day 21. In a simple mechanistic model in which follicular E2 had complete control of timing of uterine PGF and luteolysis, we would not have expected a delay of luteolysis until after the end of follicular ablations and the subsequent rise in circulating E2. There are multiple possible explanations for this result that cannot be distinguished clearly based on our experimental results. One potential explanation is that follicular E2 regulates uterine PGF secretion only until a certain stage of the luteal phase (i.e., Days 18–19 in our experiment). After this critical stage, activation of the uterine E2 receptor by E2 is not needed to initiate the process of luteolysis. In other words, uterine PGF secretion and luteolysis will proceed independently of E2 after a certain stage of uterine differentiation. This is consistent with the finding that follicular destruction extended luteal function but did not prevent later luteal regression in cattle [23, 24] and sheep [22, 48]. Thus, these results support the view that E2 might be a permissive but not an absolute requirement for luteolysis in cows. An alternative explanation is that the follicular ablation technique did not provide complete removal of circulating E2, and a low level of E2, possibly combined with increasing uterine responsiveness to E2, allowed initiation of uterine PGF pulses and luteolysis during continued follicular ablation. This explanation seems plausible, given that some follicular cells may remain after follicular ablation, and extremely elevated FSH concentrations may drive low but physiologically relevant E2 production from remaining follicular cells or smaller follicles. The first statistically significant increase in circulating E2 did not occur until Day 22 in the FA21 group, but earlier small elevations in E2 may have been sufficient to trigger luteolysis. Alternative explanations for luteolysis in this group include mechanical effects of multiple follicle ablations and initiation of intraluteal PGF production or other intraluteal regulators of luteolysis independently of uterine PGF secretion. Further research will be required to differentiate these contrasting explanations for the lack of an indefinite delay in luteolysis during follicular ablation.
Multiple measures of luteolysis were used in this study, generally based on a 50% decrease from maximum values. Previous studies on the follicle-luteolysis relationship based the timing of luteolysis on weight of CL [22, 23, 26], circulating P4 concentrations [23, 25], or cumulative P4 concentration [17]. None of these previous studies definitely demonstrated the relationship of follicular growth and secretion of follicular E2 in regulating the timing of luteolysis. In the present study, the use and comparison of different measurements of the timing of luteolysis have added novel information and should aid in comparing previous and future studies on luteolysis. Luteolysis based on a 50% decrease in P4 concentration occurred at the numerically earliest time for all treatment groups, but this was not significantly different from the time of luteolysis calculated from a 50% decrease in CL volume or luteal blood flow. Consistent with previously published reports [29, 75, 76], the 50% decrease in P4 was ∼2 days earlier than the 50% decline in CL area. It appears that CL volume more closely corresponds to luteal P4 production and functional luteolysis, probably because the CL area is based solely on a linear measurement of diameter, whereas CL volume is calculated using radius to the third power and better corresponds to the total functional luteal tissue. The decline in circulating P4 to less than 1 ng/ml was generally very similar to timing of luteolysis based on CL area.
The relationship of luteal blood flow to luteolysis and P4 concentration in cattle and horses has been reported previously based on color Doppler ultrasonography [4, 77–79]. In the present study, an acute increase in luteal blood flow was observed in association with the treatment with exogenous E2. This acute increase in luteal blood flow corresponded to the increase in uterine PGF secretion following E2 treatment. A transient increase in luteal blood flow has been reported to occur in close association with individual PGFM pulses during spontaneous luteolysis [4] and during PGF-induced luteolysis [4, 77, 78]. In the FAE2 group, the transient increase in luteal blood flow was temporally associated with the beginning of the progressive decrease in circulating P4 corresponding to luteolysis. The acute increase in blood flow was not observed in experiment 1 or in the FAV group of experiment 2. The decrease in blood flow during luteolysis was observed in all groups. The spontaneous PGFM pulses during natural luteolysis can occur at variable times during the day, and this may make it difficult to detect the transient stimulation of luteal blood flow occurring during luteolysis [4]. Other spectral Doppler end points (resistance indices and relative blood flow velocities) were also measured in this experiment (data not shown), and these indices also indicated a decrease in vascular resistance (increased luteal blood flow) associated with E2 treatment. There was also an earlier increase in vascular resistance (decreased luteal blood flow) and decreased blood velocity in FAE2 compared with FAV, consistent with expected changes during luteolysis in FAE2 and prolonged lifespan of the CL in FAV. Thus, the use of multiple structural and functional measures of luteolysis, particularly using color Doppler ultrasonography, allowed a valid determination of the follicle-luteolysis relationship in the present experiment and may provide information that will be useful in comparing different measures of luteolysis in other studies.
In conclusion, the present study provided evidence that follicular estradiol is an important regulator of the timing of uterine PGF secretion in cattle. A physiological model based on these results provides a plausible explanation for the differences in timing of luteolysis in heifers between cycles with two versus three follicular waves. Additionally, the multiple structural and functional measures of luteolysis provided comparative and standardized criteria for future studies on luteolysis that use ultrasonographic evaluations of the CL.
Acknowledgments
The authors thank W.W. Thatcher, University of Florida, for a gift of PGFM antiserum and advice on PGFM assay.
Footnotes
1Supported by National Institutes of Health grant HD-50616 and the Eutheria Foundation.
REFERENCES
- Wishart DF.Observations on the estrous cycle of the Friesian heifer. Vet Rec 1972; 90: 595–597. [DOI] [PubMed] [Google Scholar]
- Sirois J, Fortune J.Ovarian follicular dynamics during the estrous cycle in heifers monitored by real-time ultrasonography. Biol Reprod 1988; 39: 308–317. [DOI] [PubMed] [Google Scholar]
- Ginther OJ, Knopf L, Kastelic JP.Temporal associations among ovarian events in cattle during oestrous cycles with two and three follicular waves. J Reprod Fertil 1989; 87: 223–230. [DOI] [PubMed] [Google Scholar]
- Ginther OJ, Silva LA, Araújo RR, Beg MA.Temporal associations among pulses of 13,14-dihydro-15-keto-PGF2alpha, luteal blood flow, and luteolysis in cattle. Biol Reprod 2007; 76: 506–513. [DOI] [PubMed] [Google Scholar]
- Silvia WJ, Lewis GS, McCracken JA, Thatcher WW, Wilson JR.Hormonal regulation of uterine secretion of prostaglandin F2alpha during luteolysis in ruminants. Biol Reprod 1991; 45: 655–663. [DOI] [PubMed] [Google Scholar]
- Arosh JA, Banu SK, Chapdelaine P, Madore E, Sirois J, Fortier MA.Prostaglandin biosynthesis, transport, and signaling in corpus luteum: a basis for autoregulation of luteal function. Endocrinology 2004; 145: 2551–2560. [DOI] [PubMed] [Google Scholar]
- Weems CW, Weems YS, Randel RD.Prostaglandins and reproduction in female farm animals. Vet J 2006; 171: 206–228. [DOI] [PubMed] [Google Scholar]
- Wathes DC, Hamon M.Localization of oestradiol, P4 and oxytocin receptors in the uterus during the oestrus cycle and early pregnancy of the ewe. J Endocrinol 1993; 138: 479–491. [DOI] [PubMed] [Google Scholar]
- Ivell R, Fuchs AR, Bathgate R, Tillmann G, Kimura T.Regulation of oxytocin receptor in bovine reproductive tissues and the role of steroids. Reprod Domest Anim 2000; 35: 134–141. [Google Scholar]
- Meyer HDD, Mittermeier TH, Schams D.Dynamics of oxytocin, estrogen and progestin receptors in the bovine endometrium during the estrous cycle. Acta Endocrinol (Copenh) 1988; 118: 96–104. [DOI] [PubMed] [Google Scholar]
- Flint APF, Sheldrick EL.Continuous infusion of oxytocin prevents induction of uterine oxytocin receptor and blocks luteal regression in cyclic ewes. J Reprod Fertil 1985; 75: 623–631. [DOI] [PubMed] [Google Scholar]
- Mann GE, Payne JH, Lamming GE.Hormonal regulation of oxytocin-induced prostaglandin F2alpha secretion by the bovine and ovine uterus in vivo. Domest Anim Endocrinol 2001; 21: 127–141. [DOI] [PubMed] [Google Scholar]
- Mann GE, Lamming GE.Use of repeated biopsies to monitor endometrial oxytocin receptors in the cow. Vet Rec 1994; 135: 403–405. [DOI] [PubMed] [Google Scholar]
- Robinson RS, Mann GE, Lamming GE, Wathes DC.The effect of pregnancy on the expression of uterine oxytocin, oestrogen and progesterone receptors during early pregnancy in the cow. J Endocrinol 1999; 160: 21–33. [DOI] [PubMed] [Google Scholar]
- Thatcher WW, Guzeloglu A, Mattos R, Binelli M, Hansen TR, Pru JK.Uterine-conceptus interactions and reproductive failure in cattle. Theriogenology 2001; 56: 1435–1450. [DOI] [PubMed] [Google Scholar]
- Granstrom E, Kindahl H.Radioimmunoassays for prostaglandins metabolites. Samuelsson B, Paoletti R.Advances in Prostaglandin and Tromboxanes Research New York:Reven Press;1976: 81–92. [PubMed] [Google Scholar]
- Salfen BE, Cresswell JR, Xu ZZ, Bao B, Garverick HA.Effects of the presence of a dominant follicle and exogenous oestradiol on the duration of the luteal phase of the bovine oestrus cycle. J Reprod Fertil 1999; 115: 15–21. [DOI] [PubMed] [Google Scholar]
- Kulick LJ, Kot K, Wiltbank MC, Ginther OJ.Follicular and hormonal dynamics during the first follicular waves in heifers. Theriogenology 1999; 52: 913–921. [DOI] [PubMed] [Google Scholar]
- Beg MA, Ginther OJ.Follicle selection in cattle and horses: role of intrafollicular factors. Reproduction 2006; 132: 365–377. [DOI] [PubMed] [Google Scholar]
- Pierson RA, Ginther OJ.Ultrasonography of the bovine ovary. Theriogenology 1984; 21: 495–504. [DOI] [PubMed] [Google Scholar]
- Ginther OJ.Response of corpora lutea to cauterization of follicles in sheep. Am J Vet Res 1971; 32: 59–62. [PubMed] [Google Scholar]
- Karsch FJ, Noveroske JW, Roche JF, Norton HW, Nalbandov AV.Maintenance of ovine corpora lutea in the absence of ovarian follicles. Endocrinology 1970; 87: 1228–1236. [DOI] [PubMed] [Google Scholar]
- Villa-Godoy A, Ireland JJ, Wortman JA, Ames NK, Hughes TL, Fogwell RL.Effect of ovarian follicles on luteal regression in heifers. J Anim Sci 1985; 60: 519–527. [DOI] [PubMed] [Google Scholar]
- Fogwell RL, Cowley JL, Wortman JA, Ames NK, Ireland JJ.Luteal function in cows following destruction of ovarian follicles at midcycle. Theriogenology 1985; 23: 389–398. [DOI] [PubMed] [Google Scholar]
- Hughes TL, Villa-Godoy A, Kesner JS, Fogwell RL.Destruction of bovine ovarian follicles: effects on the pulsatile release of luteinizing hormone and prostaglandin F2α-induced luteal regression. Biol Reprod 1987; 36: 523–529. [DOI] [PubMed] [Google Scholar]
- Ford SP, Weems CW, Pitts RE, Pexton JE, Butcher RL, Inskeep EK.Effect of estradiol 17-beta and progesterone on prostaglandins F in sheep uteri and uterine venous plasma. J Anim Sci 1975; 41: 1407–1413. [DOI] [PubMed] [Google Scholar]
- Knickerbocker JJ, Thatcher WW, Foster DB, Wolfenson D, Bartol FF, Caton D.Uterine prostaglandin and blood flow responses to estradiol 17 beta in cyclic cattle. Prostaglandins 1986; 31: 757–776. [DOI] [PubMed] [Google Scholar]
- Thatcher WW, Terqui M, Thimonier J, Mauleon P.Effect of estradiol 17 beta on peripheral plasma concentration of 15-keto-13,14-dihydro PGF2alpha and luteolysis in cyclic cattle. Prostaglandins 1986; 31: 745–756. [DOI] [PubMed] [Google Scholar]
- Ginther OJ.Ultrasonic Imaging and Animal Reproduction: Cattle, Book 3. Cross Plains, WI:Equiservices Publishing;1998: 46, 100 [Google Scholar]
- Ginther OJ. Ultrasonic Imaging and Animal Reproduction: Color-Doppler Ultrasonography, Book 4. Cross Plains, WI:: Equiservices Publishing;; 2007. [Google Scholar]
- Araujo RR, Ginther OJ.Vascular perfusion of reproductive organs in pony mares and heifers during sedation with detomidine or xylazine. Am J Vet Res 2009; 70: 141–148. [DOI] [PubMed] [Google Scholar]
- Ginther OJ, Gastal EL, Gastal MO, Beg MA.Effect of prostaglandin F2alpha on ovarian, adrenal, and pituitary hormones and on luteal blood flow in mares. Domest Anim Endocrinol 2007; 32: 315–328. [DOI] [PubMed] [Google Scholar]
- Ginther OJ, Gastal EL, Gastal MO, Utt MD, Beg MA.Luteal blood flow and progesterone production in mares. Anim Reprod Sci 2007; 99: 213–220. [DOI] [PubMed] [Google Scholar]
- Ginther OJ, Utt M.Doppler ultrasound in equine reproduction: principles, techniques, and potential. J Equine Vet Sci 2004; 24: 516–526. [Google Scholar]
- Bergfelt DR, Lightfoot KC, Adams GP.Ovarian synchronization following ultrasound-guided transvaginal follicle ablation in heifers. Theriogenology 1994; 42: 895–907. [DOI] [PubMed] [Google Scholar]
- Bodensteiner KJ, Kot K, Wiltbank MC, Ginther OJ.Synchronization of emergence of follicular waves in cattle. Theriogenology 1995; 45: 1115–1128. [DOI] [PubMed] [Google Scholar]
- Bergfelt DR, Kulick LJ, Kot K, Ginther OJ.Follicular and hormonal response to experimental suppression of FSH during follicle deviation in cattle. Theriogenology 2000; 54: 1191–1206. [DOI] [PubMed] [Google Scholar]
- Bolt DJ, Rollin R.Development and application of a radio-immunoassay for bovine follicle-stimulating hormone. J Anim Sci 1983; 56: 146–154. [DOI] [PubMed] [Google Scholar]
- Bolt DJ, Scott V, Kiracofe GH.Plasma LH and FSH after estradiol, norgestomet and GnRH treatment in ovariectomized beef heifers. Anim Reprod Sci 1990; 23: 263–271. [Google Scholar]
- Ginther OJ, Bergfelt DR, Kulick LJ, Kot K.Selection of the dominant follicle in cattle: estabilishment of follicle deviation in less than 8 hours through depression of FSH concentrations. Theriogenology 1999; 52: 1079–1093. [DOI] [PubMed] [Google Scholar]
- Meyer MD, Hansen PJ, Thatcher WW, Drost M, Badinga L, Roberts RM, Li J, Ott TL, Bazer FW.Extension of corpus luteum lifespan and reduction of uterine secretion of prostaglandin F2a of cows in response to recombinant interferon-s. J Dairy Sci 1995; 78: 1921–1931. [DOI] [PubMed] [Google Scholar]
- Mattos R, Staples CR, Arteche A, Wiltbank MC, Diaz FJ, Jenkins TC, Thatcher WW.The effect of feeding fish oil on uterine secretion of PGF2a, milk composition, and metabolic status of periparturient Holstein cows. J Dairy Sci 2004; 87: 921–932. [DOI] [PubMed] [Google Scholar]
- Sartori R, Haughuan JM, Shaver RD, Rosa GJM, Wiltbank MC.Comparison of ovarian function and circulating steroids in estrus cycles of Holstein heifers and lactating cows. J Dairy Sci 2004; 87: 905–920. [DOI] [PubMed] [Google Scholar]
- Adams GP, Kot K, Smith CA, Ginther OJ.Effect of the dominant follicle on regression of its subordinates. Can J Anim Sci 1993; 73: 267–275. [Google Scholar]
- Adams GP.Control of ovarian follicular wave dynamics in cattle: implications for synchronization and superstimulation. Theriogenology 1994; 41: 19–24. [Google Scholar]
- Gibbons JR, Wiltbank MC, Ginther OJ.Functional interrelationships between follicles greater than 4 mm and the follicle-stimulating hormone surge in heifers. Biol Reprod 1997; 57: 1066–1073. [DOI] [PubMed] [Google Scholar]
- Gibbons JR, Wiltbank MC, Ginther OJ.Relationship between follicular development and the decline in the follicle-stimulation hormone surge in heifers. Biol Reprod 1999; 60: 72–77. [DOI] [PubMed] [Google Scholar]
- Zhang J, Weston PG, Hixon JE.Influence of estradiol on the secretion of oxytocin and prostaglandin F2α during luteolysis in ewe. Biol Reprod 1991; 45: 395–403. [DOI] [PubMed] [Google Scholar]
- Asselin E, Drolet P, Fortier MA.In vitro response to oxytocin and interferon-Tau in bovine endometrial cells from caruncular and inter-caruncular areas. Biol Reprod 1998; 59: 241–247. [DOI] [PubMed] [Google Scholar]
- Xiao CW, Liu WJM, Sirois J, Goff AK.Regulation of cyclooxigenase-2 and prostaglandin F synthase gene expression by steroid hormones and interferon-τ in bovine epithelial cells. Endocrinology 1998; 139: 2293–2299. [DOI] [PubMed] [Google Scholar]
- Robinson RS, Mann GE, Lamming GE, Wathes DC.Expression of oxytocin, oestradiol and progesterone receptors in uterine biopsy samples throughout the oestrus cycle and early pregnancy in cows. Reproduction 2001; 122: 965–979. [PubMed] [Google Scholar]
- McCracken JA, Custer EE, Lamsa JC.Luteolysis: a neuroendocrine-mediated event. Physiol Rev 1999; 79: 263–323. [DOI] [PubMed] [Google Scholar]
- Hixon J, Flint APF.Effects of a luteolytic dose of oestradiol benzoate on uterine oxytocin receptor concentrations, phosphoinositide turnover and prostaglandin F-2α secretion in sheep. J Reprod Fertil 1987; 79: 457–467. [DOI] [PubMed] [Google Scholar]
- Vallet JL, Lamming GE, Batten M.Control of endometrial oxytocin receptor and uterine response to oxytocin by progesterone and oestradiol in the ewe. J Reprod Fertil 1990; 90: 625–634. [DOI] [PubMed] [Google Scholar]
- Wathes DC, Mann GE, Payne JH, Riley PR, Stevenson KR, Lamming GE.Regulation of oxytocin, oestradiol and progesterone receptor concentrations in different uterine regions by oestradiol, progesterone and oxytocin in ovariectomized ewes. J Endocrinol 1996; 151: 375–393. [DOI] [PubMed] [Google Scholar]
- Lefrance M, Goff AK.Effects of progesterone and estradiol 17-β on oxytocin-induced release of prostaglandin F2. J Reprod Fertil 1988; 82: 429–436. [DOI] [PubMed] [Google Scholar]
- Spencer TE, Bazer FW.Temporal and special alterations in uterine estrogen receptor and progesterone receptor gene expression during the estrous cycle and early pregnancy in the ewe. Biol Reprod 1995; 53: 1527–1543. [DOI] [PubMed] [Google Scholar]
- Spencer TE, Mirando MA, Mayes JS, Watson GH, Ott TL, Bazer FW.Effects of interferon-tau and progesterone on oestrogen-stimulated expression of receptors for oestrogen, progesterone and oxytocin in the endometrium of ovariectomized ewes. Reprod Fertil Dev 1996; 8: 843–853. [DOI] [PubMed] [Google Scholar]
- Ing NH, Tornesi MB.Estradiol up-regulates estrogen receptor and progesterone receptor gene expression in specific ovine uterine cells. Biol Reprod 1997; 56: 1205–1215. [DOI] [PubMed] [Google Scholar]
- Xiao C, Goff AK.Hormonal regulation of estrogen and progesterone receptors in cultured bovine endometrial cells. J Reprod Fertil 1999; 115: 101–109. [DOI] [PubMed] [Google Scholar]
- Bray AR, Hecker JF.Role of progesterone in regulating the length of the oestrous cycle in sheep. J Reprod Fertil 1976; 46: 522–523. [DOI] [PubMed] [Google Scholar]
- Vallet JL, Lamming GE.Ovine conceptus secretory proteins and bovine recombinant interferon α1-1 decrease endometrial oxytocin receptor concentrations in cyclic and progesterone-treated ovariectomized ewes. J Endocrinol 1991; 131: 475–482. [DOI] [PubMed] [Google Scholar]
- Bear AP, Lamming GE.Oestradiol concentration and the development of the oxytocin receptor and oxytocin induced prostaglandin F2α release in ewe. J Reprod Fertil 1994; 100: 469–475. [DOI] [PubMed] [Google Scholar]
- Lamming GE, Mann GE.Control of endometrial oxytocin receptors and prostaglandin F2α production in cows by progesterone and oestradiol. J Reprod Fertil 1995; 103: 69–73. [DOI] [PubMed] [Google Scholar]
- Machado R, Bergamaschi MA, Barbosa RT, de Oliveira CA, Binelli M.Ovarian function in Nelore (Bos taurus indicus) cows after post-ovulation hormonal treatments. Theriogenology 2008; 69: 798–804. [DOI] [PubMed] [Google Scholar]
- Niswender GD, Davis TL, Griffith RJ, Bogan RL, Monser K, Bott RC, Bruemmer JE, Nett TM.Judge, jury and executioner: the auto-regulation of luteal function. Soc Reprod Fertil Suppl 2007; 64: 191–206. [DOI] [PubMed] [Google Scholar]
- Milvae RA, Hansel W.Prostacyclin, prostaglandin F2α and progesterone production by bovine luteal cells during the estrous cycle. Biol Reprod 1983; 29: 1063–1068. [DOI] [PubMed] [Google Scholar]
- Gengenbach DR, Hixon JE, Hansel W.A luteolytic interaction between estradiol and prostaglandin F2α in hysterectomized ewes. Biol Reprod 1977; 16: 571–579. [DOI] [PubMed] [Google Scholar]
- Fortune JE.Follicular dynamics during the bovine estrous cycle: a limiting factor in improvement fertility? Anim Reprod Sci 1993; 33: 111–125. [Google Scholar]
- Gong JG, Bramley TA, Webb R.The effect of recombinant bovine somatotropin on ovarian follicular growth and development in heifers. J Reprod Fertil 1993; 97: 247–254. [DOI] [PubMed] [Google Scholar]
- Ahmad N, Townsend RA, Dailey RA, Inskeep EK.Relationships of hormonal patterns and fertility to occurrence of two or three waves of ovarian follicles, before and after breeding, in beef cows and heifers. Anim Reprod Sci 1997; 49: 13–28. [DOI] [PubMed] [Google Scholar]
- Kastelic JP, Ginther OJ.Factors affecting the origin of the ovulatory follicle in heifers with induced luteolysis. Anim Reprod Sci 1991; 26: 13–24. [Google Scholar]
- Noseir WMB.Ovarian follicular activity and hormonal profile during estrous cycle in cows: the development of 2 versus 3 waves. Reprod Biol Endocrinol 2003; 1: 50 [DOI] [PMC free article] [PubMed] [Google Scholar]
- McCracken JA, Schramm W, Okulicz WC.Hormone receptor control of pulsatile secretion of PGF2α from the ovine uterus during luteolysis and its abrogation in early pregnancy. Anim Reprod Sci 1984; 7: 31–55. [Google Scholar]
- Gutierrez AC, Zarco L, Galina CS, Rubio I, Basurto H.Predictive value of palpation per rectum for detection of the CL in Zebu cattle as evaluated by progesterone concentrations and ultrasonography. Theriogenology 1996; 46: 471–479. [DOI] [PubMed] [Google Scholar]
- Ribadu AY, Ward WR, Dobson H.Comparative evaluation of ovarian structures in cattle by palpation per rectum, ultrasonography and plasma progesterone concentrations. Vet Rec 1994; 135: 452–457. [DOI] [PubMed] [Google Scholar]
- Acosta TJ, Yoshizawa N, Ohtani M, Miyamoto A.Local changes in blood flow within the early and midcycle corpus luteum after prostaglandin F2α injection in the cow. Biol Reprod 2002; 66: 651–658. [DOI] [PubMed] [Google Scholar]
- Acosta TJ, Miyamoto A.Vascular control of ovarian function: ovulation, corpus luteum formation and regression. Anim Reprod Sci 2004; 82–83: 127–140. [DOI] [PubMed] [Google Scholar]
- Ginther OJ, Rodrigues BL, Ferreira JC, Araujo RR, Beg MA.Characterization of pulses of 13, 14-dihydro-15-keto-PGF2alpha (PGFM) and relationships between PGFM pulses and luteal blood flow before, during, and after luteolysis in mares. Reprod Fertil Dev 2008; 20: 684–693. [DOI] [PubMed] [Google Scholar]


