

Abstract
GLT1 is the major glutamate transporter of the brain and has been thought to be expressed exclusively in astrocytes. Although excitatory axon terminals take up glutamate, the transporter responsible has not been identified. GLT1 is expressed in at least two forms varying in the C termini, GLT1a and GLT1b. GLT1 mRNA has been demonstrated in neurons, without associated protein. Recently, evidence has been presented, using specific C terminus-directed antibodies, that GLT1b protein is expressed in neurons in vivo. These data suggested that the GLT1 mRNA detected in neurons encodes GLT1b and also that GLT1b might be the elusive presynaptic transporter. To test these hypotheses, we used variant-specific probes directed to the 3′-untranslated regions for GLT1a and GLT1b to perform in situ hybridization in the hippocampus. Contrary to expectation, GLT1a mRNA was the more abundant form. To investigate further the expression of GLT1 in neurons in the hippocampus, antibodies raised against the C terminus of GLT1a and against the N terminus of GLT1, found to be specific by testing in GLT1 knock-out mice, were used for light microscopic and EM-ICC. GLT1a protein was detected in neurons, in 14–29% of axons in the hippocampus, depending on the region. Many of the labeled axons formed axo-spinous, asymmetric, and, thus, excitatory synapses. Labeling also occurred in some spines and dendrites. The antibody against the N terminus of GLT1 also produced labeling of neuronal processes. Thus, the originally cloned form of GLT1, GLT1a, is expressed as protein in neurons in the mature hippocampus and may contribute significantly to glutamate uptake into excitatory terminals.
Keywords: uptake, trafficking, alternative splicing, excitotoxicity, PDZ domain, synapse
Introduction
Every synapse requires a mechanism for the rapid clearance of transmitter from the synaptic cleft and restoration of transmitter in the presynaptic terminal. Excitatory synapses use glutamate transporters to accomplish these functions in addition to protecting neurons from excitotoxicity (Mangano and Schwarcz, 1983; Rosenberg et al., 1992; Tanaka et al., 1997). Ultrastructural data, derived from serial reconstruction of the hippocampal neuropil, suggest that large numbers of excitatory synapses in the hippocampus may rely on glutamate uptake across neuronal membranes to regulate extracellular glutamate concentration (Ventura and Harris, 1999) and maintain input specificity (Rusakov and Kullmann, 1998). The presynaptic terminal is an obvious site for the operation of glutamate transporters. However, although excitatory amino acid uptake into presynaptic terminals has been demonstrated repeatedly over more than two decades (Divac et al., 1977; Storm-Mathisen and Iversen, 1979; Storm-Mathisen and Wold, 1981; Taxt and Storm-Mathisen, 1984; Gundersen et al., 1993, 1996), the molecular basis of glutamate uptake into the nerve terminal has remained elusive and cannot be accounted for by the expression of the known neuronal glutamate transporter EAAC1 (for review, see Danbolt, 2001). The absence of identified molecular glutamate transporters at excitatory terminals has hindered progress in understanding the possible physiological and pathophysiological roles of glutamate transporters at excitatory synapses.
Following the original cloning of GLT1 (Pines et al., 1992), GLT1 protein was found to be localized exclusively in astrocytes in the normal mature brain (Danbolt et al., 1992; Hees et al., 1992; Levy et al., 1993; Rothstein et al., 1994; Chaudhry et al., 1995; Lehre et al., 1995; Schmitt et al., 1996; Berger and Hediger, 2000; Danbolt, 2001). Subsequently, several variant forms were cloned from mouse liver (Utsunomiya-Tate et al., 1997), and one of these variants, differing from the originally cloned form only in the C terminus, was discovered in a cDNA library derived from rat embryonic neurons in culture (Chen et al., 2002), designated GLT1b, and from the retina (Schmitt et al., 2002), designated GLT1v. Using electron microscopic immunocytochemistry (EM-ICC) and a peptide-specific antibody, evidence has been obtained that GLT1b is expressed in neurons as well as in astrocytes in vivo (Chen et al., 2002). Schmitt et al. (2002), using a different antibody against the same variant form, provided LM immunocytochemical (LM-ICC) evidence for the expression of this protein in neurons in vivo as well. In contrast, Reye et al. (2002c), also using a GLT1b-specific antibody and light microscopy, found that GLT1b was abundantly expressed but exclusively in glia. Precedent for the normal expression of GLT1 protein in neurons in vivo has come from studies of the retina (Rauen and Kanner, 1994; Euler and Wassle, 1995; Rauen et al., 1996). In addition, under pathological circumstances, GLT1 has been demonstrated in neurons, such as after hypoxia (Martin et al., 1997) and opiate withdrawal (Xu et al., 2003).
GLT1 mRNA has been found by several groups to be expressed in neurons in the mature brain, most prominently in the CA3 region of the hippocampus (Schmitt et al., 1996; Torp et al., 1997; Berger and Hediger, 1998), but without associated expression of the protein (Danbolt, 2001). The motivation for the present study was to retest the hypothesis that GLT1 occurs in neurons and to determine whether the dominant form is GLT1a or GLT1b. In situ hybridization was performed using variant-specific riboprobes for GLT1a and GLT1b mRNA to determine the identity of the GLT1 mRNA expressed in hippocampal neurons, followed by the use of antibodies for the detection of protein by light and EM-ICC.
Materials and Methods
In situ hybridization on rat brain sections. Sprague Dawley rats were anesthetized with an intraperitoneal injection of pentobarbital (50–100 mg/kg) and then killed by decapitation. Single nonisotopic in situ hybridization was performed using digoxigenin-labeled cRNA probes and alkaline phosphatase (AP) detection for observation with bright-field optics, and double in situ hybridization was performed using digoxigenin-labeled probes and AP detection for the first mRNA and fluorescein-labeled probes, followed by several amplification steps and ultimately detection with the CY3 fluorophore for observation with fluorescence optics for the second mRNA. This double in situ procedure, described in detail previously (Berger and Hediger, 1998), has the advantage that the fluorescent signal reflecting GLT1 expression in astrocytes can be selectively quenched using the AP reaction product generated from a cohybridized probe for the astrocytic glutamate transporter GLAST, thereby rendering the signals in neurons more distinct. Briefly, cryostat sections of fresh frozen brain were cut at 10 μm thickness, fixed in 4% paraformaldehyde, and acetylated. Hybridization was performed in slide mailers by total immersion in hybridization buffer that contained 50% formamide, 5× SSC, 2% blocking reagent (Roche Applied Science, Indianapolis, IN), 0.02% SDS, 0.1% sarcosine, and ∼100 ng/ml cRNA probe. Sections were hybridized at 68°C over 72 hr with the full-length rat GLT1 probe (pan-GLT1 probe) (1.8 kb) or with specific 3′-untranslated region (UTR) probes for GLT1a (289 b) or GLT1b (391 b). For double in situ hybridization, a 2 kb digoxigenin-labeled GLAST probe was coincubated with each of the FITC-labeled GLT1 probes. Washing steps included incubations in 2× SSC and 0.2× SSC at 68°C.
For single-label hybridization, sections were incubated at room temperature in 1% blocking reagent in maleic acid buffer, then in AP-conjugated anti-digoxigenin Fab fragments (1:5000 dilution; Roche Applied Science), and developed overnight with 5-bromo-4-chloro-3-indolyl phosphate (BCIP)/nitroblue tetrazolium (NBT) substrate (Kierkegard and Perry Laboratories, Gaithersburg, MD). For double-label in situ hybridizations, sections were first blocked with avidin and biotin (Vector Laboratories, Burlingame, CA) before subsequent incubations in: (1) 1% blocking reagent; (2) AP-conjugated anti-digoxigenin Fab fragments (1:5000) and mouse anti-FITC antibodies (1:500; Roche Applied Science); (3) biotinylated anti-mouse antibodies (1:500); (4) streptavidin–HRP; (5) biotinylated tyramide (tyramide signal amplification reaction; Perkin-Elmer, Boston, MA); (6) BCIP/NBT (overnight); and (7) streptavidin–CY3. Sections were rinsed several times in 100 mm Tris, 150 mm NaCl, 20 mm EDTA, pH 9.5, and coverslipped with glycerol gelatin (Sigma, St. Louis, MO). Control sections were incubated in an identical concentration of the sense probe transcript. Photographs were taken using a Nikon E600 microscope and a SPOT digital camera.
Polyclonal antibodies. Three different antibodies were used in this project. Polyclonal antibodies against the C-terminal peptide NH2-ECKVPFPFLDIETCI-COOH, corresponding to the last 15 amino acids (aa 548–562) of rat GLT1b, and the N-terminal peptide NH2-MASTEGANNMPKQVE-COOH (aa 1–15 of rat GLT1) were generated in New Zealand White rabbits (Research Genetics, Huntsville, AL) and characterized previously using rat brain tissue, rat forebrain neurons in culture, and COS7 cells expressing rat GLT1a and GLT1b cDNA (Chen et al., 2002). For the antibody against GLT1b, three different chemistries, gluteraldehyde, carbodiimide, and maleimide, were used to link the peptide to KLH. For the antibody directed against the N terminus, multiple antigen peptide was used, in which eight copies of the peptide are synthesized and attached through the C terminus directly to an eight-branch lysine core, yielding a peptide that is large enough to inject by itself, requiring no postsynthetic conjugation (Posnett et al., 1988; Tam, 1988). The antisera were affinity purified using peptide-binding columns in which peptides were bound to Sepharose beads through the primary N-terminal amine.
The polyclonal antibody against the C terminus of rat GLT1a protein (anti-cGLT1a antibody) based on the published sequence (aa 559–573 of GLT1) was generously provided by Dr. Jeff Rothstein (Johns Hopkins University, Baltimore, MD) and has been characterized previously with respect to its specificity against rat GLT1 (Rothstein et al., 1994; Chen et al., 2002).
Testing antibody specificity using immunoblot analysis on brain lysates from GLT1 knock-out mice. GLT1 knock-out mice were produced by replacing the putative third transmembrane segment (exon 4) with the neomycin resistance gene (Tanaka et al., 1997). Heterozygous animals were bred to obtain homozygous, wild-type, and heterozygous animals. Genomic DNA was isolated from tails (DNAeasy kit; Qiagen, Valencia, CA). After the extraction, 1.2 μg of genomic DNA was used in the PCR to amplify the gene segments encoding exon 4 or the neomycin gene sequence. Primers corresponding to exon 4 sequence (5′ primer 344–363; 3′ primer 569–587) (GenBank accession number NM011393) or neomycin resistance gene sequence (5′ primer 883–902; 3′ primer 1205–1224) (pMC1neo poly A vector; Stratagene, La Jolla, CA) were used (0.25 μm). Primer extension was performed with 2.5 U of Immolase DNA polymerase (Bioline, Randolph, MA) in a final volume of 50 μl. Denaturing, annealing, and extension steps were performed at 95°C for 1 min, at 60°C for 1 min, and at 72°C for 1 min for 30 cycles in a thermocycler (PTC-100; MJ Research, Waltham, MA). The PCR products were then run on a 1% agarose gel and stained with ethidium bromide.
Freshly dissected mouse brain tissue from 9-d-old mice was homogenized using Pasteur pipet trituration in homogenization buffer containing 5 mm MgCl2, 5 mm EGTA, 50 mm KCl, and 1% SDS, followed by dispersion in an ultrasonic bath for ∼30 min until the solution became clear. The homogenate was stored at –20°C. The protein concentration was determined using the DC Protein Assay kit (Bio-Rad, Hercules, CA). Aliquots of brain homogenate were mixed with SDS-Sample buffer (Boston BioProducts, Ashland, MA), separated on 8% SDS polyacrylamide gels (10 μg of protein per lane), and then transferred to polyvinylidene fluoride membranes (PerkinElmer Life Sciences, Boston, MA) by electroblotting. Blots were incubated with primary antibodies (anti-cGLT1a at 14 ng/ml, anti-cGLT1b at 0.32 μg/ml, and anti-nGLT1 at 1 μg/ml) overnight at 4°C in 5% nonfat milk, 100 mm Tris, pH 7.5, 306 mm NaCl, and 0.01% Tween 20 and then washed three times with Tris–NaCl–Tween buffer, incubated for 1 hr with HRP-conjugated goat anti-rabbit IgG (Amersham Life Science, Piscataway, NJ) at 1:2500 dilution and washed again. Immunoreactive proteins were detected by ECL (Western Lightning Chemiluminescence Reagent; PerkinElmer Life Sciences). The blots were then stained with Ponceau S to verify equal loading of protein.
Light and electron microscopic immunocytochemistry on tissue sections. Four adult Sprague Dawley rats were processed to examine antigenic sites reacting with each anti-GLT1 antibody using LM and EM visualization.
Animals were anesthetized deeply, using pentobarbital (50–100 mg/kg), then perfused transcardially with 4% paraformaldehyde using 0.1 m phosphate buffer (PB; 10.9 gm of dibasic sodium salt and 3.2 gm of monobasic sodium salt per 1 liter of water). Glutaraldehyde was not added to the perfusate, because pilot studies showed diminished immunoreactivity of axons in its presence. After transcardial fixation, brains were postfixed in 4% paraformaldehyde for 1 week. Brains were sectioned using a vibratome. All sections were prepared at a thickness of 40 μm.
Peroxidase-based labeling followed the procedure of Hsu et al. (1981), using the ABC Elite kit (Vector Laboratories) and 0.02% of DAB (Sigma-Aldrich) and 0.03% of hydrogen peroxide (Sigma) as substrates. Primary antisera were diluted 1:500 for anti-cGLT1a (710 ng/ml) and anti-cGLT1b (3.2 μg/ml) and 1:200 (1.5 μg/ml) for anti-nGLT1. Vibratome sections were incubated overnight at room temperature or at 4°C.
The above immunocytochemical procedure was assessed for specificity by incubating sections simultaneously with 50 μm of the antigen peptide and the anti-GLT1 antibody.
Tissue processing for electron microscopy was done as described previously (Chan et al., 1990; Aoki et al., 2000), using EMBED812 or Epon-Spurr (Electron Microscopy Sciences, Fort Washington, PA) as the embedding medium. However, two modifications were made. One was to omit the use of lead citrate as the counterstain, to avoid obscuring the immunolabels over postsynaptic densities (PSDs). The other was to lengthen the fixation of vibratome-cut tissue in uranyl acetate (4%, in 70% ethanol) from 30 min to a minimum of 24 hr, to enhance preservation of the ultrastructure. This step occurred subsequent to immunocytochemistry, to avoid loss of antigenicity.
Ultrastructural analyses focused on the hippocampal formation but also included the neocortex. Ultrathin sections were prepared tangential to the razor blade-cut surface of sections created before immunocytochemistry using the vibratome. The vibratome makes sections by causing the razor blade to vibrate while making slow strokes through tissue. As a result, the tissue surface is irregular, with waves that are one to a few micrometers high. The sections are 40 μm thick, but, actually, they are 40 plus or minus the height of the waves created on the surface by the vibratome. When such corrugated surfaces are approached tangentially by a diamond knife, one first encounters the peaks of waves, which appear as stripes or triangular waves, depending on how perfectly tangential is the approach. As one continues to make sections at this tangential angle, then one eventually sees the entire section, without the interruption of the troughs. Thus, under the electron microscope, the surface created with the vibratome could be easily found as the wavy interface between tissue and resin. For the ultrastructural analysis, our sampling aimed to stay as near as possible to this vibratome surface, because this would be the zone that received maximal exposure to the immunoreagents. From each tissue source, of which there were two for GLT1a and two for nGLT, a minimum of 3025 μm2 of neuropil was sampled strictly from the resin/tissue interface for quantitative analysis. Light microscopy revealed intense staining in all layers of the hippocampal formation, except the pyramidal cell layer for the CA1–CA3 fields and the granule cell layer of the dentate gyrus (DG). Thus, all dendritic layers of the hippocampal formation were included in the sampling.
Axons were identified by the presence of a minimum of three small, uniformly sized vesicles. Included in this designation were axon terminals, identified based on the presence of synaptic specializations, and axons of passage, identified based on the presence of a minimum of three vesicles but no synaptic specializations. The two types of axonal profiles were not quantified separately. Dendritic shafts were identified by the presence of parallel arrays of microtubules and mitochondria. Spines were identified by the presence of thick PSDs and absence of mitochondria or microtubules. Astrocytic processes were identified by the irregular, convex contours of the plasma membrane. The presence of intermediate filament bundles and absence of regularly spaced microtubules helped to verify these as astrocytic but was not a requirement for their identification. Synaptic specializations were recognized by the parallel alignment of the dendritic and axonal plasma membranes and by the association of electron dense material along the cytoplasmic surface of either or both plasma membranes.
The total number of labeled profiles encountered were 1393 for the anti-cGLT1a antibody-1abeled profiles and 1096 for the anti-nGLT1 antibody-labeled profiles. These profiles were found in a minimum of 10 electron micrographs per region of the hippocampus for each antibody tested. The number of profiles identifiable as astrocyte, axon, spine or shaft per micrograph was normalized to the total number of morphologically identifiable immunolabeled profiles in that micrograph. In addition, for each micrograph, the percentage of labeled axons, among all axons encountered, was determined. The mean and SD of percentage values obtained from the samples contained in micrographs were determined for each region of the hippocampus. Student's t test was performed to determine statistical significance of the difference between the spine and axon labeling within each region. ANOVA was performed to determine whether the fraction of axons immunolabeled by each antibody was different across the three fields of the hippocampus. This was followed by use of the Tukey–Kramer post hoc test for multiple comparisons.
Testing antibody specificity using immunocytochemistry on brain sections from GLT1 knock-out mice. For LM-ICC and EM-ICC analysis of GLT1 knock-out mice and wild-type littermate controls, animals from the same litter were perfusion fixed using 4% paraformaldehyde in PB and postfixed for 7 d in 4% paraformaldehyde. Young animals [postnatal day(P) 7–P10] were used because of the lethality of the GLT1–/–mutation. Losses of –/–animals from litters began at approximately P10. Genotyping was performed on tails removed before fixation. Identical methods to those described above were used for LM-ICC and EM-ICC on plastic embedded sections from GLT1+/+ and GLT1–/–hippocampi.
Results
Double-label in situ hybridization to discriminate expression of mRNA for GLT1a and GLT1b in the rat hippocampus
GLT1 mRNA has been found previously in neurons in the mature brain. GLT1 protein, however, had been found only in astrocytes (Danbolt, 2001), until the recent demonstration of GLT1b in neurons (Chen et al., 2002; Schmitt et al., 2002). These results suggested that the mRNA for GLT1 in neurons encodes predominantly, if not exclusively, GLT1b. Because GLT1a and GLT1b have different 3′-UTRs (Chen et al., 2002; Schmitt et al., 2002), it was possible to test this hypothesis using variant-specific 3′-UTR-directed probes to detect GLT1a and GLT1b mRNAs by in situ hybridization.
We used single- and double-label in situ hybridization with riboprobes to the 3′-UTR regions of GLT1a and GLT1b and compared the results with those obtained with a probe made from the GLT1 coding region and that recognizes all forms (pan-GLT1 probe). The probe for GLT1a was directed against nucleotides 1008–1296 (GenBank accession number AY069978). The probe for GLT1b was directed against nucleotides 1137–1527 (GenBank accession number AF451299). There was no significant homology between the probes for GLT1a and GLT1b. Northern blot analysis of total RNA using these GLT1a and GLT1b probes has been published previously (Chen et al., 2002).
The examination of neuronal expression of GLT1 isoforms focused on the hippocampus because CA3 pyramidal neurons have previously been shown to contain the highest concentrations of GLT1 message in neurons in the brain (Berger and Hediger, 1998), and because these neurons are tightly arranged in the pyramidal cell layer, facilitating identification of cell types. Figure 1, A, D, and E, shows GLT1 mRNA expression in hippocampus using the pan-GLT1 probe and AP detection. GLT1 was found to be strongly expressed in CA3 neurons (Fig. 1E), whereas CA1 neurons were unlabeled (Fig. 1D), in agreement with previous studies (Torp et al., 1994; Schmitt et al., 1996, 2002). Figure 1, B, F, G and C, H, I, shows the AP labeling for GLT1a and GLT1b, respectively, in adjacent sections. The neuronal labeling by the GLT1a probe in the CA3 region is clearly visible (Fig. 1B,G). Because of the smaller probe length (289 b for GLT1a and 391 b for GLT1b), as opposed to 1.8 kb for the pan-GLT1 probe, the labeling with the variant-specific probes is expected to be less intense, even if detecting the same amount of mRNA. In contrast to the results with GLT1a, the GLT1b probe produced weak labeling in the pyramidal layer in the hippocampus (Fig. 1C,H,I). A gradient of labeling from CA3 (Fig. 1I) to CA1 (Fig. 1H) was not clearly discernible. This result suggests that the GLT1b mRNA is expressed in the CA3 region at lower levels than GLT1a mRNA. Both GLT1a and GLT1b are also expressed in astrocytes throughout the hippocampal formation.
Figure 1.

In situ hybridization analysis of the distribution of mRNAs for full-length GLT1, GLT1a, and GLT1b in the hippocampus. GLT1 mRNA was labeled in hippocampus using probes covering the full-length GLT1 coding sequence (pan-GLT1 probe) (A, D, E, J, M, N) or specific stretches of the 3′-UTR sequence of GLT1a (B, F, G, K, O, P) and GLT1b (C, H, I, L, Q, R). The top two rows (A–I) illustrate single in situ hybridization labeling obtained with AP detection. The bottom two rows (J–R) show double hybridized sections in which the fluorescent labeling of astrocytic mRNA is blocked or attenuated, because of quenching by the AP reaction product associated with a GLAST probe. The second (D–I) and fourth (M–R) rows show magnified views of the CA1 (left panel; D, F, H, M, O, Q) and CA3 (right panel; E, G, I, N, P, R) subfields of the hippocampi shown in the row above, as outlined by the boxes shown in A. A, D, E, The pan-GLT1 probe produces prominent neuronal labeling for GLT1 in pyramidal cell neurons in the CA3 (E) subfield but not in CA1 (D). Astrocytes throughout the hippocampus and dentate gyrus are also labeled. B, F, G, GLT1a labeling shows a similar pattern of neuronal labeling, although at reduced intensity. Astrocytic labeling is present but reduced compared with that in A. C, H, I, GLT1b labeling is prominent in astrocytes throughout the hippocampus. CA3 neurons are not clearly labeled (I). J, M, N, Fluorescent labeling using the pan-GLT1 probe highlights the strong labeling of CA3 neurons (J, N). Astrocytic labeling in the CA1 region (M) is blocked by the AP deposit produced by the cohybridized GLAST probe, which only labels astrocytes. K, O, P, Strong GLT1a fluorescent labeling in CA3 neurons (K, P) but not in CA1 neurons (O). L, Q, R, The differential double-in situ technique reveals weak, but distinct, GLT1b fluorescent labeling in the CA3 region (R and arrows in L) but not in CA1(Q). Note that the photographic exposure time was longer for L, Q, and R compared with J, K, and M-P because of the much weaker signal obtained with the GLT1b probe. The lower signal/noise ratio with the GLT1b probe is evident based on the more apparent background labeling in L, Q, and R. The labeling by the GLT1b probe is locally very restricted, because of the low abundance of the message and the amplification technique that gains sensitivity at the expense of resolution. The area of apparent labeling under the arrow shafts in L is attributable to a bubble under the section. These findings demonstrate that the GLT1a isoform is expressed in CA3 neurons. The GLT1b transcript is weakly expressed in the CA3 region. The transcript for GLT1a appears to be predominant in neurons. Bars: L, 500 μm; R, 100 μm.
Figure 1, J–R, shows the results for the double-label in situ analysis using fluorescence detection for full-length GLT1 and for GLT1a and GLT1b probes. Each section was cohybridized with a probe for the astrocyte transporter GLAST (Storck et al., 1992; Rothstein et al., 1994; Berger and Hediger, 1998). The GLAST probe was detected with AP, which produces a dark precipitate within astrocytes, resulting in complete or partial quenching of the fluorescent signal associated with GLT1 in astrocytes, thereby facilitating the visualization of GLT1 expression in neurons. Using this technique, we found a strong signal in CA3 neurons both with the pan-GLT1 probe and with the GLT1a probe (Fig. 1, J,N and K,P, respectively). In both cases, little or no definite labeling was observed in CA1 (Fig. 1M,O). Using the same technique, we found a relatively weak, but clear, signal in the CA3 neurons for GLT1b [Fig. 1L (arrows), R; note that automatic photographic exposure was used, and the photographic exposure time was longer for Fig. 1, L, Q, and R than for J, K, and M–P]. GLT1b had a gradient of neuronal expression in the hippocampus similar to that of GLT1a: no labeling by the GLT1b probe was found in the pyramidal layer in the CA1 region (Fig. 1Q). However, the labeling with the GLT1b probe in the CA3 region (Fig. 1L,R), in contrast to GLT1a or pan-GLT1, did not clearly outline the cytoplasm of the neurons and was very locally restricted. This restricted labeling is a likely result of the low mRNA levels present and the amplification technique used that increases the sensitivity at the expense of resolution.
To discern whether GLT1b mRNA is indeed localized to the neuronal cytoplasm, another set of experiments was performed (Fig. 2). Sections were hybridized with the digoxigenin-labeled GLT1b probe and counterstained with the nuclear marker 4′,6-diamidino-2-phenylindole (DAPI). GLAST labeling with DAPI was used as a control. In Figure 2, the AP labeling for GLT1b and GLAST is shown simultaneously with the DAPI nuclear labeling. At a low magnification, GLT1b labeling is very faint, if not absent, in the CA1 pyramidal neurons (Fig. 2A, arrows), but it is clearly present in the CA3 pyramidal cell layer (Fig. 2B, arrows). In contrast, the GLAST probe, which strongly labels the astrocytes, does not label the neurons in either CA1 or CA3 areas (Fig. 2C,D). At a higher magnification, shown in Figure 2, E–H, the cell nuclei are clearly delineated by the DAPI staining, and it becomes apparent that the GLT1b label in the CA3 neurons is restricted to a small rim surrounding the cell nucleus (Fig. 2F, arrows). This GLT1b neuronal labeling is not present in the CA1 area (Fig. 2E). Also, the GLAST probe does not produce a similar neuronal labeling in either CA1 or CA3 (Fig. 2G,H). There are occasional strongly labeled GLAST profiles interspersed in the pyramidal layer; however, these profiles likely represent astrocyte dendrites that surround the pyramidal neurons. These results indicate that both GLT1a and GLT1b are expressed in hippocampal neurons and that GLT1a is the predominant form, contrary to expectation, based on previous results that showed that neurons contain GLT1 mRNA but not GLT1a protein (Danbolt, 2001) and recent evidence of GLT1b protein expression in neurons (Chen et al., 2002; Schmitt et al., 2002). The absence of labeling of CA1 neurons by either probe serves as an internal control demonstrating the specificity of the detection of GLT1b and GLT1a using the 3′-UTR probes and the techniques that we have used. In addition, no labeling was observed with sense probes.
Figure 2.

High magnification analysis of the GLT1b labeling in CA3 neurons with DAPI nuclear counterstaining. Sections processed for GLT1b (A, B, E, F) and GLAST (C, D, G, H) AP labeling were coincubated with the nuclear counterstain DAPI to visualize the neuronal nuclei. The pictures show the AP labeling simultaneously with the fluorescent DAPI staining. At low magnification, no GLT1b labeling is present in the CA1 neurons (A, arrows), but a faint labeling can be discerned in CA3 neurons (B, arrows). In contrast, the GLAST labeling is restricted to astrocytes and is not present in CA1 or CA3 neurons (C, D), suggesting the GLT1b labeling in the CA3 neurons is specific. At high magnification, it becomes apparent that the GLT1b labeling is localized to a small rim of cytoplasm surrounding the nucleus in CA3 neurons (F, arrows) and that the GLT1b message is not present in CA1 neurons (E). Similarly, the GLAST message is not present in the CA1 or CA3 neurons (G, H). The GLAST profiles labeled within the pyramidal cell layer are astrocyte processes that surround the neurons. Bars: D, 100 μm; H, 10 μm.
Analysis of the specificity of the anti-GLT1 antibodies using the GLT1 knock-out mouse
The fact the GLT1a mRNA is the predominant GLT1 mRNA in the hippocampus led us to reexamine the expression of GLT1 protein in the brain, again focusing on the hippocampus. Before embarking on the immunocytochemical analysis, we considered the specificity of the antibodies that we intended to use.
All the antibodies used in this study were affinity purified with the peptides used to produce them and were found to be specific for the antigenic peptides. Both in tissue and in immunoblots, immunoreactivity could be blocked by coincubation with antigenic peptide. The anti-cGLT1a antibody used here is the same antibody used in previous studies that showed expression of GLT1 protein exclusively in astrocytes (Rothstein et al., 1994). Immunolabeling of rat brain tissue by this antibody (Rothstein et al., 1994), as well as by the antibody against the N terminus shared by GLT1a and GLT1b, and against the C terminus of GLT1b, has been shown to be blocked by the peptides against which they were raised (Rothstein et al., 1994; Chen et al., 2002). However, establishing peptide blockade of immunolabeling for an antibody does not exclude the possibility that the antibody recognizes similar peptide sequences on other proteins unrelated to the protein of interest. To critically test the specificity of the anti-GLT1 antibodies used in this study, they were tested in immunoblot and immunocytochemical experiments on GLT1 knock-out mice that were reported to express normal amounts of GLT1 mRNA but no protein (Tanaka et al., 1997).
Heterozygote animals (+/–) were bred, and the offspring were genotyped by PCR (Fig. 3A). Using fresh brain obtained from homozygous and heterozygous GLT1 knock-out mice (P9), as well as their wild-type littermates, we first tested the anti-GLT1 antibodies using immunoblot analysis (Fig. 3). As has been reported (Tanaka et al., 1997), no GLT1 protein was detected by immunoblot on homozygous GLT1 knock-out brain tissue. This was the case using any of the three antibodies employed in the present study. A band with an apparent mass of 66 kDa as well as bands representing multimers were present in immunoblots on tissue from the wild-type littermates. In the tissue from heterozygote animals, the density of labeling of the bands corresponding to GLT1 was clearly reduced. In addition, no other bands were detectable in immunoblots of lysates from knock-out animals using anti-cGLT1a and anti-cGLT1b antibodies. Two weak low molecular mass bands were present in immunoblots of knock-out lysates, as well as lysates from wild-type and heterozygote animals using the anti-nGLT1 antibody. Equal density of loading was demonstrated by Ponceau S staining of the immunoblot membrane (Fig. 3C).
Figure 3.
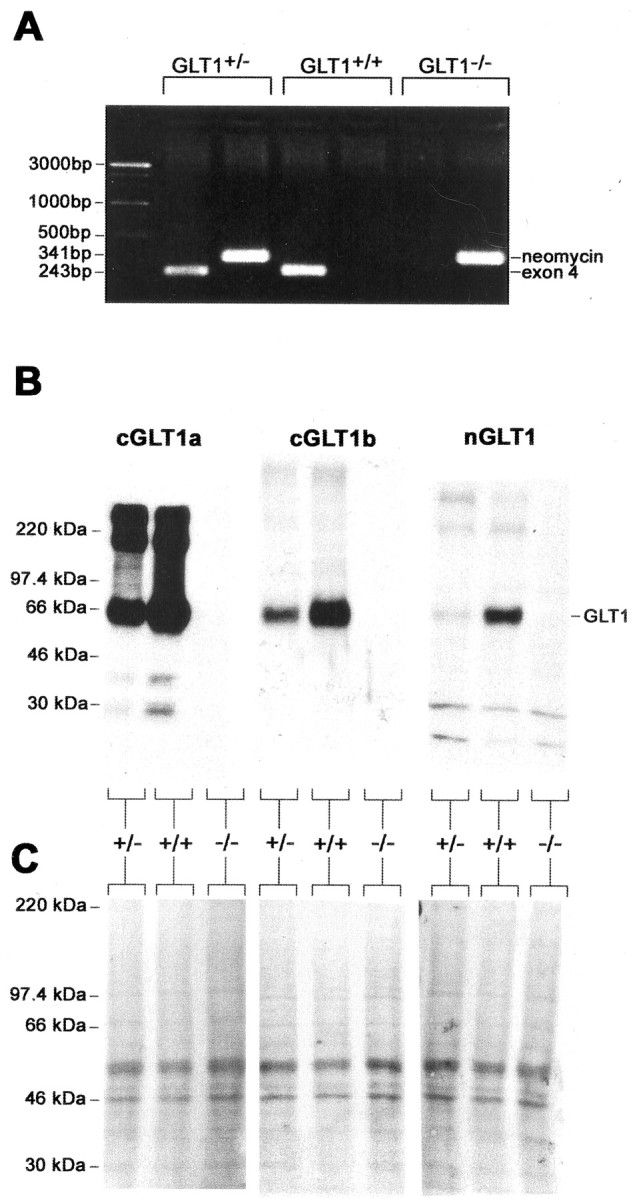
Comparison of anti-cGLT1a antibody immunoreactivity in immunoblot assay of brain lysates from littermates of a GLT1+/– × GLT1+/– mating. A, Characterization of genotypes was achieved by amplification of the cDNAs encoding for exon 4 and the neomycin resistance gene sequence using PCR. The PCR products were run on a 1% agarose gel and stained with ethidium bromide. The 243 bp band indicates the presence of the wild-type exon 4 sequence, whereas the 341-bp band indicates the presence of the neomycin resistance gene sequence that replaces the exon 4 sequence in the GLT1 knock-out mouse. B, Immunoreactivity of the anti-cGLT1a, anti-cGLT1b, and anti-nGLT1 antibodies in brain lysates was completely abolished in the GLT1 knock-out mouse. Brain lysates were subjected to SDS-PAGE, immunoblotted, and detected with the anti-cGLT1a, anti-cGLT1b, and anti-nGLT1 antibodies. C, Equal loading of proteins on the blots was verified by staining of membrane with Ponceau S. GLT1+/+, Wild-type GLT1 mouse; GLT1+/–, heterozygote GLT1 mouse; GLT1–/–, homozygote GLT1 knock-out mouse.
As an additional test of the specificity of the anti-GLT1 antibodies used in this study, we compared the immunoreactivity of the antibodies on brain sections from perfusion-fixed, P7 wild-type mice and GLT1 knock-out littermates using LM immunocytochemistry (Fig. 4).
Figure 4.

Comparison of immunoreactivity of anti-cGLT1a and anti-nGLT1 antibodies in the hippocampus of wild-type and GLT1–/– knock-out mice at P7 LM visualization of GLT1 immunoreactivity in the CA3 region of the hippocampus of wild-type and GLT1 knock-out mice. A–D show micrographs taken from tissue stained using the anti-cGLT1a antibody, whereas E–H show tissue stained using the anti-nGLT1 antibody. A, C, E, and G show micrographs taken at a magnification of 10× (calibration, 200 μm). Strata of the hippocampus: o, stratum oriens; p, stratum pyramidale; r, stratum radiatum; the dashed lines indicate the transition of the strata. Details of the boxed portion are shown in adjacent panels using micrographs taken at a magnification of 40× (calibration, 50 μm).
At the lower magnification, cGLT1a immunoreactivity appeared relatively more dense in the synaptic layers, stratum oriens (o), and stratum radiatum (r) than in stratum pyramidale (p) (Fig. 4A). At a higher magnification, it became evident that the faint labeling in the pyramidal layer was diffuse, whereas the labeling in the synaptic layers was associated with processes that appeared astrocytic (Fig. 4B). Immunoreactivity in all layers was greatly reduced in the hippocampal formation of knock-outs (Fig. 4C), although weak labeling of a few astrocytes in the stratum radiatum could be detected (Fig. 4D).
A view of nGLT1 immunoreactivity at a lower magnification showed a labeled band in the mouse stratum pyramidale (Fig. 4E) that persisted in knock-outs (Fig. 4G). This labeling of the stratum pyramidale with anti-nGLT1 antibody was not observed in the rat (Fig. 5D,E). At a higher magnification, it was evident that labeling in the stratum pyramidale of wild-type tissue was diffuse, whereas labeling in the synaptic neuropil of wild-type tissue was highly concentrated in puncta and processes, some of which appeared distinctly astrocytic (Fig. 4F). Within knock-outs, the labeling in both the synaptic and perikaryal layers was weak and diffuse (Fig. 4H).
Figure 5.
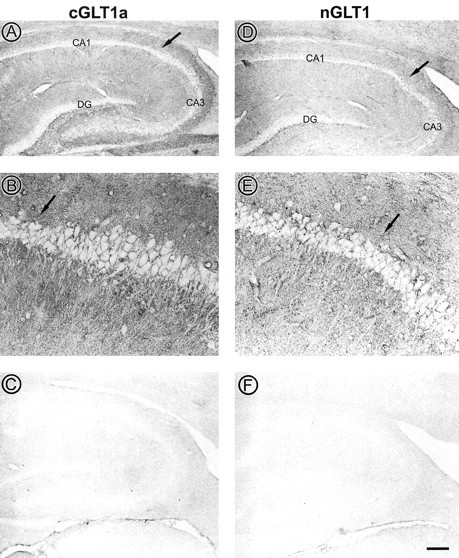
LM visualization of GLT1 immunoreactivity within the adult rat hippocampus. The two columns of panels show immunoreactivity of the anti-cGLT1a- and nGLT1 antibodies, respectively, using HRP–DAB as labels. The light micrographs shown in A, C, D, and F were taken at a magnification of 10×. The large arrows point to the CA1/CA3 transition. Within the two fields of both anti-cGLT1a and anti-nGLT1-stained tissue, the unlabeled band coincides with the pyramidal cell layer. The granule cell layer in the dentate gyrus also is minimally immunoreactive. Viewing of the CA1/CA3 transition at a higher magnification of 40× (B, E, middle) reveals absence of labeling within perikarya and apical dendrites of these pyramidal neurons but, additionally, small puncta distributed throughout the neuropil dorsal and ventral to the cell body layer. C and F show the preadsorption control, in which the synthetic peptide used to generate the antisera was added before tissue incubation, resulting in a nearly complete abolishment of immunoreactivity. Scale bar: top and bottom, 400 μm; middle, 100 μm.
In contrast to the anti-cGLT1a and anti-nGLT1 antibodies, the anti-cGLT1b antibody showed no diminution of labeling in sections from the knock-out animal (data not shown). The anti-cGLT1b antibody used in this study is the same as that used in a previous study in which the antibody was shown to be specific by the criterion of immunoblot analysis of rat brain lysates (Chen et al., 2002). This antibody was raised against a 15 amino acid sequence containing the unique 11 amino acid C terminus of rat GLT1b, as well as 4 amino acids shared by GLT1a and GLT1b. [Using heterologous expression of rat GLT1a and rat GLT1b in COS7 cells, it was established that there was no cross-reactivity of this antibody with GLT1a, or of the anti-GLT1a antibody with GLT1b (Chen et al., 2002).] We also tested another antibody that was generated against the unique 11 amino acid C-terminal sequence of GLT1b. This antibody also equivalently labeled brain sections from wild-type and GLT1 knock-out mice (data not shown). In view of these results, we could not eliminate the possibility that these antibodies might be nonspecific in tissue sections. Thus, in the ensuing study, we report only results obtained with the anti-cGLT1a and anti-nGLT1 antibodies.
LM-ICC detection of GLT1 in the rat hippocampus
The anti-cGLT1a and anti-nGLT1 antibodies were used to detect GLT1 protein in the mature rat hippocampal formation, the primary goal of this study. By light microscopy, immunoreactivity using both the anti-GLT1a and anti-nGLT1 antibodies was readily apparent throughout the hippocampal formation (Fig. 5). Within the CA1 and CA3 fields of sections, perikarya and apical dendrites of neurons were clearly unlabeled, resulting in the appearance of an unstained band throughout the fields of the hippocampus (Fig. 5A,D). In contrast, the neuropil surrounding the apical and basal dendrites of these cells was intensely immunoreactive, resulting in darkness immediately surrounding the unlabeled shafts of apical dendrites. Within the dentate gyrus, the staining was similarly absent from the granule cell layer but enriched within the hilus.
At a higher magnification of 400×, it was evident that the antibody yielded intensely immunoreactive puncta (Fig. 5B,E). These appeared to be cross-sections of processes but could not be identified as dendritic, axonal, or astrocytic.
Inclusion of the synthetic antigenic peptide in the incubation of sections with the anti-cGLT1a and anti-nGLT1 antibodies completely abolished punctate immunoreactivity throughout the hippocampal formation and significantly reduced the more diffuse labeling as well, indicating the existence of subcellular elements below the limits of resolution of light microscopy that were specifically stained (Fig. 5C,F). These observations were confirmed by EM analyses (see below).
EM-ICC of anti-GLT1a immunoreactivity in the rat hippocampus
To pursue the ultrastructural localization of GLT1a expression, pre-embedding EM-ICC was performed on floating sections fixed with paraformaldehyde alone. No previous EM-ICC study of immunolabeling by anti-GLT1 antibodies used glutaraldehyde-free fixatives. Our pilot studies indicated that inclusion of glutaraldehyde in the fixative resulted in diminished immunolabeling of axons using anti-GLT1 antibodies. Avoidance of glutaraldehyde resulted in diminished preservation of ultrastructural detail, but this was considered to be an acceptable sacrifice in view of the heightened detection of immunolabeled profiles. In addition, special care was taken to use only ultrathin sections near the surface of blocks to optimize concentrations of reagents. In planning the approach used in the present study, we reasoned that the stain combining maximal sensitivity with the highest degree of certainty regarding cellular (as opposed to intracellular) localization of antigen would be optimal for a reexamination of the cellular expression of GLT1 (Aoki et al., 2000), and, therefore, the HRP–DAB reaction was used for detection.
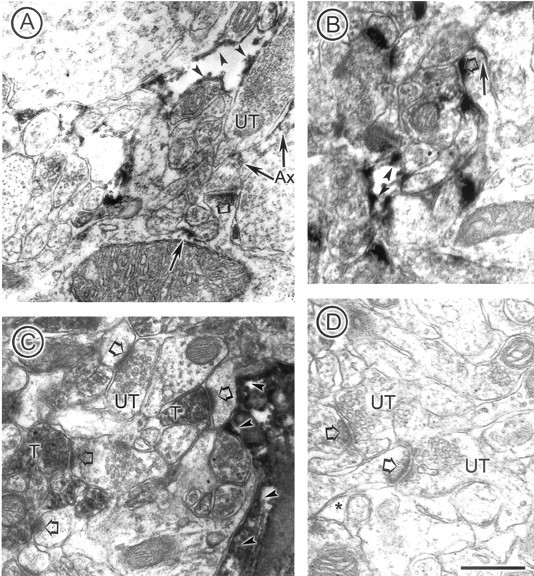
We found that GLT1a was present in neurons in addition to astrocytes (Fig. 6). EM-ICC revealed heterogeneity of asymmetric, presumably excitatory, synapses with regard to GLT1a immunoreactivity, with accumulation of HRP–DAB labeling over a subpopulation of axon terminals, axons of passage, dendritic spines, and dendrites (Fig. 6A-D). Within the same fields exhibiting neuronal labeling, most of the astrocytes juxtaposed to asymmetric synaptic junctions exhibited immunoreactivity (Fig. 6C), indicating that the chosen immunocytochemical procedure could recognize previously reported antigenic sites as well. Interestingly, whereas the HRP–DAB immunolabeling for GLT1a in astrocytic processes (arrowheads) was largely concentrated along the plasma membrane (Fig. 6C), the labeling within axon terminals (T) (Fig. 6A–C), dendritic spines (Fig. 6B) and dendritic shafts (Fig. 6D) appeared to be associated with both the plasma membrane and intracellular compartments. Some PSDs also appeared more electron dense than others, because of the accumulation of peroxidase reaction products there (Fig. 6C, large open arrows). However, quantitative evaluation of the labeling on PSDs was omitted in our analysis because discrimination of unlabeled PSDs, appearing thick as a result of the angle of sectioning, from the labeled ones, was not always possible.
Figure 6.

Electron microscopy reveals GLT1a immunoreactivity specifically in axon terminals, astrocytes, and dendrites. Immunoreactivity is visualized by the flocculent, electron-dense, peroxidase reaction product along membranes. A and B show examples of immunoreactive terminals (T) forming asymmetric axo-spinous juctions. Here and in other panels, the large open arrows point to PSDs, whereas small arrows point to portions of neurons exhibiting high concentrations of immunoreactivity. C shows the specificity of labeling of axon terminals and astrocytic processes within a single section. Immunocytochemical conditions that produced astrocytic labeling, as reported previously, also resulted in detection of GLT1a within some, but not all, axo-spinous excitatory junctions, and only rarely within dendrites. The field shown in C contains four axo-spinous synapses, two of which exhibit immunoreactivity within the axon terminal. The other two synapses show no detectable levels of immunoreactivity within the terminals (UT, unlabeled terminal). In the same field, astrocytic processes surround the dendritic shaft portions of the spine receiving synaptic input from the labeled terminal. These astrocytic processes exhibit immunoreactivity along the intracellular surface (arrowheads). D shows an example of a dendritic shaft exhibiting immunoreactivity along the smooth endoplasmic reticulum near a PSD. E shows complete absence of immunoreactivity in terminals, astrocytes (*), and spines after preadsorption of the antibody with the synthetic peptide against which the antibody was generated. Scale bars: A, C–E, 500 nm; B, 625 nm.
For comparison, Figure 6E shows a section that was coincubated with the anti-cGLT1a antibody and the peptide against which the antibody was generated. In all regions of the hippocampus, immunoreactivity was greatly abolished when incubated in the antibody solution containing the antigenic peptide. This initial observation was verified by having an observer (C.A.) blinded to the experimental condition perform ultrastructural analyses. The observer noted that the density of immunoreactive profiles within sections exposed to antibody plus antigenic peptide was <1% of that found in sections incubated with antibody alone. Peptide preadsorption blocked the neuronal labeling to the same extent as the astrocytic labeling, indicating that the neuronal labeling was as specific as the astrocytic labeling.
EM localization of anti-nGLT1 immunoreactivity in the hippocampus
If GLT1a is present in neurons in the hippocampus, then one would expect that antibodies against another region of the peptide sequence of the protein to also produce immunoreactivity within neurons. Accordingly, we undertook EM-ICC using the anti-nGLT1 antibody (Fig. 7). Reaction product was observed in preterminal portions of axons (Fig. 7A), at varying degrees of intensity within some terminals (T) (Fig. 7C), and not at all in others (UT in Fig. 7A,C). Both labeled and unlabeled terminals were found forming asymmetric synaptic junctions with spines, indicating that these were excitatory. Also labeled were dendritic shafts (Fig. 7A) and spines (Fig. 7B), indicated by arrows. As was seen with the anti-GLT1a antibody, reaction product in astrocytes was present along the plasma membrane (Fig. 7A–C, arrowheads). In neuronal and astrocytic profiles, immunolabeling along the plasma membrane was intense, resulting in diffusion of the peroxidase reaction product within the cytoplasm. However, because the diffusion never occurred across the plasma membrane into the extracellular space, discrimination of labeling along the plasma membrane of neuronal profiles from the plasma membrane of the immediately adjacent astrocytic plasma membrane was always possible. Coincubation of the antibody with the antigenic peptide resulted in elimination of dense reaction product (Fig. 7D). Again, this observation was confirmed by an observer blinded to the experimental condition, who reported that the density of both neuronal and astrocytic immunoreactive profiles were <2% within sections incubated with the antibody plus antigenic peptide.
Figure 7.
Anti-nGLT1 antibody also labels axons and spines. In all panels, immunoreactivity is indicated by thin arrows in neurons and arrowheads in astrocytes. The large, open arrows point to PSDs within spines. A shows nGLT immunoreactivity along the plasma membrane of an axon (Ax) forming a synapse onto a spine. The terminal portion of that axon is unlabeled. The shaft portion of the same dendrite exhibits immunoreactivity along the plasma membrane. Within the same field, immunoreactivity along the plasma membrane of an astrocytic process is also shown. B shows immunoreactivity along the plasma membrane of a dendritic spine and an astrocyte in its vicinity. C shows immunoreactivity in two axon terminals (T) in the vicinity of an unlabeled terminal (UT). D shows complete abolishment of immunoreactivity within the synaptic neuropil, including astrocytic processes (*), after preadsorption of the antibody with the peptide used to generate it. Scale bar, 500 nm.
We undertook a semiquantitative analysis of the subcellular distribution of HR-P–DAB labeling by anti-cGLT1a and anti-nGLT1 antibodies (Fig. 8). Statistical analysis was performed on 1393 profiles immunolabeled with the anti-cGLT1a antibody and 1096 profiles immunolabeled with the anti-nGLT1 antibody in the hippocampal formation from two animals. Specifically, the numbers of anti-cGLT1a antibody immunoreactive profiles were 665 in the CA1, 372 in the CA3, and 366 in the DG. The numbers of anti-nGLT1 antibody immunoreactive profiles were 337 for the CA1, 379 for CA3, and 380 for DG. The sampling excluded the pyramidal cell layers, the granule cell layers, and the stratum lacunosum moleculare. Otherwise, no attempt was made to restrict the sampling to a particular synaptic layer, because LM examination did not indicate any laminar differentiation in immunolabeling.
Figure 8.

Subcellular distribution of immunoreactivity using the anti-cGLT1a and anti-nGLT1 antibodies. A minimum of 10 photographs for each hippocampal region were taken of sections from two animals for each antibody and were examined at magnifications of 12,000×, 15,000×, or 20,000×. The total number of labeled profiles encountered were 1393 for the anti-GLT1a antibody-1abeled profiles and 1096 for the anti-nGLT1 antibody-labeled profiles. After excluding morphologically unidentifiable profiles, the percentages of all immunolabeled profiles from each micrograph that were astrocytes, axons, spines, or shafts were determined. The graphs show mean and SEM values in percentages of all morphologically identifiable, immunolabeled profiles encountered in each micrograph representing each region and each antibody. Astrocytic profiles were the major subcellular profiles immunolabeled. Among the neuronal profiles, axons were immunolabeled more frequently than spines (unpaired t test; *p ≤ 0.05). N values (the number of micrographs sampled) were the following for the cGLT1a antibody: 50 from the CA1 region, 22 from CA3 and 28 from DG. The N values for the nGLT1 analysis were 31 for CA1 region, 33 for CA3 and 35 for DG.
The numbers of labeled neuronal and astrocytic processes obtained with the anti-cGLT1a (Fig. 8A) and anti-nGLT1 (Fig. 8B) antibodies were expressed as a percentage of the total number of morphologically identifiable and immunolabeled processes (astrocytic plus neuronal). The fraction that was astrocytic averaged 60–70% of all immunolabeled processes. The percentage of the total labeled processes represented by total neuronal labeling (axon plus spine plus shaft) using the anti-cGLT1a antibody ranged between 26 and 40%, depending on the region (Fig. 8A), and using the anti-nGLT1 antibody, between 24 and 30% (Fig. 8B). In all three regions, axonal labeling by the anti-cGLT1a antibody was greater than labeling of spines and shafts (p < 0.05).
In addition, an estimate was obtained of labeled axons and axon terminals as a percentage of all axons and axon terminals per micrograph (labeled and unlabeled) (Fig. 9). Of all axons encountered, those that were labeled with anti-cGLT1a antibody ranged from 14 to 29%, depending on the region, whereas those labeled with the anti-nGLT1 antibody ranged from 4 to 7% of the total. Labeling of axons in the CA3 region by the anti-cGLT1a antibody was greater than in the CA1 region (p = 0.016).
Figure 9.

Comparison of axonal labeling across regions of the hippocampus. The same set of electron micrographs used for the analyses shown in Figure 8 was used here to determine the proportion of all axons encountered that were immunolabeled. The graphs show mean ± SEM values. To test for differences among the CA1, CA3, and DG groups, ANOVA was performed. Anti-cGLT1a antibody immunoreactivity in axons was heterogeneous, and the difference in axon labeling between the CA1 and CA3 fields was significant (p = 0.016). The difference in axon labeling across regions using the anti-nGLT1 antibody was not statistically significant. The N values for the anatomical regions and antibodies were the same as indicated in the legend to Figure 8.
Axon terminals included in the analysis here may have included some that formed inhibitory synapses. However, because inhibitory synapses are only a small fraction (∼5%) of the number of excitatory synapses that are present in the hippocampal neuropil (Bloom and Iversen, 1971; Megias et al., 2001) and 9% within the fields subjected to analysis in this study (data not shown), their contribution would not be expected to be significant. Indeed, semiquantitative analysis indicated that none of the terminals forming symmetric (putatively inhibitory) synapses were immunoreactive for nGLT1, and only 5 of 120 synapses immunoreactive for the cGLT1a antibody exhibited symmetric synapses.
Because the GLT1 knock-out mouse is the optimal control for the mouse, and not the rat, the most convincing demonstration of the localization of GLT1 in axon terminals would be in the wild-type littermates of the knock-out. Therefore, as an additional test of the specificity of the anti-cGLT1a antibody, we tested it in a wild-type mouse littermate of the knock-out mouse shown in Figure 4. For this experiment, of necessity, young animals were used because of the lethality of the GLT1–/–mutation. EM-ICC on the hippocampus of a wild-type P7 animal using the anti-cGLT1a antibody is shown in Figure 10, A and B. Here, labeling in two terminals (T) is shown (Fig. 10A). Vesicles are indicated by arrows in one of them. An open arrow indicates a probable synaptic specialization. Labeling in two astrocytic processes is indicated by arrowheads (Fig. 10A,B). For comparison, EM-ICC using the anti-GLT1a antibody was performed on tissue from a knock-out littermate of the animal shown in Figure 10, A and B (Fig. 10C). The section used was taken at the tissue interface, in which concentrations of reagents are optimum, and this is demonstrated by inclusion of the tissueresin interface, seen in the top right corner of C and indicated by open arrowheads. At least five PSDs are present in Figure 10C, three of which are indicated by open arrows. Axon terminals are unlabeled.
Figure 10.

GLT1a immunoreactivity within hippocampal terminals and astrocytes of P7 mice. The tissue was obtained from +/+ (A, B) and –/– (C) littermates of a GLT1+/– × GLT1+/– cross. A shows two profiles immunolabeled with the anti-cGLT1a antibody, identifiable as terminals (T) by the presence of a few vesicles (small arrows). Both A and B show immunolabeled profiles identifiable as astrocytes by the irregular contours of their plasma membranes (arrowheads). Both images were taken from the stratum radiatum of the CA1. In A, a putative postsynaptic specialization is marked with an open arrow. The LM results from the same tissue are shown in Figure 4, which also shows images obtained from age-matched knock-out littermates. C shows GLT1a immunoreactivity in a knock-out (–/–) littermate. The tissue was sampled from the CA3 region of the hippocampus. White arrowheads point to the tissue surface in which exposure to immunoreagents is expected to be the greatest and demonstrate that this section was, in fact, taken from this region of the block. Scale bar (in B): A, B, 500 nm; C, 500 nm.
Discussion
Neuronal GLT1 mRNA in the hippocampus codes primarily for GLT1a
The in situ hybridization results reported here, directly comparing expression of GLT1a and GLT1b mRNA in the hippocampus, demonstrate that GLT1a mRNA is the predominant form in neurons. A previous study of GLT1b mRNA expression (Schmitt et al., 2002) reported results at variance with those obtained in the present study. They found strong uniform labeling of the stratum pyramidale in CA1, CA2, and CA3 (see their Fig. 5a,c). However, such an absence of a gradient between CA1 to CA3 neurons contradicts results obtained with pan-GLT1 probes by these authors themselves, by us, and by other groups (Torp et al., 1994). Using the selective isoform probes with AP detection, we detected strong labeling for GLT1a and weak labeling for GLT1b in CA3 neurons and no labeling for both probes in CA1 neurons. The gradient between CA1 and CA3 for GLT1b was more obvious using the double-label approach (Fig. 1L,Q,R).
The fluorescent labeling seen for GLT1b in CA3 neurons did not clearly delineate the neuronal cytoplasm, perhaps because of the very low abundance of this message and the tyramide signal amplification used to visualize the signal. However, with DAPI nuclear counterstaining and using higher magnification with AP detection, we could demonstrate that the GLT1b label is localized to a small rim surrounding the nuclei, suggesting that the GLT1b message is indeed present in the neuronal cytoplasm.
Specificity of anti-GLT1 antibodies
A comparison of immunoblot and immunocytochemical labeling in lysates and sections from wild-type and knock-out littermates provides the most rigorous test of antibody specificity. The results here establish the specificity of the anti-GLT1a antibody. The anti-nGLT1 antibody also seems to be specific by this criterion. Although the presence of nuclear labeling has been taken to indicate that an antibody is nonspecific (Danbolt, 2001), this seems to be true in the case of the anti-nGLT1 antibody only for the nuclear labeling itself, because the labeling of puncta and processes observed in sections from the wild-type animals is clearly not present in the knock-out sections. Based on this observation, we conclude that the diffuse labeling over nuclei is nonspecific, whereas the punctate labeling in the synaptic layers is specific.
Expression of GLT1 in neurons has previously eluded detection
The present studies demonstrate that GLT1a, previously thought to be expressed exclusively in astrocytes in the mature brain (Danbolt, 2001), is also expressed in neuronal processes. We used the same antibody that in a previous study detected GLT1a immunoreactivity exclusively in astrocytes (Rothstein et al., 1994), and, therefore, a difference in antibodies cannot be invoked to account for the disparate results. In the present study, care has been taken to avoid glutaraldehyde and to only sample ultrathin sections close to the surface of vibratome sections in which exposure to antibody is likely to be optimal. A recent LM-ICC study using paraformaldehyde fixation and fluorescence detection did not detect expression of GLT1a or GLT1b in neuronal cell bodies or dendrites (Reye et al., 2002c). These results are consistent with the LM-ICC results reported here. In addition, the present results demonstrate GLT1a protein in axons by EM-ICC. Therefore, we conclude that GLT1a protein is rapidly transported out of neuronal cell bodies after synthesis.
An exception to the statement that GLT1 has been found only in astrocytes in the mature brain comes from localization studies focused on the retina (Rauen and Kanner, 1994; Euler and Wassle, 1995; Rauen et al., 1996), in which GLT1b appears to be the predominant form (Reye et al., 2002a,b; Schmitt et al., 2002). In addition, other studies have demonstrated GLT1 protein in neurons during development (Yamada et al., 1998; Northington et al., 1999), in vitro (Mennerick et al., 1998; Wang et al., 1998; Chen et al., 2002), and under pathological circumstances, such as following hypoxia (Martin et al., 1997) and chronic opiate use (Xu et al., 2003).
GLT1a is expressed in axon terminals forming excitatory synapses
The identification of GLT1 as a presynaptic transporter is fully compatible with the available evidence, exhaustively reviewed by Danbolt (2001): the presence of transcripts for GLT1 in neurons throughout the forebrain (Schmitt et al., 1996; Torp et al., 1997; Berger and Hediger, 1998); the demonstration of glutamate uptake into cortical synaptosomes (Beart, 1976) that is inhibited by dihydrokainate (Ferkany and Coyle, 1986; Robinson et al., 1993; Koch et al., 1999; Suchak et al., 2003), which, at low concentrations (<300 μm), is an inhibitor exclusively of GLT1 among the known transporters (Arriza et al., 1994; Tan et al., 1999; Chen et al., 2002; Kalandadze et al., 2002); the expression of GLT1 in neurons in vitro (Mennerick et al., 1998; Wang et al., 1998; Chen et al., 2002); and the increase in cross-talk between neighboring synapses by dihydrokainate (Asztely et al., 1997; Bergles and Jahr, 1998). The simplest explanation for these observations is that presynaptic uptake of glutamate is, in fact, mediated by the expression of GLT1, at least in some excitatory terminals.
Relationship of the present work to previous work
We have documented the cloning of GLT1b and GLT1a from rat forebrain neurons in culture, and the expression of these proteins in these cells (Chen et al., 2002). In addition, we used the antibody generated against GLT1b to investigate the expression of GLT1b in the brain by LM-ICC and EM-ICC using silver enhanced immunogold detection. We now know that immunocytochemical results obtained with this antibody are subject to doubt because of its labeling of sections from GLT1 knock-out brains, demonstrated in the present study. The interpretation of this finding is questionable, because the GLT1 knock-out demonstrates no decrease in mRNA expression (Tanaka et al., 1997), leaving open the possibility that an abnormal protein derived from the GLT1 gene is expressed. At this point, however, we can neither confirm nor deny the localization of GLT1b protein in neurons in the brain, because of the lack of an antibody of proven specificity. Of note, other reports have appeared that also investigate the localization of GLT1b using antibodies directed against the unique C terminus sequence of GLT1b (Reye et al., 2002a,b,c; Schmitt et al., 2002; Kugler and Schmitt, 2003). None of these other studies have validated the specificity of the anti-GLT1b antibody using the GLT1 knock-out mouse. Immunocytochemical data contained therein and obtained with these antibodies must, therefore, be interpreted with caution. At the present time, it is only possible to say with certainty that GLT1b protein is expressed in the brain, as demonstrated by immunoblot assay (Chen et al., 2002; Schmitt et al., 2002) (Fig. 3).
GLT1 is expressed in a subpopulation of axon terminals
The prevalence of axon profiles in the hippocampus labeled with the anti-cGLT1a antibody in our study ranged from 14 to 29%. Technical limitations such as penetration of antibody, expression of protein within neurons at levels close to or below the limit of detection, or denaturation of protein may yield a falsely low estimate, and, as mentioned above, may account for previous failures to detect GLT1 protein in neurons in the mature adult brain, and may be the basis for partial detection of the true extent of labeling of axons in the present study. However, more substantive explanations may also pertain, including the expression of other variant forms of GLT1 not yet recognized, or other transporters, such as EAAC1 (He et al., 2000), post-translational modification, or interacting proteins interfering with antibody binding. In addition, some axon terminals may use alternate pathways to resupply excitatory terminals with glutamate (Fonnum, 1984; Shank et al., 1989; Lehmann et al., 1993; Sonnewald et al., 1993; Westergaard et al., 1995; Hertz et al., 1999; Hassel and Brathe, 2000a,b).
Significance of expression of GLT1 in axon terminals
The functional significance of the localization of GLT1 in axon terminals has yet to be determined. The expression of GLT1a in axon terminals has potentially important implications for the physiology of excitatory synaptic transmission in regulating synaptic glutamate, maintaining glutamate stores in the presynaptic terminal, interacting with glutamate receptors, contributing a glutamate regulated anionic conductance to the plasma membrane of the presynaptic bouton, and controlling cross-talk between excitatory synapses. This finding is also of potential importance in understanding the pathogenesis of excitotoxic injury, because the presynaptic excitatory terminal has been thought to be a major source of the glutamate that accumulates to pathological levels in the setting of energy failure, and reversal of glutamate transporters has been hypothesized to be an important mechanism for this accumulation (Szatkowski et al., 1990; Ottersen et al., 1992; Storm-Mathisen et al., 1992; Madl and Burgesser, 1993; Rossi et al., 2000; Mitani and Tanaka, 2003). If GLT1 is the principal glutamate transporter associated with excitatory axon terminals, then GLT1 is specifically implicated in multiple important physiological and pathological processes.
Footnotes
This work was supported by grants from the Ron Shapiro Charitable Foundation (P.A.R.) and the Muscular Dystrophy Association (P.A.R.); by National Institutes of Health Research Grants NS40753 (P.A.R.), NS41883 (P.A.R.), NS41091 (C.A.), and EY13145 (C.A.); Mental Retardation Core Grant HD18655 (P.A.R.); National Eye Institute Core Grant EY13079 (C.A.); and by an Office of Naval Research grant to Solicitation 99-019 (C.A.). We are grateful to Drs. Gabriel Corfas and Kristen Harris for advice through the course of this work and to David Goldberg for assistance with the design and preparation of figures.
Correspondence should be addressed to Dr. Paul A. Rosenberg, Enders Research Building, Department of Neurology, Children's Hospital, 300 Longwood Avenue, Boston, MA 02115. E-mail: paul.rosenberg@tch.harvard.edu.
U. V. Berger's present address: UB-In Situ, Natick, MA 01760.
DOI:10.1523/JNEUROSCI.1586-03.2004
Copyright © 2004 Society for Neuroscience 0270-6474/04/241136-13$15.00/0
W.C. and V.M. contributed equally to this work.
C.A. and P.A.R. (senior authors) contributed equally to this work.
References
- Aoki C, Rodrigues S, Kurose H (2000) Use of electron microscopy in the detection of adrenergic receptors. Methods Mol Biol 126: 535–563. [DOI] [PMC free article] [PubMed] [Google Scholar]
- Arriza JL, Fairman WA, Wadiche JI, Murdoch GH, Kavanaugh MP, Amara SG (1994) Functional comparisons of three glutamate transporter subtypes cloned from human motor cortex. J Neurosci 14: 5559–5569. [DOI] [PMC free article] [PubMed] [Google Scholar]
- Asztely F, Erdemli G, Kullmann DM (1997) Extrasynaptic glutamate spillover in the hippocampus: dependence on temperature and the role of active glutamate uptake. Neuron 18: 281–293. [DOI] [PubMed] [Google Scholar]
- Beart PM (1976) The autoradiographic localization of l-(3H) glutamate in synaptosomal preparations. Brain Res 103: 350–355. [DOI] [PubMed] [Google Scholar]
- Berger UV, Hediger MA (1998) Comparative analysis of glutamate transporter expression in rat brain using differential double in situ hybridization. Anat Embryol 198: 13–30. [DOI] [PubMed] [Google Scholar]
- Berger UV, Hediger MA (2000) Distribution of the glutamate transporters GLAST and GLT-1 in rat circumventricular organs, meninges, and dorsal root ganglia. J Comp Neurol 421: 385–399. [DOI] [PubMed] [Google Scholar]
- Bergles DE, Jahr CE (1998) Glial contribution to glutamate uptake at Schaffer collateral-commissural synapses in the hippocampus. J Neurosci 18: 7709–7716. [DOI] [PMC free article] [PubMed] [Google Scholar]
- Bloom FE, Iversen LL (1971) Localizing 3H-GABA in nerve terminals of rat cerebral cortex by electron microscopic autoradiography. Nature 229: 628–630. [DOI] [PubMed] [Google Scholar]
- Chan J, Aoki C, Pickel VM (1990) Optimization of differential immunogold-silver and peroxidase labeling with maintenance of ultrastructure in brain sections before plastic embedding. J Neurosci Methods 33: 113–127. [DOI] [PMC free article] [PubMed] [Google Scholar]
- Chaudhry FA, Lehre KP, Campagne MV, Ottersen OP, Danbolt NC, Storm-Mathisen J (1995) Glutamate transporters in glial plasma membranes: highly differentiated localizations revealed by quantitative ultrastructural immunocytochemistry. Neuron 15: 711–720. [DOI] [PubMed] [Google Scholar]
- Chen W, Aoki C, Mahadomrongkul V, Gruber CE, Wang GJ, Blitzblau R, Irwin N, Rosenberg PA (2002) Expression of a variant form of the glutamate transporter GLT1 in neuronal cultures and in neurons and astrocytes in the rat brain. J Neurosci 22: 2142–2152. [DOI] [PMC free article] [PubMed] [Google Scholar]
- Danbolt NC (2001) Glutamate uptake. Prog Neurobiol 65: 1–105. [DOI] [PubMed] [Google Scholar]
- Danbolt NC, Storm-Mathisen J, Kanner BI (1992) An [Na++K+]coupled l-glutamate transporter purified from rat brain is located in glial cell processes. Neuroscience 51: 295–310. [DOI] [PubMed] [Google Scholar]
- Divac I, Fonnum F, Storm-Mathisen J (1977) High affinity uptake of glutamate in terminals of corticostriatal axons. Nature 266: 377–378. [DOI] [PubMed] [Google Scholar]
- Euler T, Wassle H (1995) Immunocytochemical identification of cone bipolar cells in the rat retina. J Comp Neurol 361: 461–478. [DOI] [PubMed] [Google Scholar]
- Ferkany J, Coyle JT (1986) Heterogeneity of sodium-dependent excitatory amino acid uptake mechanisms in rat brain. J Neurosci Res 16: 491–503. [DOI] [PubMed] [Google Scholar]
- Fonnum F (1984) Glutamate: a neurotransmitter in mammalian brain. J Neurochem 42: 1–11. [DOI] [PubMed] [Google Scholar]
- Gundersen V, Ottersen OP, Storm-Mathisen J (1996) Selective excitatory amino acid uptake in glutamatergic nerve terminals and in glia in the rat striatum: quantitative electron microscopic immunocytochemistry of exogenous (d)-aspartate and endogenous glutamate and GABA. Eur J Neurosci 8: 758–765. [DOI] [PubMed] [Google Scholar]
- Gundersen V, Danbolt NC, Ottersen OP, Storm-Mathisen J (1993) Demonstration of glutamate/aspartate uptake activity in nerve endings by use of antibodies recognizing exogenous d-aspartate. Neuroscience 57: 97–111. [DOI] [PubMed] [Google Scholar]
- Hassel B, Brathe A (2000a) Cerebral metabolism of lactate in vivo: evidence for neuronal pyruvate carboxylation. J Cereb Blood Flow Metab 20: 327–336. [DOI] [PubMed] [Google Scholar]
- Hassel B, Brathe A (2000b) Neuronal pyruvate carboxylation supports formation of transmitter glutamate. J Neurosci 20: 1342–1347. [DOI] [PMC free article] [PubMed] [Google Scholar]
- He Y, Janssen WG, Rothstein JD, Morrison JH (2000) Differential synaptic localization of the glutamate transporter EAAC1 and glutamate receptor subunit GluR2 in the rat hippocampus. J Comp Neurol 418: 255–269. [PubMed] [Google Scholar]
- Hees B, Danbolt NC, Kanner BI, Haase W, Heitmann K, Koepsell H (1992) A monoclonal antibody against a Na(+)-l-glutamate cotransporter from rat brain. J Biol Chem 267: 23275–23281. [PubMed] [Google Scholar]
- Hertz L, Dringen R, Schousboe A, Robinson SR (1999) Astrocytes: glutamate producers for neurons. J Neurosci Res 57: 417–428. [PubMed] [Google Scholar]
- Hsu SM, Raine L, Fanger H (1981) Use of avidin–biotin–peroxidase complex (ABC) in immunoperoxidase techniques: a comparison between ABC and unlabeled antibody (PAP) procedures. J Histochem Cytochem 29: 577–580. [DOI] [PubMed] [Google Scholar]
- Kalandadze A, Wu Y, Robinson MB (2002) Protein kinase C activation decreases cell surface expression of the GLT-1 subtype of glutamate transporter—requirement of a carboxyl-terminal domain and partial dependence on serine 486. J Biol Chem 277: 45741–45750. [DOI] [PubMed] [Google Scholar]
- Koch HP, Kavanaugh MP, Esslinger CS, Zerangue N, Humphrey JM, Amara SG, Chamberlin AR, Bridges RJ (1999) Differentiation of substrate and nonsubstrate inhibitors of the high-affinity, sodium-dependent glutamate transporters. Mol Pharmacol 56: 1095–1104. [DOI] [PubMed] [Google Scholar]
- Kugler P, Schmitt A (2003) Complementary neuronal and glial expression of two high-affinity glutamate transporter GLT1/EAAT2 forms in rat cerebral cortex. Histochem Cell Biol 119: 425–435. [DOI] [PubMed] [Google Scholar]
- Lehmann JC, Kapkov D, Shank RP (1993) Kinetics of 2-oxoglutarate uptake by synaptosomes from bovine and rat retina and cerebral cortex and regulation by glutamate and glutamine. Dev Neurosci 15: 330–335. [DOI] [PubMed] [Google Scholar]
- Lehre KP, Levy LM, Ottersen OP, Storm-Mathisen J, Danbolt NC (1995) Differential expression of two glial glutamate transporters in the rat brain: quantitative and immunocytochemical observations. J Neurosci 15: 1835–1853. [DOI] [PMC free article] [PubMed] [Google Scholar]
- Levy LM, Lehre KP, Rolstad B, Danbolt NC (1993) A monoclonal antibody raised against an [Na++K+]coupled l-glutamate transporter purified from rat brain confirms glial cell localization. FEBS Lett 317: 79–84. [DOI] [PubMed] [Google Scholar]
- Madl JE, Burgesser K (1993) Adenosine triphosphate depletion reverses sodium-dependent, neuronal uptake of glutamate in rat hippocampal slices. J Neurosci 13: 4429–4444. [DOI] [PMC free article] [PubMed] [Google Scholar]
- Mangano RM, Schwarcz R (1983) Chronic infusion of endogenous excitatory amino acids into rat striatum and hippocampus. Brain Res Bull 10: 47–51. [DOI] [PubMed] [Google Scholar]
- Martin LJ, Brambrink AM, Lehmann C, Portera-Cailliau C, Koehler R, Rothstein J, Traystman RJ (1997) Hypoxia-ischemia causes abnormalities in glutamate transporters and death of astroglia and neurons in newborn striatum. Ann Neurol 42: 335–348. [DOI] [PubMed] [Google Scholar]
- Megias M, Emri Z, Freund TF, Gulyas AI (2001) Total number and distribution of inhibitory and excitatory synapses on hippocampal CA1 pyramidal cells. Neuroscience 102: 527–540. [DOI] [PubMed] [Google Scholar]
- Mennerick S, Dhond RP, Benz A, Xu W, Rothstein JD, Danbolt NC, Isenberg KE, Zorumski CF (1998) Neuronal expression of the glutamate transporter GLT-1 in hippocampal microcultures. J Neurosci 18: 4490–4499. [DOI] [PMC free article] [PubMed] [Google Scholar]
- Mitani A, Tanaka K (2003) Functional changes of glial glutamate transporter GLT-1 during ischemia: an in vivo study in the hippocampal CA1 of normal mice and mutant mice lacking GLT-1. J Neurosci 23: 7176–7182. [DOI] [PMC free article] [PubMed] [Google Scholar]
- Northington FJ, Traystman RJ, Koehler RC, Martin LJ (1999) GLT1, glial glutamate transporter, is transiently expressed in neurons and develops astrocyte specificity only after midgestation in the ovine fetal brain. J Neurobiol 39: 515–526. [PubMed] [Google Scholar]
- Ottersen OP, Zhang N, Walberg F (1992) Metabolic compartmentation of glutamate and glutamine: morphological evidence obtained by quantitative immunocytochemistry in rat cerebellum. Neuroscience 46: 519–534. [DOI] [PubMed] [Google Scholar]
- Pines G, Danbolt NC, Bjoras M, Zhang Y, Bendahan A, Eide L, Koepsell H, Storm-Mathisen J, Seeberg E, Kanner BI (1992) Cloning and expression of a rat brain l-glutamate transporter. Nature 360: 464–467. [DOI] [PubMed] [Google Scholar]
- Posnett DN, McGrath H, Tam JP (1988) A novel method for producing anti-peptide antibodies. Production of site-specific antibodies to the T cell antigen receptor beta-chain. J Biol Chem 263: 1719–1725. [PubMed] [Google Scholar]
- Rauen T, Kanner BI (1994) Localization of the glutamate transporter GLT-1in rat and macaque monkey retinae. Neurosci Lett 169: 137–140. [DOI] [PubMed] [Google Scholar]
- Rauen T, Rothstein JD, Wässle H (1996) Differential expression of three glutamate transporter subtypes in the rat retina. Cell Tissue Res 286: 325–336. [DOI] [PubMed] [Google Scholar]
- Reye P, Sullivan R, Pow DV (2002a) Distribution of two splice variants of the glutamate transporter GLT-1 in the developing rat retina. J Comp Neurol 447: 323–330. [DOI] [PubMed] [Google Scholar]
- Reye P, Sullivan R, Fletcher EL, Pow DV (2002b) Distribution of two splice variants of the glutamate transporter GLT1 in the retinas of humans, monkeys, rabbits, rats, cats, and chickens. J Comp Neurol 445: 1–12. [DOI] [PubMed] [Google Scholar]
- Reye P, Sullivan R, Scott H, Pow DV (2002c) Distribution of two splice variants of the glutamate transporter GLT-1 in rat brain and pituitary. Glia 38: 246–255. [DOI] [PubMed] [Google Scholar]
- Robinson MB, Sinor JD, Dowd LA, Kerwin Jr JF (1993) Subtypes of sodium-dependent high-affinity l-[3H]glutamate transport activity: pharmacologic specificity and regulation by sodium and potassium. J Neurochem 60: 167–179. [DOI] [PubMed] [Google Scholar]
- Rosenberg PA, Amin S, Leitner M (1992) Glutamate uptake disguises neurotoxic potency of glutamate agonists in cerebral cortex in dissociated cell culture. J Neurosci 12: 56–61. [DOI] [PMC free article] [PubMed] [Google Scholar]
- Rossi DJ, Oshima T, Attwell D (2000) Glutamate release in severe brain ischaemia is mainly by reversed uptake. Nature 403: 316–321. [DOI] [PubMed] [Google Scholar]
- Rothstein JD, Martin L, Levey AI, Dykes-Hoberg M, Jin L, Wu D, Nash N, Kuncl RW (1994) Localization of neuronal and glial glutamate transporters. Neuron 13: 713–725. [DOI] [PubMed] [Google Scholar]
- Rusakov DA, Kullmann DM (1998) Extrasynaptic glutamate diffusion in the hippocampus: ultrastructural constraints, uptake, and receptor activation. J Neurosci 18: 3158–3170. [DOI] [PMC free article] [PubMed] [Google Scholar]
- Schmitt A, Asan E, Lesch K-P, Kugler P (2002) A splice variant of glutamate transporter GLT1/EAAT2 expressed in neurons: cloning and localization in rat nervous system. Neuroscience 109: 45–61. [DOI] [PubMed] [Google Scholar]
- Schmitt A, Asan E, Püschel B, Jöns T, Kugler P (1996) Expression of the glutamate transporter GLT1 in neural cells of the rat central nervous system: non-radioactive in situ hybridization and comparative immunocytochemistry. Neuroscience 71: 989–1004. [DOI] [PubMed] [Google Scholar]
- Shank RP, Baldy WJ, Ash CW (1989) Glutamine and 2-oxoglutarate as metabolic precursors of the transmitter pools of glutamate and GABA: correlation of regional uptake by rat brain synaptosomes. Neurochem Res 14: 371–376. [DOI] [PubMed] [Google Scholar]
- Sonnewald U, Westergaard N, Petersen SB, Unsgård G, Schousboe A (1993) Metabolism of [U-13C]glutamate in astrocytes studied by 13C NMR spectroscopy: incorporation of more label into lactate than into glutamine demonstrates the importance of the tricarboxylic acid cycle. J Neurochem 61: 1179–1182. [DOI] [PubMed] [Google Scholar]
- Storck T, Schulte S, Hofmann K, Stoffel W (1992) Structure, expression, and functional analysis of a Na+-dependent glutamate/aspartate transporter from rat brain. Proc Natl Acad Sci USA 89: 10955–10959. [DOI] [PMC free article] [PubMed] [Google Scholar]
- Storm-Mathisen J, Iversen LL (1979) Uptake of [3H] glutamaic acid in excitatory nerve endings: light and electronmicroscopic observations in the hippocampal formation of the rat. Neuroscience 4: 1237–1253. [DOI] [PubMed] [Google Scholar]
- Storm-Mathisen J, Wold JE (1981) In vivo high-affinity uptake and axonal transport of d-[2, 3–3H]aspartate in excitatory neurons. Brain Res 230: 427–433. [DOI] [PubMed] [Google Scholar]
- Storm-Mathisen J, Danbolt NC, Rothe F, Torp R, Zhang N, Aas JE, Kanner BI, Langmoen I, Ottersen OP (1992) Ultrastructural immunocytochemical observations on the localization, metabolism and transport of glutamate in normal and ischemic brain tissue. Prog Brain Res 94: 225–241. [DOI] [PubMed] [Google Scholar]
- Suchak SK, Baloyianni NV, Perkinton MS, Williams RJ, Meldrum BS, Rattray M (2003) The “glial” glutamate transporter, EAAT2 (Glt-1) accounts for high affinity glutamate uptake into adult rodent nerve endings. J Neurochem 84: 522–532. [DOI] [PubMed] [Google Scholar]
- Szatkowski M, Barbour B, Attwell D (1990) Non-vesicular release of glutamate from glial cells by reversed electrogenic glutamate uptake. Nature 348: 443–446. [DOI] [PubMed] [Google Scholar]
- Tam JP (1988) Synthetic peptide vaccine design: synthesis and properties of a high-density multiple antigenic peptide system. Proc Natl Acad Sci USA 85: 5409–5413. [DOI] [PMC free article] [PubMed] [Google Scholar]
- Tan J, Zelenaia O, Correale D, Rothstein JD, Robinson MB (1999) Expression of the GLT-1 subtype of Na+-dependent glutamate transporter: pharmacological characterization and lack of regulation by protein kinase C. J Pharmacol Exp Ther 289: 1600–1610. [PubMed] [Google Scholar]
- Tanaka K, Watase K, Manabe T, Yamada K, Watanabe M, Takahashi K, Iwama H, Nishikawa T, Ichihara N, Kikuchi T, Okuyama S, Kawashima N, Hori S, Takimoto M, Wada K (1997) Epilepsy and exacerbation of brain injury in mice lacking the glutamate transporter GLT-1. Science 276: 1699–1702. [DOI] [PubMed] [Google Scholar]
- Taxt T, Storm-Mathisen J (1984) Uptake of d-aspartate and l-glutamate in excitatory axon terminals in hippocampus: autoradiographic and biochemical comparison with gamma-aminobutyrate and other amino acids in normal rats and in rats with lesions. Neuroscience 11: 79–100. [DOI] [PubMed] [Google Scholar]
- Torp R, Hoover F, Danbolt NC, Storm-Mathisen J (1997) Differential distribution of the glutamate transporters GLT1 and rEAAC1 in rat cerebral cortex and thalamus: an in situ hybridization analysis. Anat Embryol 195: 317–326. [DOI] [PubMed] [Google Scholar]
- Torp R, Danbolt NC, Babaie E, Bjoras M, Storm-Mathisen J, Ottersen OP (1994) Differential expression of two glial glutamate transporters in the rat brain: in situ hybridization study. Eur J Neurosci 6: 936–942. [DOI] [PubMed] [Google Scholar]
- Utsunomiya-Tate N, Endou H, Kanai Y (1997) Tissue specific variants of glutamate transporter GLT-1. FEBS Lett 416: 312–316. [DOI] [PubMed] [Google Scholar]
- Ventura R, Harris KM (1999) Three-dimensional relationships between hippocampal synapses and astrocytes. J Neurosci 19: 6897–6906. [DOI] [PMC free article] [PubMed] [Google Scholar]
- Wang GJ, Chung HJ, Schnuer J, Pratt K, Zable AC, Kavanaugh MP, Rosenberg PA (1998) High affinity glutamate transport in rat cortical neurons in culture. Mol Pharmacol 53: 88–96. [DOI] [PubMed] [Google Scholar]
- Westergaard N, Sonnewald U, Schousboe A (1995) Metabolic trafficking between neurons and astrocytes: the glutamate glutamine cycle revisited. Dev Neurosci 17: 203–211. [DOI] [PubMed] [Google Scholar]
- Xu NJ, Bao L, Fan HP, Bao GB, Pu L, Lu YJ, Wu CF, Zhang X, Pei G (2003) Morphine withdrawal increases glutamate uptake and surface expression of glutamate transporter GLT1 at hippocampal synapses. J Neurosci 23: 4775–4784. [DOI] [PMC free article] [PubMed] [Google Scholar]
- Yamada K, Watanabe M, Shibata T, Nagashima M, Tanaka K, Inoue Y (1998) Glutamate transporter GLT-1 is transiently localized on growing axons of the mouse spinal cord before establishing astrocytic expression. J Neurosci 18: 5706–5713. [DOI] [PMC free article] [PubMed] [Google Scholar]