

Abstract
The presynaptic Ca2+ signal, which triggers vesicle release, disperses to a broadly distributed residual [Ca2+] ([Ca2+]res) that plays an important role in synaptic plasticity. We have previously reported a slowing in the decay timecourse of [Ca2+]res during the second of paired pulses. In this study, we investigated the contributions of organelle and plasma membrane Ca2+ flux pathways to the reduction of effectiveness of [Ca2+]res clearance during short-term plasticity in Schaffer collateral terminals in the CA1 field of the hippocampus. We show that the slowed decay timecourse is mainly the result of a transport-dependent Ca2+ clearance process; that presynaptic caffeine-sensitive Ca2+ stores are not functionally loaded in the unstimulated terminal, but that these stores can effectively take up Ca2+ even during high frequency trains of stimuli; and that a rate limiting step of sarco-endoplasmic reticulum Ca2+-ATPase (SERCA) kinetics following the first pulse is responsible for a large portion of the observed slowing of [Ca2+]res clearance during the second pulse. We were able to accurately fit our [Ca2+]res data with a kinetic model based on these observations and this model predicted a reduction in availability of unbound SERCA during paired pulses, but no saturation of Ca2+ buffer in the endoplasmic reticulum.
Keywords: Hippocampus, Schaffer collateral, Kinetics, Calcium clearance, Endoplasmic reticulum
1. Introduction
Following a presynaptic action potential, there is a rapid rise of [Ca2+] in the immediate vicinity of Ca2+ channels that triggers release of vesicles docked within this microdomain [1]. This presynaptic Ca2+ signal ([Ca2+]pre) then disperses by diffusion and buffering to produce a residual [Ca2+] ([Ca2+]res) that decays over the course of tens to hundreds of milliseconds. Presynaptic [Ca2+]res, although at a lower concentration than that necessary for vesicular release, plays a modulatory role that is important in synaptic plasticity [2,3] and has been implicated as a basis for working memory storage [4]. Thus, the duration of the [Ca2+]res signal is a crucial determinant of the dynamic properties of synaptic transmission.
In a previous study [5], we reported that the decay timecourse of [Ca2+]res is significantly slowed during the second of paired pulses under conditions where short-term synaptic plasticity is observed. In this study, we have investigated those mechanisms that could alter the decay timecourse of [Ca2+]res and hence influence the efficacy of synaptic plasticity. The predominant pathways that determine this timecourse are: (1) entry via voltage-gated Ca2+ channels (VGCCs); (2) passive diffusion or buffering; (3) Ca2+-dependent Ca2+ release (CICR) through ryanodine receptors in the endoplasmic reticulum (ER); (4) uptake into the ER by the sarco-endoplasmic reticulum Ca2+-ATPase (SERCA); (5) extrusion across the plasma membrane by either the plasma membrane Na/Ca exchanger (NCX) or the plasma membrane Ca2+-ATPase (PMCA); and (6) uptake into mitochondria by the mitochondrial Ca2+ uniporter (MCU) [6,7]. Contributions to the timecourse of [Ca2+]res by presynaptic Ca2+ buffers and by uptake and release from the ER have been an important focus in previous studies of the involvement of [Ca2+]res in short-term plasticity.
Ca2+ buffering by endogenous and exogenously introduced buffers is a ubiquitous passive influence on the dispersion of the Ca2+ microdomain and on the timecourse of [Ca2+]res [8].In addition, saturation of these buffers can make an important contribution to short-term facilitation in some presynaptic terminals, although its contribution appears to be minimal in the Schaffer collateral terminals in the CA1 subfield of the hippocampus [5,9]. Intracellular Ca2+ stores play a crucial role in many facets of neuronal function including synaptic plasticity [10]. Uptake of Ca2+ into the presynaptic ER and CICR from these Ca2+ stores provides a potentially important modulatory mechanism for neurotransmitter release, although the contribution of presynaptic Ca2+ stores to synaptic plasticity depends on the stimulus conditions and the specific synaptic terminal involved. For instance, there is a clear indication of Ca2+ stores involvement in long-term synaptic plasticity in the hippocampus including long-term potentiation (LTP) [11] and long-term depression (LTD) [12] and this is consistent with the finding that Ca2+ stores make a significant contribution to [Ca2+]res following trains of presynaptic action potentials [13]. The degree of involvement of presynaptic Ca2+ stores in short-term plasticity appears to be dependent on the specific synapse type. Thus, mossy fiber terminals in the CA3 hippocampal subfield exhibit CICR-dependent short-term facilitation [14], while other synapses of these fibers do not exhibit the same CICR-dependent mechanism [15]. Additionally, CICR has been found to have no involvement in short-term plasticity in Schaffer collateral terminals on CA1 pyramidal neurons in young rats [16], although another study of these same synapses found CICR involvement in short-term plasticity of functional, but not silent synapses [17].
In this study, we have investigated the contributions of VGCCs, CICR, SERCA, NCX, PMCA, and MCU to the timecourse of [Ca2+]res. We have focused primarily on the slow component of [Ca2+]res decay, since this component reflects [Ca2+]res clearance processes, which occur on the time scale of short-term synaptic plasticity. We show that there is a slowing of the decay timecourse of [Ca2+]res during the second of paired pulses that results from the decrease of a transport-dependent [Ca2+]pre clearance process. Presynaptic caffeine-sensitive Ca2+ stores do not contain measurable Ca2+ in the unstimulated presynaptic terminal, although these stores can take up [Ca2+]pre during high frequency trains of stimuli. We find a minimal contribution of VGCCs, NCX, PMCA, or MCU in the observed difference of [Ca2+]res decay timecourse between the first and second of paired pulses. However, a limitation of the rate of the SERCA pump following the first presynaptic stimulus is responsible for a large portion of the observed slowing of [Ca2+]res decay. Our kinetic modeling studies are consistent with a major role for SERCA and a significant capacity for ER Ca2+ storage during [Ca2+]pre clearance in Schaffer collateral terminals. Furthermore, SERCA clearance of [Ca2+]res appears to be an important contributory factor in the genesis to short-term plasticity.
2. Methods
2.1. Slice preparation and field potential recordings
Experiments were performed in coronal hippocampal slices from approximately 50 day-old Sprague-Dawley rats as previously described [5]. Briefly, animals were deeply anesthetized with an i.p. injection of 250 mg/kg ketamine, brains were rapidly removed, and slices were cut at 300μm with a vibroslicer (Pelco 101, St. Louis, MO) in an ice bath with a cutting solution containing (in mM): 220 sucrose, 3 KCl, 1.2 NaH2PO4, 26 NaHCO3, 12 MgSO4, 0.2 CaCl2, 10 glucose, and 0.01 mg/ml ketamine equilibrated with 95%O2/5%CO2. Slices were then transferred to artificial cerebrospinal fluid (ACSF) containing (in mM): 124 NaCl, 5 KCl, 1.25 NaH2PO4, 1.3 MgSO4, 26 NaHCO3, 2.5 CaCl2, and 10 glucose equilibrated with 95%O2/5%CO2 at 30 °C for 1 hour and then maintained at room temperature until transfer to the recording chamber (Warner Instruments, Hamden, CT), which was maintained at 32 °C, and continuously perfused at 2 ml/min (bath exchange τ = 70 s) with ACSF saturated with 95%O2/5%CO2. In ACSF where Ca2+ was replaced with Ba2+, MgCl2 was substituted for MgSO4. We used standard electrophysiological techniques that are well established in our laboratory for slice field potential recordings in the stratum pyramidale of the hippocampus [5] using a Multiclamp 700B amplifier (Axon Instruments, Union City, CA), digitized at 500 KHz and filtered at 2 KHz with a Digidata 1322A interface using pCLAMP 10 software (Axon Instruments). Presynaptic constant current pulses (150μs duration) were applied to Schaffer collateral fibers with an Iso-Flex constant current stimulator (A.M.P.I Instruments, Jerusalem, Israel) through a concentric bipolar electrode (FHC, Bowdoinham, ME) at a current adjusted to produce ~50% of the maximum fEPSP population spike amplitude. For simplicity, we have used the abbreviation R1 for the first response to a pair of stimuli and R2 for the second response of the pair. All experiments were approved by the Institutional Animal Care and Use Committee at the University of New Mexico Health Sciences Center and conformed with NIH guidelines.
2.2. Presynaptic Ca2+ imaging
Presynaptic fibers were filled with the Ca2+ fluorophore, Mg Green AM, Fura-2 AM, or FuraFF AM using an established technique that allowed simultaneous measurements of presynapic [Ca2+]i and postsynaptic fEPSP [5,18–21]. In a small number of instances, either the presynaptic or postsynaptic recording was not successful, but the data from the successful component were still included. To minimize the effect exogenous buffers, we used Mg-Green or FuraFF, with Ca2+ binding KDs between 5 and 6μM for experiments in which we measured the timecourse of ΔF/F0 decay [19,22]; however, in some experiments where the rapid decay timecourse was not being assessed, we improved the sensitivity of the fluorescence measurements by using the higher affinity fluorophore Fura-2. Briefly, an ejection electrode (5–10μm tip diameter) containing the fluorophore (0.9mM Mg-Green AM, Fura-2 AM, or Fura-FF AM (Invitrogen, Eugene, OR); 10% v/v DMSO; 1% v/v pluronic acid in ACSF) was inserted into the fiber pathway between the stimulating electrode and the presynaptic terminal field to be observed. While monitoring the emission image during excitation at 490nm for Mg-Green or 350nm for Fura-2 or Fura-FF, an air pressure pulse was applied with a syringe to the ejection electrode until a small bright spot (estimated to be ≅1μl) was observed in the fiber pathway. The slice was then maintained with a 2 ml/min flow of oxygenated ACSF at 32°C for ~1 h to allow intracellular diffusion of the dye to the presynaptic imaging site ~500μm away from the ejection site. For single wavelength studies with Mg-Green or Fura-FF, the excitation light was then reduced with a diaphragm in the epi-illumination path to a 100–200μm diameter spot and the emitted light was measured from this Schaffer collateral terminal field with a photomultiplier tube (PMT). For ratiometric studies with Fura-2, randomly chosen regions of interest were analyzed within the Schaffer collateral terminal field in stratum radiatum. A single stimulus or pairs of stimuli were delivered orthodromically at 0.067 Hz by a Master 8 pulse generator (A.M.P.I Instruments) under control of the imaging system (T.I.L.L. Photonics, Pleasanton, CA). Fluorescent responses are reported as the ratio of the change in fluorescence to the pre-stimulus fluorescence (ΔF/F0) for Mg-Green or Fura-FF studies or as the change in 350/380 nm excitation ratios (ΔR/R0) for Fura-2 studies. The fluorescent signals were corrected for bleaching by subtracting a linear baseline and were inverted so that increasing [Ca2+]pre produced an upward deflection. Time integrals of the ΔF/F0 (∫ΔF/F0) were calculated to provide a measure of total presynaptic [Ca2+]i during the period of short-term facilitation [5].
We used two tests to demonstrate that the measured ΔF/F0 signal was consistent with a [Ca2+] response predominately from the presynaptic Schaffer collateral axons and axon terminals [5,19]. First, in the presence of 10μM CNQX, 25μM D-AP5, and 20μM bicuculline, the fEPSP was blocked, while the presynaptic fiber volley and ΔF/F0 signal were left unchanged, thus the ΔF/F0 signal was not a postsynaptic response. Second, subsequent addition of 600 nM TTX blocked both the presynaptic fiber volley and the ΔF/F0 signal arguing against direct stimulation of inadvertently filled postsynaptic dendrites. Because of the noise inherent in measurements with the low affinity indicators, it was necessary to average five fluorescence responses and to filter the PMT signal at 1 kHz. Some signals were further post filtered with a Gaussian filter with a 3 dB cut off at 300 Hz. Paired-pulse and single-pulse responses were collected under each condition and average single-pulse responses were subtracted from average paired-pulse responses to generate the Ca2+ residual-subtracted R2 response (ΔR2 [Ca2+]res)as described in the Results.
In control experiments with sister slices in ACSF, we compared Fura-FF and Mg-Green responses to single pulses. While the slow component of the decay was similar, there was a reduction of the fast component in the first 25ms in the Fura-FF data perhaps due to a difference in kinetics of the fluorophores; we did not further pursue the mechanism of this difference. We were unable to accurately fit Fura-FF ΔF/F0 decay signals with a double exponential as we did with Mg-Green signals and the decay τ for the single exponential fit to the Fura-FF decay was about 27% faster than the τs for the double exponential fit to the Mg-Green traces.
2.3. Drugs
Concentrated stock solutions of drugs were mixed at a minimum 1000× concentration in appropriate vehicles, stored frozen in aliquots, and diluted on the day of the experiment to the appropriate concentration in ACSF. Thapsigargin was obtained from Tocris (Ellisville, MO), while nimodipine, 5(6) carboxyeosin diacetate, cyclopiazonic acid, carbonyl cyanide 4-(trifluoromethoxy)phenylhydrazone (FCCP), oligomycin, and benzamil were from Sigma-Aldrich (St. Louis, MO). Absorption spectra were obtained for all drugs at the appropriate concentration in ACSF. With the exception discussed below for carboxyeosin, none of the drugs showed significant absorbance at either the excitation or emission wavelength of the relevant indicators. Drugs were applied through a bath perfusion system and a minimum of 2.5 bath exchanges was allowed after changing solutions before recording. Control experiments at equivalent DMSO concentrations showed no effect of vehicle alone.
2.4. Curve fitting and statistics
Data for the decay from the peak of ΔF/F0 with Mg-Green were fit using a least squares regression fit to:
| (1) |
where A is the initial value of ΔF/F0, τf and τs are respectively the fast and slow time constants of decay, and B is the fraction of the curve fit with τf.
Data for the decay from the peak of ΔF/F0 with Fura-FF were fit using a least squares regression fit to:
| (2) |
where C is the initial value of ΔF/F0 and τ is the time constant of decay.
Data for complete ΔF/F0 traces in the nimodipine experiments were fit using a least squares regression fit to:
| (3) |
where D is the initial value of ΔF/F0, τrise is the rising time constant, τf1 and τs1 are respectively the fast and slow time constants of decay, E is the ΔF/F0 offset, and n determines the steepness of the rise.
Data are presented as mean±S.E.M. Students t-tests and ANOVAs were calculated with SPSS (SPSS Inc., Chicago, IL) or Pro-Stat (Poly Software, Pearl River, NY) statistics packages. Statistical significance was determined at p < 0.05 and indicated as: *p < 0.05,**p < 0.01, ***p < 0.005, ****p < 0.001.
3. Results
The mechanisms responsible for the regulation of presynaptic [Ca2+]res, have been well characterized in certain specialized synapses, but they are less well understood in the more representative small presynaptic terminals of the CNS [23]. We therefore measured [Ca2+]res during paired stimuli at a 50ms interpulse interval in Schaffer collateral terminals in stratum radiatum of the CA1subfield of the hippocampus. This interpulse interval was selected because it elicits a form of short-term plasticity that is manifest as an enhancement of neurotransmission, which has been associated with learning and memory. As expected, the peak [Ca2+]res following the second pulse (R2) was larger than that following the first pulse (R1) because of persisting [Ca2+]res from R1 (Fig. 1A1). To obtain an independent measure of [Ca2+]res during the second pulse, we subtracted the [Ca2+]res produced by a single pulse (P1) from R2 [Ca2+]res to yield ΔR2 [Ca2+]res. (Note, the distinction between P1 and R1 [Ca2+]res is simply that P1 [Ca2+]res decays completely while R1 [Ca2+]res decay is interrupted by the onset of R2.) As we have shown previously, there is a significant increase in the integral of ΔR2 [Ca2+]res over that of P1 [Ca2+]res (Fig. 1A2 and B). When measured with the low affinity indicator Mg-Green, the [Ca2+]res decay timecourse for P1, and ΔR2 are accurately fit with double exponentials, which yield fast and slow time constants that differ by approximately an order of magnitude [5,7]. The larger integral of ΔR2 [Ca2+]res results largely from an increase in the slow time constant (Fig. 1C), although there is also a smaller and less consistent increase in the fast time constant for this decay. There is, however, very little change in the magnitude of the relative contributions of the fast and slow components to the total [Ca2+]res decay [5].
Fig. 1.

Presynaptic [Ca2+]i response to paired pulses. (A1). Single pulse (black) and paired pulses (gray) at 50ms IPI. (A2). Single pulse ΔF/F0 (black) and ΔR2 ΔF/F0 (gray) with superimposed ∫ΔF/F0. (B) Average P1 ∫ΔF/F0 (black) and ΔR2 ∫ΔF/F0 (gray) for ACSF controls. (Paired t-test, n = 44). (C) Average slow decay time constant, τs, for R1 ΔF/F0 (black) and ΔR2 ΔF/F0 (gray) for ACSF controls (Paired t-test, n = 27, Mg-Green).
3.1. Contribution of transport-dependent processes to [Ca2+]res
Barium ions readily permeate Ca2+ channels, but they are ineffectively eliminated from the cytoplasm of the presynaptic terminal by Ca2+ transporters (e.g. [24]). Thus a comparison of the time-course of the fluorescent indicator signals in Ba2+ vs. Ca2+ can be used to assess the transport-dependent components of [Ca2+]res clearance. We measured simultaneously presynaptic ΔF/F0 and the postsynaptic fEPSP and, as has been well established at many synapses (e.g. [25]), observed that replacing Ca2+ with Ba2+ in the ACSF quickly and reversibly eliminated the fEPSP, although the transient ΔF/F0 response persisted (Fig. 2A). The magnitude, but not the timecourse, of this presynaptic ΔF/F0 signal is affected by the relative permeabilities of Ca channels to Ba2+ vs. Ca2+ and by the differential intensities of fluorescence emission of Mg-Green to the two divalent ions. The representative traces in Fig. 2B show the typical increase in the time constant of the slow component (τs)of the ΔF/F0 decay and the almost complete elimination of the fast component (τf) of this signal. This reversible increase in τs and reduction in the percent of τf (B in Eq. (1)) is summarized in Fig. 2C.
Fig. 2.

Barium blocks postsynaptic fEPSPs and slows ΔF/F0 decay (A) Top: fEPSP normalized to initial value of R1 ACSF; R1(black); R2 (gray); Bottom: %ΔF/F0 R1 (black); ΔR2 (gray). (B) Representative P1%ΔF/F0 decay traces (gray) with double exponential fit using equation 1 (black). Top: ACSF, middle, Ba2+ ACSF, bottom, wash. (C) Summary of parameters from double exponential fit to P1 ΔF/F0 decay. Top: τs. Bottom: % fast component calculated as 100×B in Eq. (1). There was also a significant decrease in the initial value of ΔF/F0 (A in Eq. (1)) in Ba2+, p < 0.005; but no change in τf, p = 0.595 (not shown). (One-way ANOVA, Top: F2,27 = 10.507, Bottom: F2,27 = 9.816, Bonferroni post hoc, n = 10). (D) ΔR2 ∫ΔF/F0 in ACSF and in Ba2+ ACSF. (Amplitudes of the Ca2+ and Ba2+ ΔF/F0 signals cannot be compared directly so each was normalized to its respective R1 ΔF/F0.) (One-sample t-test against theoretical mean of 1.0, Ba2+ p = 0.23, n = 4). (E) Arrhenius plot of ln (ΔR2 ∫ΔF/F0/P1 ∫ΔF/F0) vs. 1/temperature for 7 slices each measured at 4 temperatures. Slopes, m, were used to calculate Q10 as: Q10 = e[−10m/T1(T1+10)1]. Average Q10 = 2.94±0.64. (p < 0.05 by one sample t-test against a theoretical mean of 1.3 which is the minimum expected value for an active process, n = 7, Mg-Green).
Although it was not feasible to directly compare absolute values of the ∫ΔF/F0 in Ca2+ and Ba2+ when each ∫ΔF/F0 record was normalized to its respective value for P1, there was a significant reduction in the difference between P1 ∫ΔF/F0 and ΔR2 ∫ΔF/F0 when comparing Ca2+ ACSF to Ba2+ ACSF (Fig. 2D) suggesting that a transport-dependent process makes an important contribution to the difference in ∫ΔF/F0.
To further test the role of processes other than diffusion or Ca2+ buffering as the mechanism for the difference between P1 ∫ΔF/F0 and ΔR2 ∫ΔF/F0, we measured these integrals at temperatures between 23 and 32°C. From the slopes of the Arrhenius plots of the logarithm of the ratio of ΔR2 ∫ΔF/F0 to P1 ∫ΔF/F0 vs. the reciprocal of temperature (Fig. 2E), we determined an average Q10 = 2.94 ± 0.64 for the underlying process. This is significantly above the minimum expected Q10 = 1.3 for an active process. In contrast, we used the same technique to measure the temperature dependence of the P1 ∫ΔF/F0 decay in Ba2+ ACSF and determined a Q10 = 1.08 ± 0.32 (n = 5), which is not significantly different from the expected Q10 for a passive temperature-independent process (data not shown).
Together these data indicate that a transport-dependent process rather than changes in diffusion or buffering is more effective during R1 than during R2 and this causes R1 ΔF/F0 to decay more rapidly than ΔR2 ΔF/F0. The following experiments were designed to investigate the nature of this process.
3.2. Requirement for preloading of the ER
In many cell types, thapsigargin, an irreversible SERCA pump inhibitor, causes a rapid rise in [Ca2+]i due to an uncompensated leak of Ca2+ from the ER lumen into the cytoplasm. Even using the more sensitive fluorophore Fura-2, we were unable to detect a significant increase in presynaptic ΔR/R0 in the presence of 3μM thapsigargin (Fig. 3A). However, subsequent depolarization with 40 mM K+ to activate VGCCs led to the expected dramatic increase in ΔR/R0. We next used 20 mM caffeine, which increases the Ca2+ sensitivity of ryanodine receptors and causes release of Ca2+ from ER stores, and again we did not find a significant increase in ΔR/R0. However, when we preceded 10 mM caffeine application by preloading the ER stores with a brief depolarization induced with 40 mM K+, we did observe a significant caffeine-dependent increase in ΔR/R0 (Fig. 3B). Importantly, there was no increase in ΔR/R0 following the same preloading protocol when no caffeine was applied. Finally, we investigated the effect of repetitive presynaptic stimuli on the loading of ER stores. Two 100 Hz trains of 20 pulses separated by 15 s led to a maintained increase in ΔR/R0, but there was no further increase after application of 10 mM caffeine. Two higher frequency, 500 Hz trains of 20 pulses, however produced a maintained increase in ΔR/R0 that was further increased by the subsequent addition of 10 mM caffeine (Fig. 3C). From these experiments, we conclude that neither uncompensated leak following block of SERCA nor ryanodine receptor activation is capable of releasing measurable Ca2+ from ER stores in the basal, unstimulated state of these presynaptic terminals in the adult hippocampus. However, depolarization or high frequency stimulation is capable of filling these stores sufficiently for caffeine to cause a measurable Ca2+ release. Our preloading experiments further suggest that the presynaptic ER is capable of sequestering a considerably greater cytoplasmic Ca2+ load than is produced by pairs of pulses.
Fig. 3.

Filling state of presynaptic Ca2+ stores. (A) Bath application of 3μM thapsigargin. Response to 40mM K+ was used as an indication of successful Ca2+ responses in all experiments in this Figure, but is shown only in this panel. (n = 5). (B) Bath application of 20mM caffeine with no preload (black filled circles, n = 6) or bath application of 10mM caffeine following 30 s preload in 40mM K+ (gray filled squares, n = 6). Comparing the first and the last 1min periods between the preloaded and no preloaded conditions with ANOVA (F3,12 = 187.69, Bonferroni post hoc) showed p = 0.169 for the first period in ACSF and p < 0.001 for the last period in 10 or 20mM caffeine. Responses to 40mM K+ preload, but without 10mM caffeine (not shown) were indistinguishable from no preload condition. (n=3) C Bath application of 10mM caffeine following high frequency stimulation at vertical arrow: 2×20 @ 500 Hz then caffeine (gray filled squares, n = 6); 2×20 @ 500 Hz no caffeine (black open squares, n = 4); 2×20 @100 Hz then caffeine (gray open circles, n = 6); no stim then caffeine (black filled circles, n = 12). Comparing the first and the last 1minute periods of the 2×20 @ 500 Hz records between caffeine and no caffeine with ANOVA (F3,12 = 601.43, Bonferroni post hoc) showed p = 0.891 for caffeine vs. no caffeine in the first period and p < 0.001 for the these two conditions in the last period. (Fura-2 ratio images (350/380 nm) were taken every 15 s.).
3.3. Contribution of sarco-endoplasmic reticulum Ca2+-ATPase (SERCA) to [Ca2+]res
Since caffeine-sensitive Ca2+ stores could be filled following presynaptic Ca2+ influx (Fig. 3B and C), it was apparent that SERCA pumps were functional in the presynaptic terminals of our preparation. We thus reasoned that the increase in ΔR2 ∫ΔF/F0 could result from a limitation imposed by the rate-determining step of the SERCA pump in clearing the increased [Ca2+]pre introduced by the second of paired Ca2+ influxes. As can be seen in the example in Fig. 4A, thapsigargin caused an increase in the P1 ∫ΔF/F0 so that it approximately equaled ΔR2 ∫ΔF/F0. The summary data in Fig. 4B indicate that, when normalized to the ACSF P1 ∫ΔF/F0, there is not only the expected significant increase in ΔR2 ∫ΔF/F0 in both ACSF and thapsigargin, but there is also an increase in P1 ∫ΔF/F0 in thapsigargin. As a consequence, there was no significant difference between P1 ∫ΔF/F0 and ΔR2 ∫ΔF/F0. We also carried out confirmatory experiments with cyclopiazonic acid, which is another specific inhibitor of SERCA pumps (see Fig. 5E). Again, we found that P1 ∫ΔF/F0 in cyclopiazonic acid was increased so that it approximately equaled ΔR2 ∫ΔF/F0.
Fig. 4.

Block of SERCA pumps increases P1 ∫ΔF/F0. (A) Representative %ΔF/F0 and ∫%ΔF/F0 traces, (A1) ACSF. P1 (black); ΔR2 (gray), (A2) 3μM thapsigargin. P1 (black); ΔR2 (gray). (∫%ΔF/F0 scale units are: %ΔF/F0 × ms) (B) Maximum ∫ΔF/F0 following paired pulses in 3μM thapsigargin normalized to maximum P1 ∫ΔF/F0 in ACSF. (One-sample t-test against theoretical mean of 1.0, n = 10.) (C) τs for fits to equation 1 following a single pulse in 3μM thapsigargin. In addition there was no significant difference in: peak %ΔF/F0, p = 0.183; τf, p = 0.254; or %τf, p = 0.858 (not shown). (Paired t-test, n = 10, (Mg-Green.).
Fig. 5.

Contribution of plasma membrane Ca2+ flux to [Ca2+]pre (A and B) Representative %ΔF/F0 and ∫%ΔF/F0 traces (P1, black; ΔR2, gray). (A1) 10μM nimodipine, (A2) 10μM nimodipine + 100μM benzamil, (B1) 10μM cyclopiazonic acid, (B2). 10μM cyclopiazonic acid + 40μM carboxyeosine. (C) Peak ∫ΔF/F0 normalized to ACSF P1 ∫ΔF/F0 following paired pulses in 10μM nimodipine. (One-sample t-test against theoretical mean of 1.0, P1 nimodipine p = 0.28, n = 11, Mg Green). (D) Maximum ∫ΔF/F0 following paired pulses in 100μM benzamil in the presence of 10μM nimodipine normalized to maximum P1 ∫ΔF/F0 in ACSF for the same slice. (One-sample t-test against theoretical mean of 1.0, P1 nimodipine p = 0.27, P1 nimodipine + benzamil p = 0.45, n = 11, Mg-Green) (E) Peak ∫ΔF/F0 normalized to P1 ∫ΔF/F0 in ACSF for each slice following paired pulses in 40μM carboxyeosine in the presence of 10μM cyclopiazonic acid. (ΔR2 ∫ΔF/F0 in ACSF was included for comparison.) (One-sample t-test against theoretical mean of 1.0, n = 7, Fura-FF) (F) [Ca2+]res timecourse in ACSF (n = 19), 2.5μg/ml oligomycin (n = 10), and following subsequent addition of 1μM FCCP (n = 16) (F1). τs for [Ca2+]res decay for P1 ΔF/F0 and ΔR2 ΔF/F0 decay (One-way ANOVA, F5,84 = 10.14 with Bonferroni post hoc, Mg Green). (F2) Percent slow component of [Ca2+]res decay calculated as 100×A(1−B) from Eq. (1) (One-sample t-test against theoretical mean of 100%) (F3). τf for [Ca2+]res decay for P1 ΔF/F0 and ΔR2 ΔF/F0 decay. There was no significant of drug on τf. One-way ANOVA, F5,78 = 0.9787, P = 0.4362).
As shown in Fig. 4C, when the decay phase of ΔF/F0 following a single pulse was fit with a double exponential (Eq. (1)), there was a significant increase of τs in thapsigargin. There was also a small increase in the initial amplitude of ΔF/F0 that was quite pronounced in some slices while changes in τf and in %τf (B in equation 1) were neither consistent nor significant. In control experiments, in which the vehicle DMSO was applied alone for an equivalent time, there was no significant change in either P1 ∫ΔF/F0 (p = 0.65) or ΔR2 ∫ΔF/F0 (p = 0.63) (data not shown, n = 7). Our interpretation of these results is that SERCA pumps play an important role in [Ca2+]res clearance after R1 and that they become rate limited thereby increasing ΔR2 ∫ΔF/F0. As a result, thapsigargin increases P1 ∫ΔF/F0 and eliminates its difference from ΔR2 ∫ΔF/F0.
3.4. Contribution of plasma membrane Ca2+ flux to [Ca2+]res
Presynaptic P/Q- N-, and R-type VGCCs play an essential role in transmitter release [26] and in the generation of [Ca2+]res. Although L-type VGCCs are not involved in fast synaptic transmission, there is evidence that they may contribute to changes in synaptic efficacy [27,28] and an indication of coupling between L-type VGCCs and RyRs [29]. Therefore we considered whether activation of these channels could play a role in the increase of ΔR2 ∫ΔF/F0 by measuring the ∫ΔF/F0 in the presence of the selective L-type VGCC blocker nimodipine (10μM). This treatment did not cause a significant change in the shape of the rising portion of the ∫ΔF/F0 response when we fit the entire ΔF/F0 trace with equation 3 (data not shown). When we fit only the falling portion of ΔF/F0 with equation 1, there was a significant 22% decrease in τf, although none of the other parameters–in particular τs–was significantly changed. Furthermore, the increase in ΔR2 ∫ΔF/F0 over P1 ∫ΔF/F0 persisted following block of L-type VGCCs (Fig. 5A1 and C). We interpret this to mean that there is not an important contribution of L-type VGCCs to the increase of ΔR2 ∫ΔF/F0.
We initially attempted to reduce NCX by replacing external Na+ with Li+, but found that in some slices this led to the elimination of ΔF/F0 responses, probably due to secondary effects of Na+ depletion causing spreading depression in the slice [30]. We thus assessed the role of NCX in the increase of ΔR2 ∫ΔF/F0 with the selective blocker of NCX, 100μM benzamil. A complication of using benzamil, however, is that it has been reported to also block L-type VGCCs [31] so we carried out these experiments in the presence of the L-type VGCC blocker, nimodipine. Block of NCX neither significantly altered P1 ∫ΔF/F0 nor did it eliminate the increase of ΔR2 ∫ΔF/F0 over P1 ∫ΔF/F0 (Fig. 5A2 and D). We conclude that NCX is not an important contributor to [Ca2+]res clearance during pairs of pulses at 50ms interpulse interval and that its partial saturation or reduction in effectiveness is not a major factor in the increase in ΔR2 ∫ΔF/F0.
We used 40μM 5(6)-carboxyeosin diacetate to block the PMCA pumps in order to assess the contribution of this transmembrane pathway to [Ca2+]res clearance. Carboxyeosin has a fluorescence emission (542 nm), which is similar to that for Mg-Green, and this produced a background emission that saturated the PMT. Thus, we chose to conduct these experiments with Fura-FF, which has a shorter emission wavelength and a KD for Ca2+ (5.5μM) that is similar to that of Mg-Green KD (6μM). As discussed in the Methods, the fast component of presynaptic ΔF/F0 signal in Fura-FF was reduced over that seen in sister slices with Mg-Green and thus the Fura-FF responses were best fit with a single exponential (equation 2). In addition, there is evidence that carboxyeosin can inhibit SERCA pumps [32] so 10μM cyclopiazonic acid was used throughout these experiments to block SERCA pumps. Fig. 5B1 and 5E show expected control conditions in which the difference P1 ∫ΔF/F0 and ΔR2 ∫ΔF/F0 was eliminated as a result of block of SERCA pumps by cyclopiazonic acid. Addition of 40μM carboxyeosin did not produce an additional change in either P1 ∫ΔF/F0 or in ΔR2 ∫ΔF/F0 (Fig. 5B2 and E).
3.5. Contribution of mitochondrial Ca2+ uniporter (MCU) to [Ca2+]res
In order to assess the contribution of the MCU to [Ca2+]res clearance, we were constrained to using the indirect approach of abolishing the mitochondrial membrane potential (Δψm) with the protonopore, FCCP (1μM), [33]. In initial experiments, FCCP alone led to a significant decrease in both the P1 ∫ΔF/F0 and the ΔR2 ∫ΔF/F0 and it also eliminated the postsynaptic fEPSP response. We decided therefore to include 2.5μg/ml oligomycin, an inhibitor of the F0 portion of mitochondrial H+-ATP-synthase, to prevent rapid ATP consumption following dissipation of the H+ gradient by FCCP [34]. Surprisingly, oligomycin alone eliminated the expected increase of ΔR2 ∫ΔF/F0 over P1 ∫ΔF/F0; however, we observed further that this effect of oligomycin resulted from a significantly decreased contribution of the slow component to the overall ΔF/F0 decay (Fig. 5F2) with no significant effect on τf (Fig. 5F3). Importantly, when we determined τs in oligomycin or in oligomycin plus 1μM FCCP, we found the usual increase in τs of the decay of ΔR2 ΔF/F0 over that of R1 ΔF/F0 (Fig. 5F1). As we will consider further in the Discussion, we interpret these results to reflect largely an action of oligomycin on mitochondrial ATP production rather than a major contribution of the MCU to [Ca2+]res clearance.
3.6. Relationship of [Ca2+]res clearance and short-term facilitation
To further evaluate the role of [Ca2+]res clearance in short-term facilitation of synaptic transmission, postsynaptic responses were measured simultaneously with the presynaptic ΔF/F0 signal. We anticipated that changes in the timecourse of [Ca2+]res clearance could affect the magnitude of short-term facilitation. In particular, manipulations that cause an increase in τs should result in greater paired-pulse facilitation (PPF) [5]. Thapsigargin or cyclopiazonic acid with carboxeyeosine, either of which increased P1 ∫ΔF/F0 (Fig. 4B and Fig. 5E), caused in a significant increase in PPF (Fig. 6). In contrast, nimodipine plus benzamil or oligomycin plus FCCP, neither of which increased P1 ∫ΔF/F0 (Fig. 5B and Fig. 5D), did not significantly affect PPF (Fig. 6B).
Fig. 6.
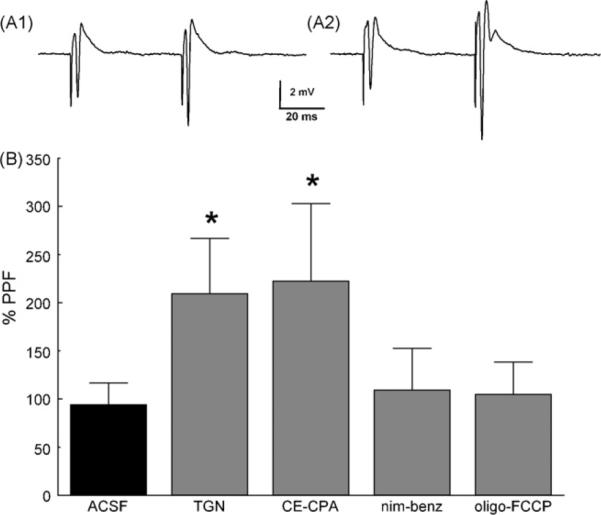
Effect of [Ca2+]res clearance pathways on paired pulse facilitation. (A1) PPF at 50ms interpulse interval in ACSF. (A2) PPF in the same slice as A1 following a 15 min exposure to 3μM thapsigargin. (Stimulus artifacts have been truncated for clarity.) (B) Average PPF in ACSF (n = 41), 3μM thapsigargin (TGN, n = 17), 40μM carboxyeosine plus 10μM cyclopiazonic acid (CE-CPA, n = 11), 10μM nimodipine plus 100μM benzamil (nim-benz, n = 20), 2.5μg/ml oligomycin plus 1μM FCCP (oligo-FCCP, n = 25). (One-way ANOVA, F4,110 = 1.965 with Bonferroni post hoc.).
3.7. Modeling of [Ca2+]res clearance
We reported previously [5] that the increase of ΔR2 ∫ΔF/F0, is primarily due to an increase in τs of [Ca2+]res clearance (Fig. 1). Our observations that this clearance timecourse is best fit with a double exponential and that SERCA pumps play a central role in the process were important guidelines for creating a simplified model for [Ca2+]res clearance (see Appendix A).
We approximated passive clearance processes as a single component, which we estimated from our experiments in Ba2+ ACSF. We began with a complete kinetic model for [Ca2+]res clearance, but then reduced it to only those kinetic components associated with passive diffusion and ER Ca2+ flux (Fig. 7A bold). We assumed that the rate limiting steps of SERCA transport were associated with Ca2+ binding in the cytoplasm and ER lumen and not with the kinetics of ATP-dependent translocation across the ER membrane. We used the Potterswheel program [35] to perform a sensitivity analysis and took special note of those parameters that were most sensitive to producing an accurate fit of the ΔF/F0 data. The kinetic model was then fit to ΔF/F0 data from Fig. 1A 1 using numerical integration with MATLAB® software (MathWorks, Natick, Massachusetts) (Fig. 7B). The same initial boundary conditions were fit to 23 additional ΔF/F0 traces of Ca2+ influx following pairs of pulses separated by 50ms that were recorded under control conditions in ACSF. The ΔF/F0 data were scaled to the estimated Ca2+ influx during a single pulse and average parameters were determined that provided timecourse information for binding of cytoplasmic Ca2+ to SERCA (Fig. 7C). To further test this model, we fit [Ca2+]res data resulting from a short train of five pulses in order to predict the timecourse of ER Ca2+ buffering (Fig. 7D). The ΔF/F0 data were scaled as in Fig. 7C in order to predict binding of Ca2+ to SERCA and the concentration of buffered ER Ca2+ ([CaB]ER).
Fig. 7.

Ca2+ clearance kinetics. (A) Ca2+ clearance pathways under consideration in this study 1. VGCC, 2. buffering (B) and diffusion, 3. RyR, 4. SERCA, 5a. PMCA, 5b NCX, 6. MCU (see Section 1). Pathways indicated in bold are included in the kinetic model. (B) Representative trace from Fig. 1A1 fit with the reduced model including only buffer and SERCA/ER components (R2 = 0.95). (C) Average data from fits to 23 [Ca2+]res traces in ACSF. Black, predicted [Ca2+]cyt; gray, predicted free [SERCA]. (D) Top panel: fit to [Ca2+]res during a train of 5 pulses at 50ms IPI (R2 = 0.94). Middle panel: predicted free cytoplasmic SERCA Ca2+ binding sites. Bottom panel: predicted change of ER buffered Ca2+.
The applicability of the reduced kinetic model to the process of [Ca2+]res clearance is demonstrated in four ways. First, the model generates a fit to the [Ca2+]res decay data that is comparable to that of a double exponential. For instance, the decay portion of the ΔF/F0 data for the single pulse of Fig. 1A1 yields an R2 = 0.92 when fit with the model and an R2 = 0.93 when fit with a double exponential. Second, the model predicts the observed increase of ΔR2 ∫ΔF/F0 over P1 ∫ΔF/F0. For example, the modeled [Ca2+]res for P1 and ΔR2 in Fig. 7C gives a ratio of ΔR2 ∫ΔF/F0 to P1 ∫ΔF/F0 of 1.34, while the average value of this ratio for the data from each of the 23 individual experiments is 1.33. Third, consistent with our data, the model predicts a progressive limitation in the availability of SERCA for binding cytoplasmic free Ca2+ ([Ca2+]cyt) for transport into the ER (Fig. 7C and D). Fourth, also consistent with our data, the model predicts that ER Ca2+ buffer is not saturated over short trains of pulses (Fig. 7D).
4. Discussion
In a previous study of the role of Ca2+ dynamics in governing short-term facilitation, we showed that the ΔR2 ∫ΔF/F0 was increased over P1 ∫ΔF/F0 and that this increased presynaptic [Ca2+]res signal was due largely to an increase in τs for ΔF/F0 decay [5]. We proposed that this was indicative of changes in the buffering, sequestering, or extrusion of Ca2+ in the presynaptic terminals and designed these studies to investigate contributions from these mechanisms. In order to assess the contributions of the processes that regulate [Ca2+]pre on the timescale of short-term synaptic plasticity, we used pharmacological agents to independently block individual influx and clearance pathways and then measured the effects on R1 and ΔR2 ΔF/F0. While some of our results were complicated by significant interactions of certain drugs on these pathways, we were able to clearly delineate a major role for the SERCA pathway into the ER on the timecourse of [Ca2+]res clearance. In addition, our ΔF/F0 data were accurately fit with a model reflecting SERCA kinetics under conditions where there was a reduction during R2 of available SERCA Ca2+ binding for the removal of free Ca2+ from the cytoplasm. Importantly, inhibition of this pathway has important consequences in short-term plasticity.
When Ba2+ was substituted for Ca2+ in the ACSF, the portion of ΔF/F0 decay fit by a fast exponential was approximately halved (Fig. 2C), τs was approximately doubled (Fig. 2C), and the enhancement of ΔR2 ∫ΔF/F0 was eliminated (Fig. 2D). The temperature dependence of the increase in the ΔR2 ∫ΔF/F0 yielded a Q10, which was significantly above the minimum expected for an active process (Fig 2E). Thapsigargin did not produce a significant increase in [Ca2+]pre (Fig. 3A) and caffeine did not cause an increase in [Ca2+]pre unless the presynaptic terminals had been preloaded with either high K+ or by high frequency stimulation (Fig. 3 B and C). Neither nimodipine (Fig. 5C) nor benzamil (Fig. 5D) significantly altered the enhancement of ΔR2 ∫ΔF/F0 and following application of carboxyeosin there was no additional change in the ∫ΔF/F0 over that already produced by cyclopiazonic acid (Fig. 5E). The increase in τs during ΔR2 ΔF/F0 persisted when FCCP was applied in the presence of oligomycin (Fig. 5F1). Thapsigargin increased P1 ∫ΔF/F0, largely due to an increase in τs (Fig. 4C) and eliminated the significant difference between P1 ∫ΔF/F0 and ΔR2 ∫ΔF/F0 (Fig. 4A and B). Interestingly, neither L-type VDCCs nor sequestering of [Ca2+]res by the MCU contributed to τs, but they both appeared play a role in some faster process reflected in τf, possibly through an effect of [Ca2+]pre or ATP on SERCA kinetics. Uptake of Ca2+ into lysosomes by the vacuolar proton pump has been identified as an additional Ca2+ clearance pathway in axon terminals [36]; however, we were unable to evaluate the contribution of this pathway in these studies.
4.1. Contribution of transport-dependent Ca2+ flux to [Ca2+]res
Barium has been used frequently as a substitute for Ca2+ as a permeant ion in biophysical studies of ICa, since it readily permeates most Ca2+ channels [37]. Importantly though, Ba2+ is cleared one to two orders of magnitude more slowly from synaptic terminals than is Ca2+ [38] because it is ineffectively removed from the cytoplasm by transporters including SERCA pumps [39], the NCX [24], the PMCA [40] (but see: [41]), and the MCU [24]. The ability of Ba2+ to bind to presynaptic cytoplasmic Ca2+-binding proteins is less clear, although it is ineffective in activating calmodulin-like [42] or troponin-like [43] binding sites. We thus chose to use ACSF in which Ca2+ was replaced with Ba2+ to help isolate transport-dependent components of [Ca2+]res decay.
Our data show a halving of the portion of ΔF/F0 that is fit with a fast exponential and a doubling of τs in Ba2+ (Fig. 2C). The simplest explanation for these observations is that much of the rapid phase and half of the slow phase of [Ca2+]res decay results from transport-dependent Ca2+ clearance from the cytoplasm. Likewise, the elimination of the increase of the ΔR2 ∫ΔF/F0 in the presence of Ba2+ (Fig. 2D) is consistent with our hypothesis that this increase results from the reduction of a transport-dependent process of Ca2+ sequestering or extrusion during the second of paired pulses. In further support of this hypothesis, the increase of ΔR2 ∫ΔF/F0 over P1 ∫ΔF/F0 has a temperature dependence that is significantly above the minimum of 1.3 expected for an active process (Fig. 2E).
4.2. Contribution of ER Ca2+ stores to [Ca2+]res
Presynaptic ER contains functional ryanodine receptors [44] and the ER is found in close proximity to vesicle release sites [45]. Thus ER could potentially be both a contributor to [Ca2+]pre uptake and a source for CICR that could contribute to short-term synaptic plasticity and to the increase in the ΔR2 ∫ΔF/F0 that we have observed. In Schaffer collateral terminals, while presynaptic CICR has been clearly shown to play a role in stimulus-induced LTD [46,47] and caffeine-induced LTP [48], the role of CICR in presynaptic short-term facilitation is controversial [49]. For example, ryanodine or caffeine has been shown to decrease PPF and thapsigargin to transiently increase PPF in slices from young rats [17]. In contrast, thapsigargin or ryanodine have been reported to have no effect on PPF or [Ca2+]pre in a similar preparation [16].In our study, a rather high frequency loading stimulus was required in order to permit measurable Ca2+ release in the presence of caffeine while lower frequency preloading paradigms caused a maintained elevation of [Ca2+]pre with no further increase upon the addition of caffeine (Fig. 3B and C). The slow application timecourse inherent in our bath exchange protocol, by allowing time for establishment of a new equilibrium between SERCA uptake from and ryanodine-dependent release into the cytoplasm, may have contributed to our difficulty in obtaining measurable release from loaded ER stores. However, our data clearly indicate that the ER Ca2+ stores in Schaffer collateral presynaptic terminals in adult rats only release significant Ca2+ if they are first preloaded. Furthermore, it is not surprisingly that under basal conditions in our experiments, preventing ER Ca2+ uptake by blocking the SERCA pump with thapsigargin did not produce a significant elevation of [Ca2+]pre (Fig. 3A).
The use of caffeine to cause Ca2+ release from ER stores through its action on ryanodine receptors is complicated because of its action on presynaptic adenosine receptors. It has been reported that caffeine can relieve the tonic inhibition produced by extra-cellular adenosine [50] and thereby increase Ca2+ influx through VGCCs [48]. However, since we have observed CICR only following preloading of the intracellular stores, it is unlikely that the increase in [Ca2+]pre, which we observe (Fig. 3B and C), occurs solely by this mechanism. A further complication lies in the effect of millimolar concentrations of caffeine on measurements made with fluorescent indicator dyes. While this effect should be minimized by using the ratiometric dye Fura-2 [51], it may still have led to a reduction in the [Ca2+]pre signal both with and without stores preloading. Importantly, our Fura-2 measurements were sufficiently sensitive to determine the increase in [Ca2+]pre that follows2 × 20 pulses at 100 Hz (Fig. 3C) and the caffeine-dependent release from stores that had previously been loaded by a 30 s depolarization (Fig. 3B).
Further published evidence for the role of CICR in presynaptic terminals comes from the use of thapsigargin, which can deplete ER Ca2+ stores through a significant Ca2+ leak in the absence of compensatory uptake by SERCA pumps. In slices from young rats at room temperature, thapsigargin decreased PPF in minimal stimulation studies of functional, but not silent, Schaffer collateral terminals in CA1 [17]. In contrast, Carter et al. [16] found that thapsigargin did not affect PPF of evoked EPSCs nor did it affect the t½ of decay of [Ca2+]res for a single pulse. In our studies of Schaffer collateral terminals in adult hippocampal slices, block of SERCA pumps did not produce a measurable increase in [Ca2+]pre under basal conditions (Fig. 3A). This is consistent with our finding that these stores are not significantly loaded under those conditions, although this could also indicate that there is minimal passive leak from the ER in these terminals. Moreover, our data reveal that SERCA pumps provide an important contribution to the difference between P1 ∫ΔF/F0 and ΔR2 ∫ΔF/F0 (Fig. 4B) and their block leads to an enhancement of PPF (Fig. 6). This implies that a component of the SERCA removal mechanism becomes less effective following the R1 Ca2+ influx. One potential mechanism for this reduced effectiveness is that the cytoplasmic binding site of the SERCA pump becomes partially saturated as a result of the R1 Ca2+ influx. Another possibility is suggested by the observation in rat brain microsomes that SERCA activity decreases in response to increasing ER luminal [Ca2+] [52]. Either of these mechanisms would affect the timecourse of available SERCA during paired or repetitive pulses as predicted by our model (Fig. 7C and D)
4.3. Contribution of plasma membrane flux to [Ca2+]res
Presynaptic [Ca2+]res could be influenced by flux across the plasma membrane through Ca2+ permeable channels, exchangers, or pumps and we considered use-dependent changes in each of these pathways as a possible source for the increase in ΔR2 ∫ΔF/F0. While L-type VGCCs in Schaffer collateral terminals play a role following high frequency stimulation [53] and specifically in LTP [11,54] and in LTD [55], we found a small effect of blocking L-type Ca2+ channels only on the τf of ΔF/F0 decay. This could reflect the block of a persistent Ca2+ influx into a compartment that is normally cleared by a relatively rapid clearance process. In addition, we cannot rule out a small contribution from L-type VGCCs during the second of paired pulses, since there was a small reduction in the overall enhancement of the ΔR2 ∫ΔF/F0 in the presence of nimodipine (Fig. 5C).
The NCX is a high capacity, low affinity Ca2+ transporter with potential importance in [Ca2+]pre clearance because it extrudes Ca2+ rather than buffering or sequestering it within the presynaptic terminal. Recent ultrastructural studies show only a minor involvement of NCX1-3 in presynaptic terminals [56] and studies using NCKX2 knockout mice indicate that this exchanger does not significantly contribute to PPF [57]. Our experiments with benzamil demonstrate that NCX contributes neither to the difference between P1 ∫ΔF/F0 and ΔR2 ∫ΔF/F0 (Fig. 5D) nor to the generation of PPF (Fig. 6B).
The PMCA has a high affinity for Ca2+ and is thus a good candidate for rapid [Ca2+]pre clearance [58]. Our attempts to block the PMCA with carboxyeosin were complicated by two factors. First, it was necessary to measure [Ca2+]res with Fura-FF instead of Mg-Green and this forced us to fit the ΔF/F0 decay data with a single instead of the double exponential used in all of the other experiments. Second, to minimize potential complications from block of the SERCA pump by carboxyeosin, we carried out these experiments in the presence of cyclopiazonic acid, which had the expected result of increasing P1 ∫ΔF/F0 to approximately match ΔR2 ∫ΔF/F0. We did not, however, observe any additional increase in the decay with carboxyeosin, although this effect could have been occluded by the action of cyclopiazonic acid. We interpret these results therefore to indicate that PMCA is not the major factor in clearing [Ca2+]res after a single pulse.
4.4. Contribution of mitochondria to [Ca2+]res
Assessment of the role of the MCU in [Ca2+]res clearance is complicated by the role of mitochondria in ATP production and the ATP requirement for other Ca2+ clearance pathways. Because mitochondria are a low affinity, high capacity Ca2+ sequestration organelle, the MCU is unlikely to make an important contribution to the clearance of [Ca2+]res during pairs of pulses in Schaffer collateral synaptic boutons [59]. Nevertheless, because mitochondria are present in presynaptic terminals, we performed several experiments to address whether a mitochondria-dependent processes could influence Ca2+ dynamics during short-term synaptic plasticity.
Ruthenium red has been used to block the MCU [60], but this molecule is rather membrane impermeant and so to be most effective it requires intracellular injection [61], which was not possible in our experiments. Mn2+ ions, which have been reported to block the MCU after successfully entering the cytoplasm, are inconsistent in their reported effectiveness in blocking mitochondrial Ca2+ uptake [62]. We thus decided to use the indirect approach of abolishing Δψm through application of the protonopore FCCP, which then prevents mitochondrial Ca2+ uptake by the Δψm-dependent MCU [33]. We found unfortunately that FCCP produced a significant decrease in the P1 ∫ΔF/F0, the ΔR2 #x222B;ΔF/F0, and the postsynaptic fEPSP, which thereby precluded its use to assess the role of the MCU in [Ca2+]res clearance. Abolishing Δψm introduces the additional complication of depleting cytoplasmic ATP stores and thereby influencing other cytoplasmic ATP-dependent processes. We took two approaches to minimize this possible complication. First, we used oligomycin, a blocker of the F0 portion of the mitochondrial H+-ATP-synthase, which blocks both its ATP synthesis activity and its reverse mode ATP hydrolysis activity [63]. Second, we kept the FCCP exposure short such that all ΔF/F0 measurements were made between 3 min, when there was about 92% bath exchange, and 6 min, when there was over 99% bath exchange. Unexpectedly, oligomycin eliminated the increase in ΔR2 ∫ΔF/F0 as a result of a decrease in the relative contribution of the slow component to the overall ΔF/F0 decay. One possible explanation for this result is that in the presence of glucose, oligomycin does not cause cytoplasmic [ATP] to fall below that required for SERCA function [64]. However, it has been suggested that mitochondria produce microdomains of ATP that favor SERCA-mediated Ca2+ clearance [65] and this is consistent with electron microscopic evidence for very close apposition of mitochondria and ER [66]. Thus, the decrease in the relative contribution of the slow component of ΔF/F0 clearance could be caused by oligomycin reducing the effectiveness of a privileged mitochondrial ATP source for SERCA. As a result, SERCA clearance would be reduced, but not eliminated, and other faster Ca2+ clearance pathways would make a more significant contribution. Importantly, however, in the presence of oligomycin or FCCP with oligomycin, the τs of ΔR2 ΔF/F0 is significantly slower than that of R1 ΔF/F0 (Fig. 5F1), which we interpret to indicate that the MCU is not a major contributor to [Ca2+]res clearance during paired pulses.
4.5. Modeling [Ca2+]res kinetics
The kinetics of presynaptic [Ca2+]res clearance are an important component of the timecourse of short-term synaptic plasticity [67] and we have shown selective involvement of specific clearance pathways on PPF (Fig. 6B). Importantly, the [Ca2+]res decays in this study were best fit with a double exponential, which is consistent with a cooperative mechanism such as SERCA-dependent uptake into the ER. ER Ca2+ stores, while only minimally filled in the basal state, are capable of significant Ca2+ sequestration (Fig. 3) and block of SERCA pumps significantly decreases the τs of [Ca2+]res clearance (Fig. 4). We hypothesize from these observations that the SERCA-dependent sequestration into the ER plays a major role in presynaptic [Ca2+]res clearance and that a rate-limiting step in this pathway is responsible for the increased τs during R2. Lacking the ability to measure ER Ca2+ kinetics in presynaptic terminals without membrane permeabilization [68], we resorted to a reduced kinetic model to predict SERCA kinetics based on fits to our paired pulse [Ca2+]res data (see Appendix for details). While a wide range of initial parameters fit the [Ca2+]res decay during R1, the observed increase in τs during R2 is most consistently predicted by a reduction of the forward rate constant, k4, for cytoplasmic Ca2+binding to SERCA (Fig. 7A). Additionally, when we used parameters from pairs of pulses to fit to [Ca2+]res data from 5 pulses, the model predicted that the free [SERCA] continued to decline and the ER buffered Ca2+ concentration ([CaB]) rose, but did not saturate (Fig. 7D), which is consistent with our observation that the ER has the capacity to accumulate Ca2+ during multiple pulses (Fig. 3) with potential repercussions in the determination of synaptic frequency response.
4.6. Physiological roles of SERCA Ca2+ uptake
Because of the close dependency of short-term plasticity and working memory on [Ca2+]res, it is important to understand the mechanisms by which Ca2+ is cleared from the cytoplasm of the presynaptic terminal between repetitive action potentials. As we have shown here, Ca2+ sequestered into and released from the ER, and the kinetics and magnitude of this process have important consequences in determining the Ca2+ dynamics of this specialized cellular compartment. This clearance process is but one adaptation of a system that underlies important physiological properties of many cells in which Ca2+ dynamics vary not only from cell to cell but even among cellular compartments. For example, in pancreatic acinar cells, the kinetics of transmembrane flux are relatively slow so sequestration into and release from the ER greatly impact [Ca2+]i. Of special importance in acinar cells, feedback between sequestration and release produces Ca2+ waves whose oscillatory period is determined by the density of SERCA [69]. In skeletal muscle and to a lesser degree in cardiac muscle, the transmembrane flux is small and again uptake into and release from the sarcoplasmic reticulum is the major factor that controls sarcoplasmic [Ca2+]i. In this instance, release from the sarcoplasmic reticulum is rapidly triggered by voltage or Ca2+ while uptake into the sarcoplasmic reticulum by SERCA determines the timecourse of muscle relaxation. Thus specific SERCA isoforms can influence muscle twitch speed [70] and the level of SERCA activity plays a central role in frequency-dependent contractile force development [71]. In contrast to these non-neuronal cells, in the basal state, there appears to be very little releasable Ca2+ in Ca2+-sensitive ER stores of Schaffer collateral presynaptic terminals, although these stores have considerable capacity to sequester [Ca2+]i. The persistence of [Ca2+]i in presynaptic terminals is more transient than in the non-neuronal cells described above, but, on the timescale of short-term synaptic plasticity, SERCA transport into the ER is still a major clearance pathway. Furthermore, we have predicted that the cytoplasmic Ca2+ binding sites of the SERCA pump are easily saturated in presynaptic terminals such that after only a few action potentials this clearance pathway is limited by SERCA turnover, although not by the Ca2+ storage capacity of the ER. As in the non-neuronal cells, SERCA properties have important physiological consequences that, in the case of presynaptic terminals, are a leading determinant of the magnitude short-term synaptic plasticity.
Acknowledgements
The authors would like to thank Fernando Valenzuela, Bill Shuttleworth, and Michael Wilson for critically reading this manuscript and William Matthews for computer support. This work was supported by NIH grants R01-MH07386 to LDP and R01-MH48989 to Michael Wilson for financial support of CSS.
Appendix A
The double exponential decay, which best fit our [Ca2+]res data, is consistent with either a sequential process or two parallel kinetic processes that occur simultaneously acting on separate pools. Because it was indicated by our experimental observations, we tested whether a simplified SERCA model, using the range of published parameters, could predict the observed double exponential decay kinetics. The resultant kinetic model accurately predicted both the fast and slow components of decay as a consequence of a single sequential process. This simplified model was limited to short trains of pulses during which there is a limited rise in basal [Ca2+]pre. More significant increases in [Ca2+]pre would be expected to activate additional mechanisms such as plasma membrane transport or mitochondrial uptake.
Kinetic modeling of presynaptic [Ca2+]res used a reduced state diagram and was analyzed in a differential form that included k4, k−4, k−4*, k4*, kBER, k−BER, k3 (see Fig. 7A and Eqs. (4)–(14) below). Presynaptic Ca2+ influx was modeled as a Gaussian process with a half width of 2.5ms that was adjusted to fit the derivative of the data from Fig. 1A1 scaled to reflect an estimated peak of 500 nM. [Ca2+]res clearance was evaluated using ordinary differential equations (ODE) and initial conditions (ICs) in a Matlab program with ode45 4th or 5th order Runga-Kutta numerical integration. The non-predefined ICs (see table) were then fit to the data using a nonlinear least squares analysis, after using Potterswheel [35] to determine component sensitivity for all parameters. Parameters found in the literature, but highly sensitive to the fit, were allowed to vary over a pre-specified range (either restricted to the range specified in the literature or held to an order of magnitude, see Table 1). First the [Ca2+]res data for paired pulses from Fig. 1A1 were fit (R2 = 0.95) and the resultant parameters were then applied to a single pulse model, which was compared with single pulse data from the same experiment (R2 = 0.93). Next the same parameter range was used to fit an additional 23 paired pulse [Ca2+]res data sets (R2 = 0.86). Finally, we fit [Ca2+]res data from a separate experiment with 5 pulses at 50ms interpulse interval (R2 = 0.94). In this instance the same parameter range was used except that the ryanodine receptor-dependent efflux from the ER was increased to reflect an expected larger Ca2+-dependent component.
Table 1.
Parameters that varied during kinetic modeling. Model value is the final value obtained after fitting. Published value in cited reference for the same parameter.
| Model parameter | Model value | Published values | Reference | Cell type | ||
|---|---|---|---|---|---|---|
| [Ca] | 133 | nM | 95 | nM | [72] | Hela |
| [SERCA] | 1062 | nM | 15 (varied) | μmol/L cyt | [69] | Non-excitable |
| [CaSERCA] | 3 | nM | ||||
| [CaB]ER | 0.120 | μM | 10 | μM | [72] | Hela |
| k 4* | 0.92 | ms−1 | 0.4 | s−1 | [69] | Non-excitable |
| 600 | s−1 | [73] | Human SERCA | |||
| k 4 | 1.097E-07 | nM−1 ms−1 | 0.9 | μM−1 s−1 | [74] | Non-excitable |
| 67 | nM−1 s−1 | [75] | PC 12 | |||
| k 3 | 0.0009 | ms−1 | 2 | s−1 | [76] | Non-excitable |
| [Ca]ER | 40 | nM | low | Fig. 2 | ||
| k barium | 0.0069 | ms−1 | 0.002 | ms−1 | Fig. 3 | |
Assumptions for Model
1. Primary [Ca2+]cyt clearance is a receptor-dependent process with lumped passive kinetics approximated by the ΔF/F0 decay in Ba2+ (Fig. 2C) and that of the second pulse in ACSF (Fig. 1C).
2. Receptor-dependent [Ca2+]cyt clearance is primarily through SERCA uptake into the ER (Fig. 4).
3. In the basal state, there is a low releasable [Ca2+]ER, but the ER is capable of considerable Ca2+ uptake (Fig. 3).
4. All concentrations and rates that were not fit to the data, were taken from published values (see Table 2).
| (4) |
| (5) |
| (6) |
| (7) |
| (8) |
| (9) |
| (10) |
| (11) |
| (12) |
| (13) |
| (14) |
| (15) |
Table 2.
Parameters from cited reference that were fixed in kinetic model.
| Model parameter | Model value | Reference | Cell type | |
|---|---|---|---|---|
| [B]ER | 375000 | nmol/L ER | [69] | Non-excitable |
| Kd 4 | 700000 | (nmol/L cyt)2 | [69] | Non-excitable |
| Kd 4* | 10 | (nmol/L ER)2 | [69] | Non-excitable |
| k -BER | 0.08 | ms−1 | [69] | Non-excitable |
| k BER | 0.000001 | ((nmol/L ER)−1 ms−1) | [69] | Non-excitable |
| γ | 0.185 | VolER/VolCyt | [69] | Non-excitable |
| Kd BER | 80000 | nmol/L ER | ||
References
- [1].Neher E, Sakaba T. Multiple roles of calcium ions in the regulation of neurotransmitter release. Neuron. 2008;59:861–872. doi: 10.1016/j.neuron.2008.08.019. [DOI] [PubMed] [Google Scholar]
- [2].Zucker RS, Regehr WG. Short-term synaptic plasticity. Annu. Rev. Physiol. 2002;64:355–405. doi: 10.1146/annurev.physiol.64.092501.114547. [DOI] [PubMed] [Google Scholar]
- [3].Catterall WA, Few AP. Calcium channel regulation and presynaptic plasticity. Neuron. 2008;59:882–901. doi: 10.1016/j.neuron.2008.09.005. [DOI] [PubMed] [Google Scholar]
- [4].Mongillo G, Barak O, Tsodyks M. Synaptic theory of working memory. Science. 2008;319:1543–1546. doi: 10.1126/science.1150769. [DOI] [PubMed] [Google Scholar]
- [5].Schiess AR, Scullin CS, Partridge LD. Neurosteroid-induced enhancement of short-term facilitation involves a component downstream from presynaptic calcium in hippocampal slices. J. Physiol. 2006;576:833–847. doi: 10.1113/jphysiol.2006.118505. [DOI] [PMC free article] [PubMed] [Google Scholar]
- [6].Rusakov DA. Ca2+-dependent mechanisms of presynaptic control at central synapses. Neuroscientist. 2006;12:317–326. doi: 10.1177/1073858405284672. [DOI] [PMC free article] [PubMed] [Google Scholar]
- [7].Kim MH, Korogod N, Schneggenburger R, Ho WK, Lee SH. Interplay between Na+/Ca2+ exchangers and mitochondria in Ca2+ clearance at the calyx of Held. J. Neurosci. 2005;25:6057–6065. doi: 10.1523/JNEUROSCI.0454-05.2005. [DOI] [PMC free article] [PubMed] [Google Scholar]
- [8].Neher E, Augustine GJ. Calcium gradients and buffers in bovine chromaffin cells. J. Physiol. 1992;450:273–301. doi: 10.1113/jphysiol.1992.sp019127. [DOI] [PMC free article] [PubMed] [Google Scholar]
- [9].Blatow M, Caputi A, Burnashev N, Monyer H, Rozov A. Ca2+ buffer saturation underlies paired pulse facilitation in calbindin-D28k-containing terminals. Neuron. 2003;38:79–88. doi: 10.1016/s0896-6273(03)00196-x. [DOI] [PubMed] [Google Scholar]
- [10].Berridge MJ. Neuronal calcium signaling. Neuron. 1998;21:13–26. doi: 10.1016/s0896-6273(00)80510-3. [DOI] [PubMed] [Google Scholar]
- [11].Lauri SE, Bortolotto ZA, Nistico R, Bleakman D, Ornstein PL, Lodge D, Isaac JT, Collingridge GL. A role for Ca2+ stores in kainate receptor-dependent synaptic facilitation and LTP at mossy fiber synapses in the hippocampus. Neuron. 2003;39:327–341. doi: 10.1016/s0896-6273(03)00369-6. [DOI] [PubMed] [Google Scholar]
- [12].Unni VK, Zakharenko SS, Zablow L, DeCostanzo AJ, Siegelbaum SA. Calcium release from presynaptic ryanodine-sensitive stores is required for long-term depression at hippocampal CA3-CA3 pyramidal neuron synapses. J. Neurosci. 2004;24:9612–9622. doi: 10.1523/JNEUROSCI.5583-03.2004. [DOI] [PMC free article] [PubMed] [Google Scholar]
- [13].Scott R, Rusakov DA. Main determinants of presynaptic Ca2+ dynamics at individual mossy fiber-CA3 pyramidal cell synapses. J. Neurosci. 2006;26:7071–7081. doi: 10.1523/JNEUROSCI.0946-06.2006. [DOI] [PMC free article] [PubMed] [Google Scholar]
- [14].Emptage NJ, Reid CA, Fine A. Calcium stores in hippocampal synaptic boutons mediate short-term plasticity, store-operated Ca2+ entry, and spontaneous transmitter release. Neuron. 2001;29:197–208. doi: 10.1016/s0896-6273(01)00190-8. [DOI] [PubMed] [Google Scholar]
- [15].Scott R, Lalic T, Kullmann DM, Capogna M, Rusakov DA. Target-cell specificity of kainate autoreceptor and Ca2+-store-dependent short-term plasticity at hippocampal mossy fiber synapses. J. Neurosci. 2008;28:13139–13149. doi: 10.1523/JNEUROSCI.2932-08.2008. [DOI] [PMC free article] [PubMed] [Google Scholar]
- [16].Carter AG, Vogt KE, Foster KA, Regehr WG. Assessing the role of calcium-induced calcium release in short-term presynaptic plasticity at excitatory central synapses. J. Neurosci. 2002;22:21–28. doi: 10.1523/JNEUROSCI.22-01-00021.2002. [DOI] [PMC free article] [PubMed] [Google Scholar]
- [17].Cabezas C, Buno W. Distinct transmitter release properties determine differences in short-term plasticity at functional and silent synapses. J. Neurophysiol. 2006;95:3024–3034. doi: 10.1152/jn.00739.2005. [DOI] [PubMed] [Google Scholar]
- [18].Regehr WG, Tank DW. Selective fura-2 loading of presynaptic terminals and nerve cell processes by local perfusion in mammalian brain slice. J. Neurosci. Methods. 1991;37:111–119. doi: 10.1016/0165-0270(91)90121-f. [DOI] [PubMed] [Google Scholar]
- [19].Atluri PP, Regehr WG. Determinants of the time course of facilitation at the granule cell to Purkinje cell synapse. J. Neurosci. 1996;16:5661–5671. doi: 10.1523/JNEUROSCI.16-18-05661.1996. [DOI] [PMC free article] [PubMed] [Google Scholar]
- [20].Wu LG, Saggau P. Presynaptic calcium is increased during normal synaptic transmission and paired-pulse facilitation, but not in long-term potentiation in area CA1 of hippocampus. J. Neurosci. 1994;14:645–654. doi: 10.1523/JNEUROSCI.14-02-00645.1994. [DOI] [PMC free article] [PubMed] [Google Scholar]
- [21].Sinha SR, Wu LG, Saggau P. Presynaptic calcium dynamics and transmitter release evoked by single action potentials at mammalian central synapses. Biophys. J. 1997;72:637–651. doi: 10.1016/s0006-3495(97)78702-2. [DOI] [PMC free article] [PubMed] [Google Scholar]
- [22].Regehr WG, Atluri PP. Calcium transients in cerebellar granule cell presynaptic terminals. Biophys. J. 1995;68:2156–2170. doi: 10.1016/S0006-3495(95)80398-X. [DOI] [PMC free article] [PubMed] [Google Scholar]
- [23].Lisman JE, Raghavachari S, Tsien RW. The sequence of events that underlie quantal transmission at central glutamatergic synapses. Nat. Rev. Neurosci. 2007;8:597–609. doi: 10.1038/nrn2191. [DOI] [PubMed] [Google Scholar]
- [24].Rasgado-Flores H, Sanchez-Armass S, Blaustein MP, Nachshen DA. Strontium, barium, and manganese metabolism in isolated presynaptic nerve terminals. Am. J. Physiol. 1987;252:C604–C610. doi: 10.1152/ajpcell.1987.252.6.C604. [DOI] [PubMed] [Google Scholar]
- [25].Augustine GJ, Eckert R. Divalent cations differentially support transmitter release at the squid giant synapse. J. Physiol. 1984;346:257–271. doi: 10.1113/jphysiol.1984.sp015020. [DOI] [PMC free article] [PubMed] [Google Scholar]
- [26].Li L, Bischofberger J, Jonas P. Differential gating and recruitment of P/Q-N-, and R-type Ca2+ channels in hippocampal mossy fiber boutons. J. Neurosci. 2007;27:13420–13429. doi: 10.1523/JNEUROSCI.1709-07.2007. [DOI] [PMC free article] [PubMed] [Google Scholar]
- [27].Tokunaga T, Miyazaki K, Koseki M, Mobarakeh JI, Ishizuka T, Yawo H. Pharmacological dissection of calcium channel subtype-related components of strontium inflow in large mossy fiber boutons of mouse hippocampus. Hippocampus. 2004;14:570–585. doi: 10.1002/hipo.10202. [DOI] [PubMed] [Google Scholar]
- [28].Tippens AL, Pare JF, Langwieser N, Moosmang S, Milner TA, Smith Y, Lee A. Ultrastructural evidence for pre- and postsynaptic localization of Cav1.2 L-type Ca2+ channels in the rat hippocampus. J. Comp. Neurol. 2008;506:569–583. doi: 10.1002/cne.21567. [DOI] [PubMed] [Google Scholar]
- [29].Chavis P, Fagni L, Lansman JB, Bockaert J. Functional coupling between ryanodine receptors and L-type calcium channels in neurons. Nature. 1996;382:719–722. doi: 10.1038/382719a0. [DOI] [PubMed] [Google Scholar]
- [30].Shuttleworth CW, Brennan AM, Connor JA. NAD(P)H fluorescence imaging of postsynaptic neuronal activation in murine hippocampal slices. J. Neurosci. 2003;23:3196–3208. doi: 10.1523/JNEUROSCI.23-08-03196.2003. [DOI] [PMC free article] [PubMed] [Google Scholar]
- [31].Pierce GN, Cole WC, Liu K, Massaeli H, Maddaford TG, Chen YJ, McPherson CD, Jain S, Sontag D. Modulation of cardiac performance by amiloride and several selected derivatives of amiloride. J. Pharmacol. Exp. Ther. 1993;265:1280–1291. [PubMed] [Google Scholar]
- [32].Fierro L, DiPolo R, Llano I. Intracellular calcium clearance in Purkinje cell somata from rat cerebellar slices. J. Physiol. 1998;510(Pt 2):499–512. doi: 10.1111/j.1469-7793.1998.499bk.x. [DOI] [PMC free article] [PubMed] [Google Scholar]
- [33].Montero M, Alonso MT, Albillos A, Garcia-Sancho J, Alvarez J. Mitochondrial Ca(2+)-induced Ca(2+) release mediated by the Ca(2+) uniporter. Mol. Biol. Cell. 2001;12:63–71. doi: 10.1091/mbc.12.1.63. [DOI] [PMC free article] [PubMed] [Google Scholar]
- [34].Boitier E, Rea R, Duchen MR. Mitochondria exert a negative feedback on the propagation of intracellular Ca2+ waves in rat cortical astrocytes. J. Cell Biol. 1999;145:795–808. doi: 10.1083/jcb.145.4.795. [DOI] [PMC free article] [PubMed] [Google Scholar]
- [35].Maiwald T, Timmer J. Dynamical modeling and multi-experiment fitting with PottersWheel. Bioinformatics. 2008;24:2037–2043. doi: 10.1093/bioinformatics/btn350. [DOI] [PMC free article] [PubMed] [Google Scholar]
- [36].McGuinness L, Bardo SJ, Emptage NJ. The lysosome or lysosome-related organelle may serve as a Ca2+ store in the boutons of hippocampal pyramidal cells. Neuropharmacology. 2007;52:126–135. doi: 10.1016/j.neuropharm.2006.07.029. [DOI] [PubMed] [Google Scholar]
- [37].Hille B. Ion channels of excitable membranes. Sinauer Association; Sutherland, MA: 2001. [Google Scholar]
- [38].Neves G, Neef A, Lagnado L. The actions of barium and strontium on exocytosis and endocytosis in the synaptic terminal of goldfish bipolar cells. J. Physiol. 2001;535:809–824. doi: 10.1111/j.1469-7793.2001.t01-1-00809.x. [DOI] [PMC free article] [PubMed] [Google Scholar]
- [39].Bakowski D, Parekh AB. Sarcoplasmic/endoplasmic-reticulum-Ca2+-ATPase-mediated Ca2+ reuptake, and not Ins(1,4,5)P3 receptor inactivation, prevents the activation of macroscopic Ca2+ release-activated Ca2+ current in the presence of physiological Ca2+ buffer in rat basophilic leukaemia-1 cells. Biochem. J. 2001;353:561–567. doi: 10.1042/0264-6021:3530561. [DOI] [PMC free article] [PubMed] [Google Scholar]
- [40].Przywara DA, Chowdhury PS, Bhave SV, Wakade TD, Wakade AR. Barium-induced exocytosis is due to internal calcium release and block of calcium efflux. Proc. Natl. Acad. Sci. U. S. A. 1993;90:557–561. doi: 10.1073/pnas.90.2.557. [DOI] [PMC free article] [PubMed] [Google Scholar]
- [41].Thomas RC. The plasma membrane calcium ATPase (PMCA) of neurones is electroneutral and exchanges 2H+ for each Ca2+ or Ba2+ ion extruded. J. Physiol. 2008;587(2):12. doi: 10.1113/jphysiol.2008.162453. [DOI] [PMC free article] [PubMed] [Google Scholar]
- [42].Chao SH, Suzuki Y, Zysk JR, Cheung WY. Activation of calmodulin by various metal cations as a function of ionic radius. Mol. Pharmacol. 1984;26:75–82. [PubMed] [Google Scholar]
- [43].Fuchs F. Ion exchange properties of the calcium receptor site of troponin. Biochim. Biophys. Acta. 1971;245:221–229. doi: 10.1016/0005-2728(71)90025-9. [DOI] [PubMed] [Google Scholar]
- [44].Bouchard R, Pattarini R, Geiger JD. Presence and functional significance of presynaptic ryanodine receptors. Prog. Neurobiol. 2003;69:391–418. doi: 10.1016/s0301-0082(03)00053-4. [DOI] [PubMed] [Google Scholar]
- [45].Westrum LE, Gray EG. New observations on the substructure of the active zone of brain synapses and motor endplates. Proc. R. Soc. Lond. B Biol. Sci. 1986;229:29–38. doi: 10.1098/rspb.1986.0072. [DOI] [PubMed] [Google Scholar]
- [46].Reyes-Harde M, Empson R, Potter BV, Galione A, Stanton PK. Evidence of a role for cyclic ADP-ribose in long-term synaptic depression in hippocampus. Proc. Natl. Acad. Sci. U. S. A. 1999;96:4061–4066. doi: 10.1073/pnas.96.7.4061. [DOI] [PMC free article] [PubMed] [Google Scholar]
- [47].Reyes M, Stanton PK. Induction of hippocampal long-term depression requires release of Ca2+ from separate presynaptic and postsynaptic intracellular stores. J. Neurosci. 1996;16:5951–5960. doi: 10.1523/JNEUROSCI.16-19-05951.1996. [DOI] [PMC free article] [PubMed] [Google Scholar]
- [48].Martin ED, Buno W. Caffeine-mediated presynaptic long-term potentiation in hippocampal CA1 pyramidal neurons. J. Neurophysiol. 2003;89:3029–3038. doi: 10.1152/jn.00601.2002. [DOI] [PubMed] [Google Scholar]
- [49].Fitzjohn SM, Collingridge GL. Calcium stores and synaptic plasticity. Cell Calcium. 2002;32:405–411. doi: 10.1016/s0143416002001999. [DOI] [PubMed] [Google Scholar]
- [50].Wu LG, Saggau P. Adenosine inhibits evoked synaptic transmission primarily by reducing presynaptic calcium influx in area CA1 of hippocampus. Neuron. 1994;12:1139–1148. doi: 10.1016/0896-6273(94)90321-2. [DOI] [PubMed] [Google Scholar]
- [51].Muschol M, Dasgupta BR, Salzberg BM. Caffeine interaction with fluorescent calcium indicator dyes. Biophys. J. 1999;77:577–586. doi: 10.1016/S0006-3495(99)76914-6. [DOI] [PMC free article] [PubMed] [Google Scholar]
- [52].Wells KM, Abercrombie RF. Effects of the intraluminal Ca load on the kinetics of 45Ca uptake and efflux in brain microsomes. Am. J. Physiol. 1996;271:C1472–C1479. doi: 10.1152/ajpcell.1996.271.5.C1472. [DOI] [PubMed] [Google Scholar]
- [53].Igelmund P, Zhao YQ, Heinemann U. Effects of T-type, L-type, N-type, P-type, and Q-type calcium channel blockers on stimulus-induced pre- and postsynaptic calcium fluxes in rat hippocampal slices. Exp. Brain Res. 1996;109:22–32. doi: 10.1007/BF00228623. [DOI] [PubMed] [Google Scholar]
- [54].Zakharenko SS, Patterson SL, Dragatsis I, Zeitlin SO, Siegelbaum SA, Kandel ER, Morozov A. Presynaptic BDNF required for a presynaptic but not postsynaptic component of LTP at hippocampal CA1-CA3 synapses. Neuron. 2003;39:975–990. doi: 10.1016/s0896-6273(03)00543-9. [DOI] [PubMed] [Google Scholar]
- [55].Udagawa R, Nakano M, Kato N. Blocking L-type calcium channels enhances long-term depression induced by low-frequency stimulation at hippocampal CA1 synapses. Brain Res. 2006;1124:28–36. doi: 10.1016/j.brainres.2006.09.051. [DOI] [PubMed] [Google Scholar]
- [56].Minelli A, Castaldo P, Gobbi P, Salucci S, Magi S, Amoroso S. Cellular and subcellular localization of Na+-Ca2+ exchanger protein isoforms, NCX1, NCX2, and NCX3 in cerebral cortex and hippocampus of adult rat. Cell Calcium. 2007;41:221–234. doi: 10.1016/j.ceca.2006.06.004. [DOI] [PubMed] [Google Scholar]
- [57].Li XF, Kiedrowski L, Tremblay F, Fernandez FR, Perizzolo M, Winkfein RJ, Turner RW, Bains JS, Rancourt DE, Lytton J. Importance of K+-dependent Na+/Ca2+-exchanger 2, NCKX2, in motor learning and memory. J. Biol. Chem. 2006;281:6273–6282. doi: 10.1074/jbc.M512137200. [DOI] [PubMed] [Google Scholar]
- [58].Empson RM, Garside ML, Knopfel T. Plasma membrane Ca2+ ATPase 2 contributes to short-term synapse plasticity at the parallel fiber to Purkinje neuron synapse. J. Neurosci. 2007;27:3753–3758. doi: 10.1523/JNEUROSCI.0069-07.2007. [DOI] [PMC free article] [PubMed] [Google Scholar]
- [59].Brini M. Ca(2+) signalling in mitochondria: mechanism and role in physiology and pathology. Cell Calcium. 2003;34:399–405. doi: 10.1016/s0143-4160(03)00145-3. [DOI] [PubMed] [Google Scholar]
- [60].Kim MH, Lee SH, Park KH, Ho WK. Distribution of K+-dependent Na+/Ca2+ exchangers in the rat supraoptic magnocellular neuron is polarized to axon terminals. J. Neurosci. 2003;23:11673–11680. doi: 10.1523/JNEUROSCI.23-37-11673.2003. [DOI] [PMC free article] [PubMed] [Google Scholar]
- [61].Thayer SA, Miller RJ. Regulation of the intracellular free calcium concentration in single rat dorsal root ganglion neurones in vitro. J. Physiol. 1990;425:85–115. doi: 10.1113/jphysiol.1990.sp018094. [DOI] [PMC free article] [PubMed] [Google Scholar]
- [62].Mironov SL, Richter DW. Oscillations and hypoxic changes of mitochondrial variables in neurons of the brainstem respiratory centre of mice. J. Physiol. 2001;533:227–236. doi: 10.1111/j.1469-7793.2001.0227b.x. [DOI] [PMC free article] [PubMed] [Google Scholar]
- [63].Haworth RA, Hunter DR, Berkoff HA. Contracture in isolated adult rat heart cells. Role of Ca2+, ATP, and compartmentation. Circ. Res. 1981;49:1119–1128. doi: 10.1161/01.res.49.5.1119. [DOI] [PubMed] [Google Scholar]
- [64].Landolfi B, Curci S, Debellis L, Pozzan T, Hofer AM. Ca2+ homeostasis in the agonist-sensitive internal store: functional interactions between mitochondria and the ER measured In situ in intact cells. J. Cell Biol. 1998;142:1235–1243. doi: 10.1083/jcb.142.5.1235. [DOI] [PMC free article] [PubMed] [Google Scholar]
- [65].Jackson JG, Thayer SA. Mitochondrial modulation of Ca2+-induced Ca2+-release in rat sensory neurons. J. Neurophysiol. 2006;96:1093–1104. doi: 10.1152/jn.00283.2006. [DOI] [PubMed] [Google Scholar]
- [66].Rizzuto R, Pozzan T. Microdomains of intracellular Ca2 + : molecular determinants and functional consequences. Physiol. Rev. 2006;86:369–408. doi: 10.1152/physrev.00004.2005. [DOI] [PubMed] [Google Scholar]
- [67].Burnashev N, Rozov A. Presynaptic Ca2+ dynamics, Ca2+ buffers and synaptic efficacy. Cell Calcium. 2005;37:489–495. doi: 10.1016/j.ceca.2005.01.003. [DOI] [PubMed] [Google Scholar]
- [68].Solovyova N, Verkhratsky A. Monitoring of free calcium in the neuronal endoplasmic reticulum: an overview of modern approaches. J. Neurosci. Methods. 2002;122:1–12. doi: 10.1016/s0165-0270(02)00300-x. [DOI] [PubMed] [Google Scholar]
- [69].Higgins ER, Cannell MB, Sneyd J. A buffering SERCA pump in models of calcium dynamics. Biophys. J. 2006;91:151–163. doi: 10.1529/biophysj.105.075747. [DOI] [PMC free article] [PubMed] [Google Scholar]
- [70].Liu JX, Thornell LE, Pedrosa-Domellof F. Distribution of SERCA isoforms in human intrafusal fibers. Histochem. Cell Biol. 2003;120:299–306. doi: 10.1007/s00418-003-0569-5. [DOI] [PubMed] [Google Scholar]
- [71].Schwinger RH, Brixius K, Bavendiek U, Hoischen S, Muller-Ehmsen J, Bolck B, Erdmann E. Effect of cyclopiazonic acid on the force-frequency relationship in human nonfailing myocardium. J. Pharmacol. Exp. Ther. 1997;283:286–292. [PubMed] [Google Scholar]
- [72].Baker HL, Errington RJ, Davies SC, Campbell AK. A mathematical model predicts that calreticulin interacts with the endoplasmic reticulum Ca2+-ATPase. Biophys. J. 2002;82:582–590. doi: 10.1016/S0006-3495(02)75423-4. [DOI] [PMC free article] [PubMed] [Google Scholar]
- [73].Dode L, Vilsen B, Van Baelen K, Wuytack F, Clausen JD, Andersen JP. Dissection of the functional differences between sarco(endo)plasmic reticulum Ca2+-ATPase (SERCA) 1 and 3 isoforms by steady-state and transient kinetic analyses. J. Biol. Chem. 2002;277:45579–45591. doi: 10.1074/jbc.M207778200. [DOI] [PubMed] [Google Scholar]
- [74].De Young GW, Keizer J. A single-pool inositol 1,4,5-trisphosphate-receptor-based model for agonist-stimulated oscillations in Ca2+ concentration. Proc. Natl. Acad. Sci. U. S. A. 1992;89:9895–9899. doi: 10.1073/pnas.89.20.9895. [DOI] [PMC free article] [PubMed] [Google Scholar]
- [75].Duman JG, Chen L, Hille B. Calcium transport mechanisms of PC12 cells. J. Gen. Physiol. 2008;131:307–323. doi: 10.1085/jgp.200709915. [DOI] [PMC free article] [PubMed] [Google Scholar]
- [76].Jafri MS, Keizer J. On the roles of Ca2+ diffusion, Ca2+ buffers, and the endoplasmic reticulum in IP3-induced Ca2+ waves. Biophys. J. 1995;69:2139–2153. doi: 10.1016/S0006-3495(95)80088-3. [DOI] [PMC free article] [PubMed] [Google Scholar]