

Abstract
Objective
To understand the chemotherapy response program in ovarian cancer cells at deep transcript sequencing levels.
Methods
Two next-generation sequencing technologies—MPSS (massively parallel signature sequencing) and SBS (sequencing by synthesis) — were used to sequence the transcripts of IGROV1 and IGROV1-CP cells, and to sequence the transcripts of a highly chemotherapy responsive and a highly chemotherapy resistant ovarian cancer tissue.
Results
We identified 3,422 signatures (2957 genes) that are significantly different between IGROV1 and IGROV1-CP cells (P <0.001). Gene Ontology (GO) term GO:0001837 (epithelial to mesenchymal transition) and GO:0034330 (cell junction assembly and maintenance) are enriched in genes that are over expressed in IGROV1-CP cells while apoptosis related GO terms are enriched in genes over expressed in IGROV1 cells. We identified 1,187 tags (corresponding to 1,040 genes) that are differentially expressed between the chemotherapy responsive and the persistently chemotherapy resistant ovarian cancer tissues. GO term GO:0050673 (epithelial cell proliferation) and GO:0050678 (regulation of epithelial cell proliferation) are enriched in the genes over expressed in the chemotherapy resistant tissue while the GO:0007229 (integrin-mediated signaling pathway) is enriched in the genes over expressed in the chemotherapy sensitive tissue. An integrative analysis identified 111 common differentially expressed genes including two bone morphogenetic proteins (BMP4 and BMP7), six solute carrier proteins (SLC10A3, SLC16A3, SLC25A1, SLC35B3, SLC7A5 and SLC7A7), transcription factor POU5F1 (POU class 5 homeobox 1), and KLK10 (kallikrein-related peptidase 10). A network analysis revealed a subnetwork with three gene BMP7, NR2F2 and AP2B1 that were consistently over expressed in the chemoresistant tissue or cells compared to the chemosensitive tissue or cells.
Conclusion
Our database offers the first comprehensive view of the digital transcriptomes of ovarian cancer cell lines and tissues with different chemotherapy response phenotypes.
Introduction
Ovarian cancer ranks fourth in cancer mortality among women in the United States with an estimated 14,600 deaths and more than 21,550 new cases in 2009 (American Cancer Society Statistics for 2009). Ovarian carcinoma has remained the most challenging of all the gynecologic malignancies for two reasons. First, early-stage ovarian cancer that has a far better prognosis than late-stage ovarian cancer cannot be easily detected [1]. Early state (Stage I or II) ovarian cancers have a 5-year survival rate of 90% (stage I) or 70% (stage II) whereas late state cancers (Stage III and IV) have only about a 20% 5-year survival rate [2, 3]. Second, standard chemotherapy approaches such as a combination of paclitaxel and carboplatin often fail [2, 3]. Why chemotherapy fails is not completely understood. We hypothesize that a complete understanding of chemotherapy response requires a systems approach to define the pathways involved in chemotherapy response and to understand how genes in pathways work together by systematic perturbation followed by the observation on the effects of perturbation. A systems approach to chemotherapy responsiveness of ovarian cancer can identify key nodal points in pathways that differ between chemotherapy sensitive and chemotherapy resistant cells. Intervening at the key nodal points will give us the ability to develop novel therapeutic approaches.
A systems approach starts with the delineation of the parts list of a system. The most sensitive technology around today to delineate the parts lists of transcriptomes of cells is applying the next-generation sequencing technologies. In order to study chemotherapy response we have applied two platforms of the next generation (next-gen) sequencing technologies--the massively parallel signature sequencing (MPSS) technology [4, 5] and the sequence-by-synthesis (SBS) technology [6]. The next-gen sequencing technology allows identification and cataloging of almost all mRNAs, even those with only one or a few transcripts per cell. To map network perturbations in cancer initiation and progression, the changes in expression levels of virtually all transcripts must be measured. Differentially expressed genes thus identified can be mapped onto cellular networks to provide a systemic understanding of changes in the cellular state. Certain low-abundance transcripts, such as those encoding transcription factors and signal transducers, wield significant regulatory influences in spite of the fact that they may be present in the cell at very low copy numbers.
We present our analysis in ovarian cancer cells using the next-generation sequencing technologies to understand chemotherapy resistance. Platinum compounds, such as cis and carboplatin, are the most active ovarian cancer chemotherapy drug and the standard treatment for nearly all women diagnosed with ovarian cancer. IGROV-1 and IGROV-1-CP cells are good model systems to use to understand the mechanism of cisplatin resistance. IGROV-1-CP cells are cisplatin resistant ovarian cancer cells derived experimentally from cisplatin sensitive parental IGROV-1 cells after prolonged exposure to cisplatin compound and selection of resistant clones [7]. In additional to cell line model, we also applied the newly developed next-generation technology, named sequence by synthesis (SBS) technology, to sequence two ovarian cancer tissues with extreme sensitivity and extreme resistance to standard combination chemotherapy of carboplatin and paclitaxel [8, 9]. An integrative analysis allowed us to gain a better understanding of the chemotherapy resistance program.
Materials and Methods
Cells and tissues
The human ovarian carcinoma DDP-resistant cell line IGROV-1/CP was kindly provided by Dr. Stephen Howell’s Lab at Moores UCSD Cancer Centre, San Diego, and grown at 37 °C in RPMI 1640 supplemented with 10% fetal bovine serum, 50 IU/ml penicillin and 50ug/ml streptomycin with a humidified atmosphere containing 5% CO2. Ovarian cancer tissues were obtained at the Department of Gynecological Oncology, Roswell Park Cancer Institute, with IRB approval and informed consent.
Next-generation sequencing analysis
For MPSS analysis, MPSS cDNA libraries were constructed, and individual cDNA sequences were amplified and attached to individual beads and sequenced as described elsewhere [4]. The resulting signatures, generally 17 bases in length, were annotated using the most recently annotated human genome sequence, and the human Unigene according to a previously published method [10]. We considered only 100% matches between an MPSS signature and a genome signature. We also excluded those signatures that expressed at less than 3 TPM in both IGROV-1 and IGROV1-CP libraries, as they might not be reliably detected [11]. Additionally, we classified MPSS signatures by their positions relative to polyadenylation signals and poly (A) tails and by their orientation relative to the 5′ → 3′ orientation of source mRNA as we have previously described [5]. The Z-test [12] was used to calculate P values for comparison of gene expression levels between the cell lines. For SBS analysis, the library was prepared using the Solexa/Illumina’s Gene Expression-Tag Profiling with DpnII and sequencing was carried out using the Solexa/Illumina 1 G genetic analyzer. We used the algorithm intensity-dependent selection of expression ratios (ISER)[13] (https://ipe.cbmeg.unicamp.br/pub/PMmA) to identify differentially expressed genes from the SBS data.
If a gene had multiple tags, we kept the information for each tag in the supplementary tables so as to capture alternative spliced and alternative polyadenylated forms. The tag with the most abundant expression (sum of the expression in TPM) was then used to represent the gene.
Gene Ontology analysis
High-Throughput GoMiner [14] was used to find statistically over represented Gene Ontology (GO) terms. The changed list was used as input, and the total list was auto-generated by the program. The root category used is the GO biological process, and the GO terms at level 3 categories were used for the analysis. Enriched GO terms with log10(P) > 2 were considered significant.
Processing of the Cancer Genome Atlas (TCGA)’s next-generation sequencing data and their comparisons to our data
The TCGA data on the next-generation sequencing were down loaded from its data portal (cancergenome.nih.gov/dataportal/). The sequence tags were aligned against cDNA database (GRCh37.55) from the Ensembl (www.ensembl.org/) using the SOAP2 (v2.19) program [15], which is an ultrafast short read alignment tool. Up to 1 mismatch was allowed during the alignment. If a tag was mapped to more than 2 genes, then it was filtered out. If a tag mapped to two genes, its counts was assigned to the more abundant gene. The count numbers of all mapped tags to a gene were summed to represent the expression abundance of the gene. The expression levels were normalized to one million to calculate the expression level in TPM (transcript per million) for each gene. The comparisons of the TCGA’s data to our data were performed at gene levels.
Results
MPSS analysis of IGROV-1 and IGROV1-CP cells
We conducted an MPSS analysis of 2.7 and 2.5 million signatures for the cisplatin sensitive IGROV1 cell line and its cisplatin resistant derivative IGROV1-CP cell line. The raw data for the MPSS dataset are available for download at http://www.zcni.zju.edu.cn/en/OV/download.html. We obtained 16,900 and 18, 938 reliable unique signatures for IGROV1 and IGROV1-CP cells respectively. Transcript tags with matches to a cDNA or EST sequence were further classified based on the signatures’ relative orientation to the transcription direction and their position relative to a polyadenylation site and/or poly(A) tail. We first restricted our analysis to those MPSS signatures corresponding to cDNAs with poly(A) tails and/or polyadenylation sites, so that corresponding genes could be conclusively identified [5]. We used the Z-test [12] to identify differential gene expression. In the end, we obtained 3,422 signatures that were significantly different between IGROV1 and IGROV1-CPcells (P <0.001) (Supplementary Table 1). These tags represented 2,957 genes, suggesting that many of the genes have multiple tags, possibly representing alternative polyadenylated isoforms for which the MPSS technology is able to capture [5, 10, 11].
For those genes with multiple tags, we used the expression value of the most abundant tag to represent that gene. The top 20 over and under expressed genes are shown in Table 1. Interestingly, over expressed genes in the cisplatin resistant cell line IGROV1-CP include macrophage migration inhibitory factor (glycosylation-inhibiting factor), bone morphogenetic protein 7 (osteogenic protein 1), nuclear receptor co-repressor 2, and CD59. Top genes that are over expressed in the cisplatin sensitive cell line IGROV1 include thioredoxin interacting protein, insulin-like growth factor binding protein 1, pentatricopeptide repeat domain 3 and chloride intracellular channel 4. Additionally, we identified many novel genes without functional annotations, such as hypothetical protein MGC61571 and chromosome 17 open reading frame 81, as among the top differentially expressed genes.
Table 1.
Top 20 up and down regulated genes in IGROV1_CP comparing to IGROV1
| Gene Name | IGROV1 _CP (tpm) | IGROV1 (tpm) | Ratio* | Description | GO biological functions |
|---|---|---|---|---|---|
| NEK8 | 0 | 106 | 0 | NIMA (never in mitosis gene a)- related kinase 8 | protein amino acid phosphorylation |
| PARVB | 0 | 88 | 0 | Parvin, beta | cell adhesion |
| CLIC4 | 0 | 88 | 0 | Chloride intracellular channel 4 | chloride transport, negative regulation of cell migration |
| EIF3EIP | 0 | 95 | 0 | Eukaryotic translation initiation factor 3, subunit E interacting protein | initiation of protein synthesis |
| FHIT | 0 | 103 | 0 | Fragile histidine triad gene | DNA replication, diadenosine triphosphate catabolic process |
| AGPAT1 | 135 | 0 | infinite | 1-acylglycerol-3- phosphate O- acyltransferase 1 (lysophosphatidic acid acyltransferase, alpha) | positive regulation of cytokine production, phospholipid metabolic process |
| MGC61571 | 0 | 99 | 0 | Hypothetical protein MGC61571 | unknown |
| MRPL1 | 0 | 175 | 0 | Mitochondrial ribosomal protein L1 | RNA processing, translation |
| EIF2AK1 | 0 | 164 | 0 | Eukaryotic translation initiation factor 2-alpha kinase 1 | translation, cell differentiation, protein amino acid autophosphorylation |
| IGFBP1 | 0 | 473 | 0 | Insulin-like growth factor binding protein 1 | regulation of cell growth, signal transduction, insulin receptor signaling pathway |
| ANKMY2 | 134 | 0 | infinite | Ankyrin repeat and MYND domain containing 2 | unknown |
| GLT25D1 | 113 | 0 | infinite | Glycosyltransferase 25domain containing 1 | lipopolysaccharide biosynthetic process |
| ADCY1 | 0 | 145 | 0 | Adenylate cyclase 1 (brain) | cAMP biosynthetic process, intracellular signaling cascade, hormone-mediated signaling |
We applied GO term enrichment analysis to the over or under expressed genes using GO miner with level 3 categories. The enriched GO terms with log10(P) > 2 are shown in Figure 1–2 and in Supplementary Table 2. We found that GO:0001837 (epithelial to mesenchymal transition) is enriched in genes that are over expressed in IGROV1-CP cells with 4 out of 9 genes (Table 2) in this GO term changed significantly in expression levels. These four genes are: CTNNB1 (catenin beta 1), S100A4 (S100 calcium binding protein A4), TGFB1 (transforming growth factor, beta 1) and BMP7 (bone morphogenetic protein 7). Their expression levels in IGROV1-CP and IGROV1 are shown in Table 2.
Figure 1.
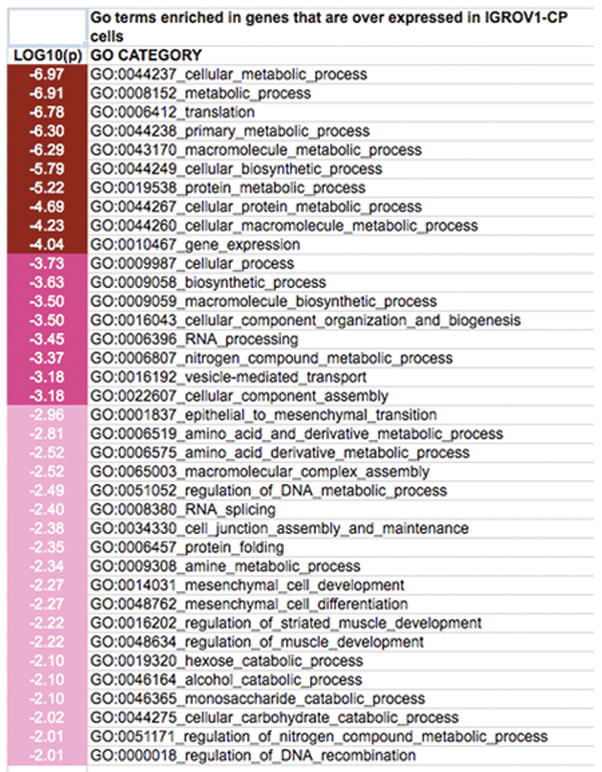
A chart showing the over represented Gene Ontology terms in genes over expressed in IGROV1-CP cells comparing to IGROV1 cells. The shade of the red color indicates the P values of enrichments [Log10(P)].
Figure 2.
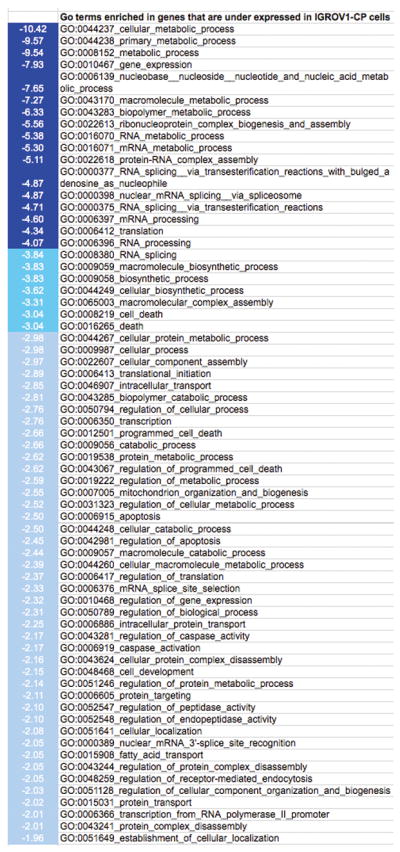
A chart showing the over represented Gene Ontology terms in genes over expressed in IGROV1 cells comparing to IGROV1-CP cells. The shade of the blue-cyan color indicates the P values of enrichments [Log10(P)].
Table 2.
Genes in GO term 0001837 and 0034330
| GO terms | Gene Name | Description | IGROV1-CP* | IGROV1 |
|---|---|---|---|---|
| GO:0001837_epithelial_to_mesenchymal_transition | CTNNB1 | Catenin (cadherin-associated protein), beta 1, 88kDa | 218 | 71 |
| GO:0001837_epithelial_to_mesenchymal_transition | S100A4 | S100 calcium binding protein A4 | 458 | 191 |
| GO:0001837_epithelial_to_mesenchymal_transition | TGFB1 | Transforming growth factor, beta 1 | 16 | 0 |
| GO:0001837_epithelial_to_mesenchymal_transition | BMP7 | Bone morphogenetic protein 7 (osteogenic protein 1) | 180 | 0 |
| GO:0034330_cell_junction_assembly_and_maintenance | LAMC1 | Laminin, gamma 1 (formerly LAMB2) | 821 | 408 |
| GO:0034330_cell_junction_assembly_and_maintenance | PARD6A | Par-6 partitioning defective 6 homolog alpha (C. elegans) | 19 | 0 |
| GO:0034330_cell_junction_assembly_and_maintenance | TLN1 | Talin 1 | 149 | 35 |
| GO:0034330_cell_junction_assembly_and_maintenance | VCL | Vinculin | 80 | 11 |
| GO:0034330_cell_junction_assembly_and_maintenance | PRKCI | Protein kinase C, iota | 26 | 0 |
| GO:0034330_cell_junction_assembly_and_maintenance | ITGA6 | Integrin, alpha 6 | 37 | 8 |
expression in tpm
Another interesting GO term enriched in genes that are over expressed in IGROV1-CP cells is the GO term GO:0034330 (cell junction assembly and maintenance) with six genes over expressed in IGROV1-CP cells compared to IGROV1 cells (Table 2).
For genes over expressed in IGROV1, the cisplatin sensitive cell line, we found that multiple enriched GO terms related to cell death are enriched (Figure 2 and Supplementary Table 2), which include GO:0008219 cell death, GO:0012501 programmed cell death, GO:0043067 regulation of programmed cell death and GO:0006915 apoptosis. For example, 61 genes of 426 genes related to GO:0006915 apoptosis is over expressed in IGROV1 cells compared to IGROV1-CP cells (data not shown).
SBS analysis of chemotherapy resistant and sensitive tissues of ovarian cancer
In order to study the chemotherapy response program in clinical samples, we selected two ovarian cancer tissues: one with complete response and the other with a persistent resistance to chemotherapy. The clinical information of the two cases is shown in Table 3. It is not easy to obtain these extreme cases as most of the tissues show partial response to chemotherapy. After SBS sequencing, 1,762,449 and 1,290,935 tags could be mapped to the human genome for the ovarian cancer tissue sample; 12,344 and 12,628 respectively. These tags can be reduced to 20,775 unique genes.
Table 3.
Clincinal information of the two ovarian cancer tissues used for
| Sample ID | Age | Stage | Grade | HistoType | Clinical Response | Recurrence |
|---|---|---|---|---|---|---|
| 12344 | 62 | IIIC | Moderately differentiated | serous | Persistent Resistance | Yes |
| 12628 | 62 | IIIC | Moderately differentiated | serous | Complete Response | No |
Unlike MPSS analysis, in which multiple sequencing runs (two-stepper or four steppers) were generated [4, 11], SBS does not generate replicate runs. The Z-test that we used in the MPSS analysis was not applicable here for the analysis of the SBS data. We have therefore applied another program named intensity-dependent selection of expression ratios (ISER)[13] (https://ipe.cbmeg.unicamp.br/pub/PMmA), which was developed to analyze DNA array data when little or no replication of array hybridizations is available. Using a P value < 0.05, we identified a total of 4,348 differentially expressed genes. As differential expression of those low expression genes might not be reliably detected, we additionally set the filter so that the sum of the expression would be at least 30 TPM for the two samples. In the end, we identified 1,187 tags (corresponding to 1,040 genes) that were differentially expressed between the chemotherapy responsive tissue and the chemotherapy persistent resistant tissue (Supplementary Table 3).
Applying Gene Ontology analysis, we found that GO:0050673 epithelial cell proliferation and GO:0050678 regulation of epithelial cell proliferation were enriched in the genes over expressed in the chemotherapy resistant tissue while the GO:0007229 integrin-mediated signaling pathway was enriched in the genes over expressed in the chemotherapy sensitive tissue (Figure 3 and Supplementary Table 4). The genes involved in these GO terms and their associated expression values are shown in Table 4. Three gene COL3A1, PTK2 and ADAMTS1, which belong to the GO:0007229 integrin-mediated signaling pathway, were over expressed in the chemotherapy sensitive tissue when compared to the chemotherapy resistant tissue. In addition, three laminin genes (LAMA1, LAMB1, LAMC1), keratin 4 and cyclin-dependent kinase inhibitor 1C (p57, Kip2) were over expressed in the chemotherapy resistant tissue when compared to the chemotherapy sensitive tissue (Table 4).
Figure 3.
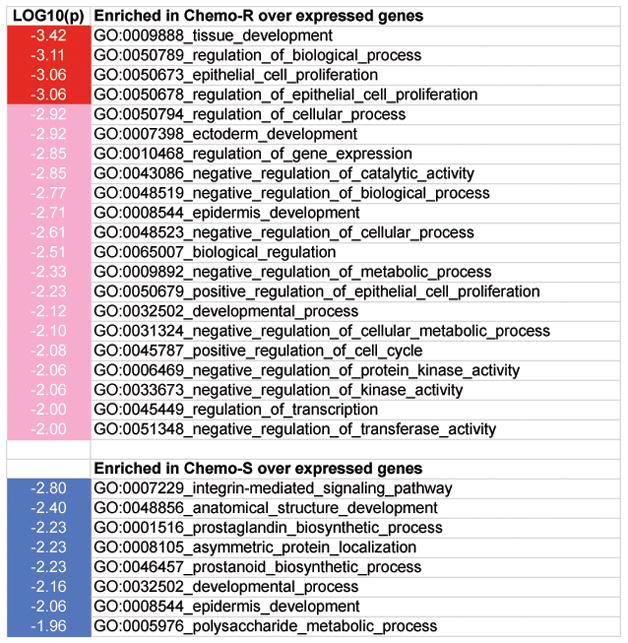
A chart showing the over represented Gene Ontology terms in genes over expressed in chemosensitive (Chemo-S) or chemoresistant (Chemo-R) tissues. The shade of the blue or red colors indicates the P values of enrichments [Log10(P)].
Table 4.
Genes in interesting enriched GO terms for differentially expressed genes between chemotherapy resistant and sensitive ovarian cancer tissues
| GO term | Gene Name | Description | Sample_1234 4 (Chemo-R) | Sample__1262 8 (chemo-S) |
|---|---|---|---|---|
| GO:0007229_integrin- mediated_signaling_pathway | COL3A1 | Collagen, type III, alpha 1 (Ehlers- Danlos syndrome type IV, autosomal dominant) | 2242 | 7266 |
| GO:0007229_integrin- mediated_signaling_pathway | PTK2 | PTK2 protein tyrosine kinase 2 | 24 | 84 |
| GO:0007229_integrin- mediated_signaling_pathway | ADAMTS1 | ADAM metallopeptidase with thrombospondin type 1 motif, 1 | 74 | 473 |
| GO:0050673_epithelial_cell_proliferation | LAMC1 | Laminin, gamma 1 (formerly LAMB2) | 201 | 50 |
| GO:0050673_epithelial_cell_proliferation | LAMA1 | Laminin, alpha 1 | 66 | 8 |
| GO:0050673_epithelial_cell_proliferation | KRT4 | Keratin 4 | 101 | 11 |
| GO:0050673_epithelial_cell_proliferation | CDKN1C | Cyclin-dependent kinase inhibitor 1C (p57, Kip2) | 144 | 15 |
| GO:0050673_epithelial_cell_proliferation | LAMB1 | Laminin, beta 1 | 78 | 18 |
Integrative analysis of ovarian cancer cell line cisplatin resistant model and the ovarian cancer tissue resistant model
The cell line model of IGROV1-CP and IGROV1 represents the acquired resistant model for cisplatin, as IGROV-1-CP cells are cisplatin resistant ovarian cancer cells derived from its cisplatin sensitive parental IGROV-1 cells after prolonged exposure to cisplatin compound and selection of resistant clones [7]. However, carboplatin and paclitaxel combination treatment is the standard first-line chemotherapy regimen [8, 9]. The analysis using the chemotherapy resistant and sensitive ovarian cancer tissues thus represents a model for the combination chemotherapy response. We were curious whether there are common mechanisms or common differentially regulated genes between these two models. Using gene name as common identifiers, we identified a total of 228 genes (21.9%, 228/1,040 genes) that are common to the two analyses (Supplementary Table 5). Among them, 110 genes changed in the same direction in the comparison between chemotherapy resistant (IGROV1-CP or the chemoresistant tissue 12344) vs. chemotherapy sensitive (IGROV1 or the chemosensitive tissue 12628) samples (Table 5). This list includes many interesting genes such as two BMP proteins (BMP4 and BMP7), six solute carrier proteins, transcription factor POU5F1 (POU class 5 homeobox 1), and KLK10 (kallikrein-related peptidase 10).
Table 5.
Genes that are changed in the same direction in the cell line model and the ovarian cancer tissue model
| common genes | Description | IGROV1 _CP | IGROV1 | 12344 (Chemo- R) | 12628 (chemo- S) |
|---|---|---|---|---|---|
| CYP26B1 | Cytochrome P450, family 26, subfamily B, polypeptide 1 | 46 | 0 | 67 | 2 |
| AP2B1 | Adaptor-related protein complex 2, beta 1 subunit | 52 | 8 | 110 | 14 |
| PSMB1 | Proteasome (prosome, macropain) subunit, beta type, 1 | 151 | 70 | 976 | 265 |
| LYPLA2 | Lysophospholipase II | 182 | 96 | 199 | 24 |
| MRC2 | Mannose receptor, C type 2 | 64 | 154 | 101 | 375 |
| FHL1 | Four and a half LIM domains 1 | 36 | 2 | 489 | 46 |
| RPL26L1 | Ribosomal protein L26-like 1 | 20 | 0 | 160 | 46 |
| NEDD4L | Neural precursor cell expressed, developmentally down-regulated 4- like | 44 | 8 | 48 | 8 |
| SP100 | SP100 nuclear antigen | 23 | 0 | 49 | 12 |
| DUSP1 | Dual specificity phosphatase 1 | 168 | 53 | 578 | 93 |
| PABPC1 | Poly(A) binding protein, cytoplasmic 1 | 5033 | 7569 | 1232 | 3655 |
| SDHA | Succinate dehydrogenase complex, subunit A, flavoprotein (Fp) | 137 | 51 | 40 | 6 |
| ADK | Adenosine kinase | 55 | 0 | 61 | 17 |
| ARHGEF1 | Rho guanine nucleotide exchange factor (GEF) 1 | 98 | 23 | 139 | 35 |
| TP53INP2 | Tumor protein p53 inducible nuclear protein 2 | 37 | 0 | 61 | 14 |
| LAMB1 | Laminin, beta 1 | 726 | 234 | 78 | 18 |
| PHGDH | Phosphoglycerate dehydrogenase | 42 | 0 | 219 | 54 |
| SLC25A1 | Solute carrier family 25 (mitochondrial carrier; citrate transporter), member 1 | 103 | 293 | 25 | 100 |
Gene Ontology analysis of this 110 common list of genes revealed many interesting GO terms that are enriched including GO:0050679 positive regulation of epithelial cell proliferation and GO:0046942 carboxylic acid transport (Table 6). Three genes belonging to GO:0046942 carboxylic acid transport are SLC25A1, SLC16A3 and SLC7A5.
Table 6.
Enriched GO terms in the common differentially expressed genes between the cell line and the tissue model of ovarian cancer chemotherapy
| GO CATEGORY | TOTAL GENES | CHANGED GENES | ENRICHMENT | LOG10(p) |
|---|---|---|---|---|
| GO:0050679_positive_regulation_of_epithelial_cell_proliferation | 10 | 2 | 25.66 | −2.59 |
| GO:0032268_regulation_of_cellular_protein_metabolic_process | 138 | 5 | 4.65 | −2.38 |
| GO:0046942_carboxylic_acid_transport | 44 | 3 | 8.75 | −2.33 |
| GO:0015849_organic_acid_transport | 45 | 3 | 8.55 | −2.30 |
| GO:0051246_regulation_of_protein_metabolic_process | 148 | 5 | 4.33 | −2.25 |
| GO:0031323_regulation_of_cellular_metabolic_process | 796 | 13 | 2.10 | −2.19 |
| GO:0016477_cell_migration | 98 | 4 | 5.24 | −2.16 |
| GO:0019222_regulation_of_metabolic_process | 810 | 13 | 2.06 | −2.13 |
| GO:0007005_mitochondrion_organization_and_biogenesis | 55 | 3 | 7.00 | −2.06 |
| GO:0042325_regulation_of_phosphorylation | 58 | 3 | 6.64 | −1.99 |
| GO:0045333_cellular_respiration | 20 | 2 | 12.83 | −1.99 |
| GO:0050673_epithelial_cell_proliferation | 20 | 2 | 12.83 | −1.99 |
| GO:0050678_regulation_of_epithelial_cell_proliferation | 20 | 2 | 12.83 | −1.99 |
| GO:0007049_cell_cycle | 317 | 7 | 2.83 | −1.97 |
Recently, the Cancer Genome Atlas (TCGA) recently deposited and released some next-generation sequencing data for ovarian cancers on the TCGA data portal. Sixteen of the samples were defined as complete response samples. However, only three samples were defined as progressive disease samples. Our term “chemosensitive” is comparable to the term “complete response” used in TCGA, and “chemoresistant” is comparable to the term “progressive disease” used in TCGA. We downloaded the raw data file, processed to get differentially expressed genes between the complete response group and the progressive disease group. We then compared the differentially expressed genes (using 1.5 fold as cutoff values) of the TCGA data and the differentially expressed genes we identified in table 5. We were able to found 15 genes that were down regulated in the complete response group compared with the progressive disease group. Among them, 11 genes (73%) also showed as down regulated in the chemosensitive group compared with the chemoresistant group in our sequencing data. In addition, among the 6 genes that were identified as over expressed in the TCGA data in the “progressive disease” group compared with the “complete response” group, 50% (3 of the 6) were consistent with our data (Supplementary Table 6). Considering the expected high degree of tumor heterogeneity and that the experiments were performed in different laboratories, an overall consistency of 67% (14/21) for both up- and down-regulated genes is pretty high, suggesting that the expression profiling by the next-generation sequencing used both by TCGA and us generated comparable data.
Network analysis of the commonly differentially expressed genes of ovarian cancer cell line cisplatin resistant model and the ovarian cancer tissue resistant model
In an attempt to gain further insight of the potential mechanism of the chemotherapy response based on the commonly differentially expressed genes of ovarian cancer cell line cisplatin resistant model and the ovarian cancer tissue resistant model, we took an approach to building a protein-protein interaction network of these proteins and then to identifying the proteins with the most interacting partners (i.e. network hubs) as key nodal control points for therapeutic intervention. We therefore analyzed the common gene list using Cytoscape with the MiMI plugin [16] to identify protein-protein interactions allowing a maximum of one neighbor to connect the proteins in the list. Cytoscape is a widely used open source software tool for displaying interactions of molecules [17]. The MiMi plugin for Cytoscape (http://mimiplugin.ncibi.org/) was developed to facilitate access to the molecular interaction data assembled in MiMI that contains integrated data from multiple well-known protein interaction databases using an intelligent deep-merging approach [18]. The MiMi plugin retrieves molecular interactions and interaction attributes from MiMI and displays the interaction networks and attributes using Cytoscape [16]. In the end, we obtained a network contains 540 nodes and 1907 edges (Supplementary Figure 1). The sif file for the combined network is shown in Supplementary Table 7.
As the resulting network is complicated, we tried to identify key nodal points in the network using MCODE [19], a Cytoscape plugin that finds clusters (highly interconnected regions) in a network. We identified an over expressed subnetwork that is over expressed in the chemotherapy resistant tissue or in the cisplatin resistant IGROV1-CP cells compared to the chemotherapy sensitive tissue or cisplatin sensitive IRGOV1 cells. This subnetwork contains three genes that are over expressed in the chemoresistant tissue or cells. They are: BMP7 (bone morphogenetic protein 7), NR2F2 (nuclear receptor subfamily 2, group F, member 2) and AP2B1 (Adaptor-related protein complex 2, beta 1 subunit) (Figure 4). However, we did not find any significant network cluster with genes over expressed in the chemosensitive tissue or cells using the MCODE program.
Figure 4.
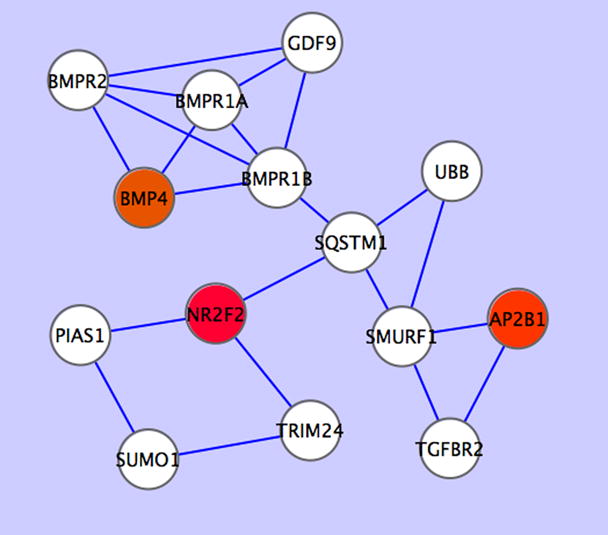
A subnetwork that is over expressed in the chemoresistant cells compared to the chemosensitive cells. The log2 expression ratios of the chemoresistant tissue to the chemosensitive tissue were overlaid onto the network. Red color indicates over expression and white color indicates no significant differentially expression. Circles indicate nodes (proteins) and lines indicate protein-protein interaction taken from the Human Protein Reference Database (HPRD) (http://www.hprd.org/).
Discussion
We applied two next-generation sequencing technologies (the MPSS and the SBS technology) to study two ovarian chemotherapy response models: the acquired cisplatin resistant cell line model (IGROV1-CP and IGROV1) and the ovarian cancer tissue resistant model. Our database offers the first comprehensive view of the digital transcriptomes of ovarian cancer cell lines and tissues with different chemotherapy response phenotypes. These are the first steps toward a systems approach to disease through an integrative, systemic understanding of chemotherapy response at system and network levels. We previously reported a limited proteomics analysis of 1117 proteins in IGROV1 and IGROV1-CP cells, with integrated analysis of these proteins with their corresponding transcript levels obtained by the MPSS technology [20]. In this manuscript, we reported the complete data set for the MPSS analysis, and the integrated analysis of the MPSS data with the SBS data, which was newly generated for the chemotherapy resistant and sensitive ovarian cancer tissues.
From the MPSS analysis, we observed that many genes showed a pattern of high expression in one cellular state (e.g. the cisplatin resistant state of IGROV1-CP) but no expression in another state (Table 1 and Supplementary Table 1). Many interesting genes are among the top genes that showed such expression patterns (Table 1). For example, the MIF (macrophage migration inhibitory factor) gene is expressed at 984 TPM in the cisplatin resistant IGROV1-CP cells, but shows no expression in the cisplatin sensitive IGROV1 cells. Agarwal et al. showed that ovarian cancer cells, but not normal cells, secrete significant amounts of MIF and that serum MIF levels are significantly higher in ovarian cancer patients compared with normal individuals [6]. Hagemann et al. showed that ovarian cancer cell-derived migration inhibitory factor enhances tumor growth, progression, and angiogenesis [21]. Krockenberger et al. found that MIF may contribute to the immune escape of ovarian carcinoma [22]. In contrast, IGFBP1 (insulin-like growth factor binding protein 1) is a gene that is highly expressed in the cisplatin sensitive IGROV1 cells (473 TPM) but shows no expression in the cisplatin resistant IGROV1-CP cells. However, the association of IGFBP1 and ovarian cancer chemotherapy has not been reported and its underlying mechanism is not known.
Gene ontology analysis revealed that GO:0001837 (epithelial to mesenchymal transition) is enriched in genes that are over expressed in IGROV1-CP cells compared to IGROV1 cells, suggesting that the EMT process may be related to the acquired resistance to chemotherapy. Four of the genes in this GO terms were over expressed in IGROV1-CP cells compared to IGROV1 cells, which include CTNNB1 (catenin beta 1), S100A4 (S100 calcium binding protein A4), TGFB1 (transforming growth factor, beta 1) and BMP7 (bone morphogenetic protein 7) (Table 2). Epithelial-to-mesenchymal transition (EMT) is a vital process for morphogenesis during embryonic development. It is also implicated in the conversion of early stage tumors into invasive malignancies by molecular changes that facilitates cell motility and invasion [23]. Yang et al. recently showed that the oxaliplatin-resistant (OxR) colorectal cancer (CRC) cells underwent EMT characterized by the phenotypic changes including spindle-cell shape, loss of polarity, intercellular separation, and pseudopodia formation [24]. Oxaliplatin is another platinum-based cancer chemotherapy drug similar to cisplatin [25]. Our data suggest that the EMT process may also play a role in the transition of cisplatin sensitive IGROV1 to cisplatin resistant IGROV1-CP cells.
There may exist different mechanisms for conferring chemotherapy resistance in the cell line model vs. the tissue model. In the cell line model, the sensitivity to cisplatin seems to be related to increased cell deaths and apoptosis (Supplementary Table 2). However, in the tissue model, other extracellular factors may also play roles. Tissues are a mixture of epithelial and stromal cells, and the stromal components including extracelluar matrix proteins may play roles in modulating drug penetrance, and thus modifying chemotherapy responses. We found that in the tissue model, genes involved in the extracellular matrix such as laminin genes (e.g. LAMA1, LAMB1, LAMC1), keratins (e.g. keratin 4), and collagens (e.g. COL3A1) were differentially expressed. This observation is similar to the findings in our recent quantitative proteomics analysis of proteins differentially expressed between chemotherapy sensitive tissues and chemotherapy resistant tissues, where we identified multiple proteins belonging to the extracellular matrix (ECM) that are over expressed in the chemotherapy resistant tissues [26]. These proteins include decorin, versican, basigin (CD147), fibulin-1, extracellular matrix protein 1, biglycan, fibronectin 1, dermatopontin, alpha-cardiac actin (smooth muscle actin), and an EGF-containing fibulin-like extracellular matrix protein 1 [26].
An integrative analysis of the cell line and tissue model of ovarian cancer chemotherapy responses revealed many common genes that may be the key players in conferring chemotherapy resistance (Table 5). For example, the six solute carrier proteins SLC10A3, SLC16A3, SLC25A1, SLC35B3, SLC7A5, and SLC7A7 belong to the common list, suggesting that these solute carrier proteins may modulate the influx/efflux of drugs from cells and thus modulate chemotherapy response. They may be key therapeutic targets for improving chemotherapy response in ovarian cancers.
A network analysis revealed a subnetwork with three gene BMP7, NR2F2 and AP2B1 that were consistently over expressed in the chemoresistant tissue or cells (Figure 4) compared to the chemosensitive tissue of cells. Our finding is novel because, to our knowledge, the association of these three genes with chemotherapy has not been reported before, nor did the interaction among these genes. BMP4 is a member of the TGF beta family and is involved in TGF beta signaling pathway [27]. Recently, Theriault et al. showed that BMP4 treatment of ovarian cancer cells increased their cellular adhesion, motility and invasiveness [28]. NR2F2, also named chicken ovalbumin upstream promoter-transcription factor II (COUP-TFII), is a nuclear steroid receptor [29] and was initially identified as a transcription factor for the chicken ovalbumin gene [30]. Navab et al. showed that expression of NR2F2 enhanced the invasiveness of human lung carcinoma cells [31]. AP2B1 is one of two large chain components of the assembly protein complex 2, which serves to link clathrin to receptors in coated vesicles [32]. Not much is known about AP2B1 and cancer. We showed here that over expression of these three genes in the subnetwork was associated with resistance to chemotherapy of ovarian cancer cells. The mechanism of over expression of BMP7, NR2F2 and AP2B1 in this subnetwork in conferring chemotherapy resistance warrants further investigation.
Supplementary Material
A network constructed by the Cytoscape program with MiMi plugin for the 110 genes that show consistent expression changes between the ovarian tissue chemotherapy response model and the cell line chemotherapy response model. The sif file for this network is provided in the supplementary table 7. The log2 expression ratios of the chemoresistant tissue to the chemosensitive tissue were overlaid onto the network. Red color indicates over expression, and green color indicates under expression. White color indicates no significant differentially expression. Squares indicate nodes (proteins) and lines indicate protein-protein interaction taken from the Human Protein Reference Database (HPRD) (http://www.hprd.org/).
Acknowledgments
This work was supported by grants 2006AA02A303, 2006AA02Z4A2, 2006DFA32950 and 2007DFC30360 from the MOST (http://www.most.gov.cn/eng/), China, and grants 5P50GM076547, 5U54CA119347 from NIH (www.nih.gov/), USA, a grant from Marsha Rivkin Center for Ovarian Cancer Research (www.marsharivkin.org/); a grant by the Cancer Research Institute Ovarian Cancer Working Group Grant (KO); and the Hilton-Ludwig Cancer Metastasis Grant of the Ludwig Institute for Cancer Research (KO and TP).
Abbreviations
- MPSS
massively parallel signature sequencing
- SBS
sequencing by synthesis
- TPM
transcripts per million
Footnotes
Conflict of Interest statement
The authors declare that there are no conflicts of interest.
Publisher's Disclaimer: This is a PDF file of an unedited manuscript that has been accepted for publication. As a service to our customers we are providing this early version of the manuscript. The manuscript will undergo copyediting, typesetting, and review of the resulting proof before it is published in its final citable form. Please note that during the production process errors may be discovered which could affect the content, and all legal disclaimers that apply to the journal pertain.
References
- 1.Clarke-Pearson DL. Clinical practice. Screening for ovarian cancer. N Engl J Med. 2009;361:170–7. doi: 10.1056/NEJMcp0901926. [DOI] [PubMed] [Google Scholar]
- 2.Ozols RF. Outcome issues in ovarian cancer. Oncology (Williston Park) 1995;9:135–9. [PubMed] [Google Scholar]
- 3.Ozols RF. Chemotherapy of ovarian cancer. Cancer Treat Res. 1998;95:219–34. doi: 10.1007/978-1-4615-5447-9_7. [DOI] [PubMed] [Google Scholar]
- 4.Brenner S, Johnson M, Bridgham J, Golda G, Lloyd DH, Johnson D, Luo S, McCurdy S, Foy M, Ewan M, Roth R, George D, Eletr S, Albrecht G, Vermaas E, Williams SR, Moon K, Burcham T, Pallas M, DuBridge RB, Kirchner J, Fearon K, Mao J, Corcoran K. Gene expression analysis by massively parallel signature sequencing (MPSS) on microbead arrays. Nat Biotechnol. 2000;18:630–4. doi: 10.1038/76469. [DOI] [PubMed] [Google Scholar]
- 5.Lin B, White JT, Lu W, Xie T, Utleg AG, Yan X, Yi EC, Shannon P, Khrebtukova I, Lange PH, Goodlett DR, Zhou D, Vasicek TJ, Hood L. Evidence for the presence of disease-perturbed networks in prostate cancer cells by genomic and proteomic analyses: a systems approach to disease. Cancer Res. 2005;65:3081–91. doi: 10.1158/0008-5472.CAN-04-3218. [DOI] [PubMed] [Google Scholar]
- 6.Agarwal R, Whang DH, Alvero AB, Visintin I, Lai Y, Segal EA, Schwartz P, Ward D, Rutherford T, Mor G. Macrophage migration inhibitory factor expression in ovarian cancer. Am J Obstet Gynecol. 2007;196:348, e1–5. doi: 10.1016/j.ajog.2006.12.030. [DOI] [PubMed] [Google Scholar]
- 7.Benard J, Da Silva J, De Blois MC, Boyer P, Duvillard P, Chiric E, Riou G. Characterization of a human ovarian adenocarcinoma line, IGROV1, in tissue culture and in nude mice. Cancer Res. 1985;45:4970–9. [PubMed] [Google Scholar]
- 8.Wang J, Li AJ, Karlan BY. Chemotherapy in epithelial ovarian cancer. Curr Womens Health Rep. 2002;2:20–6. [PubMed] [Google Scholar]
- 9.Ozols RF. Treatment goals in ovarian cancer. Int J Gynecol Cancer. 2005;15 (Suppl 1):3–11. doi: 10.1111/j.1525-1438.2005.15351.x. [DOI] [PubMed] [Google Scholar]
- 10.Meyers BC, Tej SS, Vu TH, Haudenschild CD, Agrawal V, Edberg SB, Ghazal H, Decola S. The use of MPSS for whole-genome transcriptional analysis in Arabidopsis. Genome Res. 2004;14:1641–53. doi: 10.1101/gr.2275604. [DOI] [PMC free article] [PubMed] [Google Scholar]
- 11.Jongeneel CV, Iseli C, Stevenson BJ, Riggins GJ, Lal A, Mackay A, Harris RA, O’Hare MJ, Neville AM, Simpson AJ, Strausberg RL. Comprehensive sampling of gene expression in human cell lines with massively parallel signature sequencing. Proc Natl Acad Sci U S A. 2003 doi: 10.1073/pnas.0831040100. [DOI] [PMC free article] [PubMed] [Google Scholar]
- 12.Man MZ, Wang X, Wang Y. POWER_SAGE: comparing statistical tests for SAGE experiments. Bioinformatics. 2000;16:953–9. doi: 10.1093/bioinformatics/16.11.953. [DOI] [PubMed] [Google Scholar]
- 13.Drummond RD, Pinheiro A, Rocha CS, Menossi M. ISER: selection of differentially expressed genes from DNA array data by non-linear data transformations and local fitting. Bioinformatics. 2005;21:4427–9. doi: 10.1093/bioinformatics/bti729. [DOI] [PubMed] [Google Scholar]
- 14.Zeeberg BR, Qin H, Narasimhan S, Sunshine M, Cao H, Kane DW, Reimers M, Stephens RM, Bryant D, Burt SK, Elnekave E, Hari DM, Wynn TA, Cunningham-Rundles C, Stewart DM, Nelson D, Weinstein JN. High-Throughput GoMiner, an ‘industrial-strength’ integrative gene ontology tool for interpretation of multiple-microarray experiments, with application to studies of Common Variable Immune Deficiency (CVID) BMC Bioinformatics. 2005;6:168. doi: 10.1186/1471-2105-6-168. [DOI] [PMC free article] [PubMed] [Google Scholar]
- 15.Li R, Yu C, Li Y, Lam TW, Yiu SM, Kristiansen K, Wang J. SOAP2: an improved ultrafast tool for short read alignment. Bioinformatics. 2009;25:1966–7. doi: 10.1093/bioinformatics/btp336. [DOI] [PubMed] [Google Scholar]
- 16.Gao J, Ade AS, Tarcea VG, Weymouth TE, Mirel BR, Jagadish HV, States DJ. Integrating and annotating the interactome using the MiMI plugin for cytoscape. Bioinformatics. 2009;25:137–8. doi: 10.1093/bioinformatics/btn501. [DOI] [PMC free article] [PubMed] [Google Scholar]
- 17.Shannon P, Markiel A, Ozier O, Baliga NS, Wang JT, Ramage D, Amin N, Schwikowski B, Ideker T. Cytoscape: a software environment for integrated models of biomolecular interaction networks. Genome Res. 2003;13:2498–504. doi: 10.1101/gr.1239303. [DOI] [PMC free article] [PubMed] [Google Scholar]
- 18.Jayapandian M, Chapman A, Tarcea VG, Yu C, Elkiss A, Ianni A, Liu B, Nandi A, Santos C, Andrews P, Athey B, States D, Jagadish HV. Michigan Molecular Interactions (MiMI): putting the jigsaw puzzle together. Nucleic Acids Res. 2007;35:D566–71. doi: 10.1093/nar/gkl859. [DOI] [PMC free article] [PubMed] [Google Scholar]
- 19.Bader GD, Hogue CW. An automated method for finding molecular complexes in large protein interaction networks. BMC Bioinformatics. 2003;4:2. doi: 10.1186/1471-2105-4-2. [DOI] [PMC free article] [PubMed] [Google Scholar]
- 20.Stewart JJ, White JT, Yan X, Collins S, Drescher CW, Urban ND, Hood L, Lin B. Proteins associated with Cisplatin resistance in ovarian cancer cells identified by quantitative proteomic technology and integrated with mRNA expression levels. Mol Cell Proteomics. 2006;5:433–43. doi: 10.1074/mcp.M500140-MCP200. [DOI] [PubMed] [Google Scholar]
- 21.Hagemann T, Robinson SC, Thompson RG, Charles K, Kulbe H, Balkwill FR. Ovarian cancer cell-derived migration inhibitory factor enhances tumor growth, progression, and angiogenesis. Mol Cancer Ther. 2007;6:1993–2002. doi: 10.1158/1535-7163.MCT-07-0118. [DOI] [PubMed] [Google Scholar]
- 22.Krockenberger M, Dombrowski Y, Weidler C, Ossadnik M, Honig A, Hausler S, Voigt H, Becker JC, Leng L, Steinle A, Weller M, Bucala R, Dietl J, Wischhusen J. Macrophage migration inhibitory factor contributes to the immune escape of ovarian cancer by down-regulating NKG2D. J Immunol. 2008;180:7338–48. doi: 10.4049/jimmunol.180.11.7338. [DOI] [PMC free article] [PubMed] [Google Scholar]
- 23.Kang Y, Massague J. Epithelial-mesenchymal transitions: twist in development and metastasis. Cell. 2004;118:277–9. doi: 10.1016/j.cell.2004.07.011. [DOI] [PubMed] [Google Scholar]
- 24.Yang AD, Fan F, Camp ER, van Buren G, Liu W, Somcio R, Gray MJ, Cheng H, Hoff PM, Ellis LM. Chronic oxaliplatin resistance induces epithelial-to-mesenchymal transition in colorectal cancer cell lines. Clin Cancer Res. 2006;12:4147–53. doi: 10.1158/1078-0432.CCR-06-0038. [DOI] [PubMed] [Google Scholar]
- 25.Graham J, Mushin M, Kirkpatrick P. Oxaliplatin. Nat Rev Drug Discov. 2004;3:11–2. doi: 10.1038/nrd1287. [DOI] [PubMed] [Google Scholar]
- 26.Pan S, Cheng L, White JT, Lu W, Utleg AG, Yan X, Urban ND, Drescher CW, Hood L, Lin B. Quantitative proteomics analysis integrated with microarray data reveals that extracellular matrix proteins, catenins, and p53 binding protein 1 are important for chemotherapy response in ovarian cancers. OMICS. 2009;13:345–54. doi: 10.1089/omi.2009.0008. [DOI] [PMC free article] [PubMed] [Google Scholar]
- 27.Candia AF, Watabe T, Hawley SH, Onichtchouk D, Zhang Y, Derynck R, Niehrs C, Cho KW. Cellular interpretation of multiple TGF-beta signals: intracellular antagonism between activin/BVg1 and BMP-2/4 signaling mediated by Smads. Development. 1997;124:4467–80. doi: 10.1242/dev.124.22.4467. [DOI] [PubMed] [Google Scholar]
- 28.Theriault BL, Shepherd TG, Mujoomdar ML, Nachtigal MW. BMP4 induces EMT and Rho GTPase activation in human ovarian cancer cells. Carcinogenesis. 2007;28:1153–62. doi: 10.1093/carcin/bgm015. [DOI] [PubMed] [Google Scholar]
- 29.Wang LH, Tsai SY, Cook RG, Beattie WG, Tsai MJ, O’Malley BW. COUP transcription factor is a member of the steroid receptor superfamily. Nature. 1989;340:163–6. doi: 10.1038/340163a0. [DOI] [PubMed] [Google Scholar]
- 30.Sagami I, Tsai SY, Wang H, Tsai MJ, O’Malley BW. Identification of two factors required for transcription of the ovalbumin gene. Mol Cell Biol. 1986;6:4259–67. doi: 10.1128/mcb.6.12.4259. [DOI] [PMC free article] [PubMed] [Google Scholar]
- 31.Navab R, Gonzalez-Santos JM, Johnston MR, Liu J, Brodt P, Tsao MS, Hu J. Expression of chicken ovalbumin upstream promoter-transcription factor II enhances invasiveness of human lung carcinoma cells. Cancer Res. 2004;64:5097–105. doi: 10.1158/0008-5472.CAN-03-1185. [DOI] [PubMed] [Google Scholar]
- 32.Gallusser A, Kirchhausen T. The beta 1 and beta 2 subunits of the AP complexes are the clathrin coat assembly components. EMBO J. 1993;12:5237–44. doi: 10.1002/j.1460-2075.1993.tb06219.x. [DOI] [PMC free article] [PubMed] [Google Scholar]
Associated Data
This section collects any data citations, data availability statements, or supplementary materials included in this article.
Supplementary Materials
A network constructed by the Cytoscape program with MiMi plugin for the 110 genes that show consistent expression changes between the ovarian tissue chemotherapy response model and the cell line chemotherapy response model. The sif file for this network is provided in the supplementary table 7. The log2 expression ratios of the chemoresistant tissue to the chemosensitive tissue were overlaid onto the network. Red color indicates over expression, and green color indicates under expression. White color indicates no significant differentially expression. Squares indicate nodes (proteins) and lines indicate protein-protein interaction taken from the Human Protein Reference Database (HPRD) (http://www.hprd.org/).