

Abstract
A Lab-on-a-chip (LOC) was designed, fabricated and tested for the in vitro detection of botulinum neurotoxin serotype A (BoNT-A) activity using an assay that measures cleavage of a fluorophore-tagged peptide substrate specific for BoNT-A (SNAP-25) by the toxin light chain (LcA). LcA cleavage was detected by Förster Resonance Energy Transfer (FRET) fluorescence. FRET fluorescence was measured by a newly developed portable charge-coupled device (CCD) fluorescent detector equipped with multi-wavelength light-emitting diodes (LED) illumination. An eight V-junction microchannel device for BoNTs activity assays was constructed using Laminated Object Manufacturing (LOM) technology. The six-layer device was fabricated with a Poly(methyl methacrylate (PMMA) core and five polycarbonate (PC) layers micromachined by CO2 laser. The LOC is operated by syringe and is equipped with reagents, sample wells, reaction wells, diffusion traps (to avoid cross contamination among channels) and waste reservoirs. The system was detected LcA at concentrations as low as 0.5 nM, which is the reported sensitivity of the SNAP-25 in vitro cleavage assay. Combined with our CCD detector, the simple point of care system enables the detection of BoNTs activity and may be useful for the performance of other complex medical assays without a laboratory. This approach may realize the potential to enhance the quality of health care delivery for underserved populations.
I. Introduction
Lab-on-a-chip (LOC) technology has the potential to be used for various analytical purposes,1 including for health care delivery for underserved populations as well as for the detection of biohazards in the field without dedicated laboratories and complex equipment. One such biodetection application is the detection of Botulinum neurotoxins (BoNTs). There are seven serotypes (A–G) of botulinum neurotoxins (BoNTs) produced and secreted by Clostridium botulinum.2 Four of them (A, B, E, and F), are normally associated with human illness and are among the deadliest known toxins. BoNTs neurotoxicity results from the BoNT light chain subunit (LcA) cleavage of the soluble N-ethyl maleimide-sensitive fusion protein attachment protein receptors (SNAREs) of the presynaptic vesicles required for neurotransmitter release. Early detection and typing of these toxins is critical for food safety, biosecurity and is essential for providing appropriate and timely medical treatment by enabling the selection of effective antitoxins. The usual environment for performing BoNTs detection and typing (e.g. in the field without a laboratory) requires a portable, rapid detection system.
Although a number of immunological in vitro detection tests for BoNTs are commercially available, the gold standard laboratory test for botulinum toxin activity is the mouse bioassay.3–5 The mouse bioassay is very sensitive and can detect as little as 0.03 ng of botulinum toxin (1 ng = 50% lethal doses for 30 mice) within 6–96 hours.6,7 For the detection of BoNTs presence, several different immunoassays have been developed including enzyme-linked immunosorbent assays (ELISA),8–13 lateral flow,14,15 immunomagnetic beads,16,17 immunoaffinity column18,19 and immunosensors.20–22 While some of these immunoassays have similar sensitivities to the mouse bioassay and are much more rapid, they do not provide information about the activity state of the toxin.
BoNTs activity can be detected in vitro by utilizing the ability of the toxin to cleave SNAREs. For example a specific SNAP-25 peptide which is the substrate for BoNT-A and BoNT-E.10,23–30 Cleavage activity has been detected by mass spectrometry31–33 with a cantilever micromechanical sensor.34,35 However, the most common detection method is based on Förster Resonance Energy Transfer (FRET) detection of the cleavage of the toxin’s target peptide substrate labeled with the FRET pairs. The FRET assay is normally measured with fluorescent sensors.30,36–41
In our previous work,42,43 we developed a portable CCD fluorescence sensor which can be used for the FRET cleavage assay. The sensor enables Point of Care detection of the assay without a laboratory. However, practical application of the assay in the field which will assure the user safety from the toxin will require development of a LOC for this purpose.
Two microfluidics devices have been developed for such an assay. The first is based on toxin-mediated cleavage of a fluorophore-tagged peptide immobilized on beads cleaved by the toxin, releasing fluorescent fragments into solution that can be concentrated at an isolated port via evaporation and detected using microscopy.44 The second device is an automated, molded silicone microdevice with integral valves, pumps, and reagent reservoirs.45 However, both devices are complicated and require a microscope for fluorescent detection, thus limiting the field application of the devices.
PDMS technology is a very common method for microfluidics fabrication. Silicon masters are produced using lithography and can be reused multiple times to produce several chips in parallel. However, this multi-step fabrication technology is relatively slow for prototyping. It can take many hours (or days) to produce the mask, fabricate a master and cure the PDMS.
Another approach for rapidly and inexpensively prototyping LOC devices is lamination microfabrication using direct laser machining of polymer sheets to produce multilayer three-dimensional devices.46–50 The patterns and features of the device are designed using computer aided drawing (CAD) software and cuts in thin sheets of polymer film, such as acrylic, polycarbonate and polyester. Vectoring and engraving are normally done with a CO2 laser cutter, followed by assembly and bonding by successive lamination with adhesive48 and heat49,50 to produce a three-dimensional device.
In contrast to PDMS technology, the laser microfabrication described in the paper is a single step, and generally takes a minute or less to fabricate a layer. Developing a complex 3D PDMS device (e.g. with six layers) is extremely challenging, whilst using the lamination technology we chose requires only a simple alignment of the layers and gentle pressing.
The typical feature sizes that can be fabricated using laser cutting are 100–200 μM, while PDMS is well-suited for fabrication at the nm scale. The nm scale fabrication of PDMS is appropriate for special applications such as isolating circulating tumour cells51–53. However, the biological assays that we are developing devices for are typically performed in micoliter volumes, so the 100–200 μM scale of laser fabrication is better suited.
In this work, we applied lamination technology for development of a portable detection LOC for BoNTs FRET based activity detection. A similar approach can be used for delivery of other medical diagnostics tools for underserved populations.
2. Experimental
2.1 Materials and reagents
All chemicals were of reagent grade and used as received from the manufacturer. Bovine serum albumin (BSA), zinc chloride (ZnCl), and N-[2-hydroxyethyl] piperazine-N′[2-ethane sulfonic acid] (HEPES) were obtained from Sigma-Aldrich (St. Louis, MO). The SNAP-25 peptide substrate, internally labeled with the FRET pair fluorescein-thiocarbamoyl (FITC) and 4-(dimethyla-minoazo)benzene-4-carboxylic acid (DABCYL), were purchased from List Biological Laboratories (FITC/DABCYL-SNAP-25; Campbell, CA). Also obtained from List Biological Laboratories was the positive control FITC-labeled SNAP-25 (FITC-SNAP-25; not labeled with acceptor DABCYL) and the recombinant light chain of BoTN-A (LcA). The LOCs were prepared using 3.2 mm thick Polymethyl methacrylate (PMMA), also known as acrylic (Total Plastics, Harrisburg, PA) and a clear, 0.25 mm thick polycarbonate film (Piedmont Plastics, Beltsville, MD).
2.2 Fabrication of LOC
The eight channel LOC and the nine well plate used in this study were designed in Corel Draw 11 (Corel Corp. Ontario, Canada) and micro-machined in 1/8 inch black acrylic using a computer controlled laser cutter Epilog Legend CO2 65W cutter (Epilog, Golden, CO). Before cutting, layers of PC or PMMA were coated with 3M 9770 adhesive transfer double sided tape (Piedmont Plastics, Beltsville, MD).
2.3 FRET Fluorescence detection
An LED illumination box with red, green, blue and white LEDs was custom built by Luminousfilm (Shreveport, Louisiana). A 16-bit grayscale, cooled-CCD SXVF-M7 camera (Adirondack Video Astronomy, Hudson Falls, NY), equipped with a Tamron manual zoom CCTV 4–12 mm, f1.2 (Spytown, Utopia, NY), blue excitation filter HQ480/20x (Chroma Technology Corp, Rockingham, VT) and a green emission filter EmF D535/40m (Chroma Technology Corp Rockingham, VT) was used for FRET detection.
The CCD image intensities were analyzed using ImageJ software, developed and distributed freely by NIH (http://rsb.info.nih.gov/ij/download.html). Data generated was then imported into Microsoft Excel (Microsoft, Redmond, WA) for further manipulation.
2.4 FRET assay for LC-A and BoTN-A activity detection
The FITC/DABCYL-SNAP-25 FRET-based assay used in this study for the detection of light chain (LcA) was preformed following the manufacturer’s instructions. Typically, a range of LcA concentrations were first prepared between 0.25–16 nM in 20 mM HEPES + 0.3 mM ZnCl + 1 mg/ml BSA, in MicroAmp tubes (PE Biosystems, Foster City, CA). A negative control (no LcA) was also included in each assay. The FITC/DABCYL-SNAP-25 was then added to each MicroAmp tube for a final concentration of 5 μM per tube. These samples were then incubated for 2 hours at 37 °C, either in the nine well plate, or in the LOC. The assays were measured with the LED-CCD detector.
3. Results and discussion
3.1 LED-CCD detection platform for BoNT-A activity
The BoNTs FRET cleavage assay requires a fluorescence detector. Previously, we had developed a portable CCD based fluorescence detector and tested it for sensing BoNT-A and LcA in a nine well plate assay format.42 In the current modular platform shown in figure 1, the basic configuration of the detector was kept but with three primary modifications. The electroluminescence (EL) illumination source was replaced with a higher intensity multi-wavelength LED system, the cooled CCD camera was replaced with a camera equipped with a higher speed USB 2.0 connection and the lens was replaced with a wider-angle lens, which enables detection of a broader field.
Fig. 1.
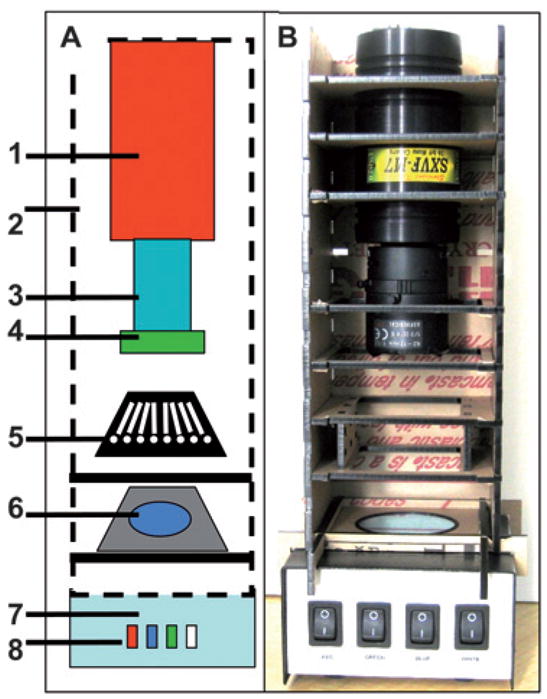
LED-CCD multi-wavelength detector. A schematic configuration of the multi-wavelength LED detector (A), photograph of the detector (B). The elements in the schematic and the photograph of the actual detection platform are: SXVF-M7 CCD camera (1) mounted in a homemade acrylic shelf box (2), which was designed to hold the filters and the sample chips. The camera is equipped with a Tamron manual zoom CCTV 4–12 mm, f1.2 C-mount lens (3) with a green pass band emission filter (4) mounted on the end of the lens. The 8-channel LOC (5) is placed on a shelf in the camera box above the blue band pass excitation filter (6). The camera shelf box is placed on the top of the multi-wavelength LED illuminator (7) with light switches to operate the red, blue, green and white LEDs (8).
The new configuration of the LED-CCD detector is shown schematically in Fig. 1A and the photograph of the detector is shown in Fig. 1B. The detection module consists of a cooled CCD SXVF-M7 camera equipped with USB 2.0 interface which allows high-speed communication between the camera and computer, enabling complex operations when controlled with Labview or other control software for system automation. The fixed angle Pentax 12 mm lens used in previous work was replaced with a Tamron manual zoom CCTV 4–12 mm, f1.2 lens. The 4 mm focal length of the lens permits wide angle imaging suitable for signal detection from the broad array of assay formats developed in our lab, including 96-well sample analysis (e.g. 50 × 35 mm surface) from a short distance (9 cm). Our previous 12 mm lens was only capable of viewing a limited space (e.g. 12 × 12 mm surface) from a similar distance. For the BoTN-A activity assay described in this work, a green pass band emission filter was mounted on the end of the lens.
The multi-wavelength LED illumination box contains four RGB LED strips and four daylight LED strips, with 18 LEDs per strip. Each LED color is controlled individually with a switch in the front panel. The top of the box is a diffusion panel (such as 2447, milky white plastic) which assures uniformity of the light.
The LED illumination box provides illumination in the red, green, blue and white ranges, covering a spectrum of 450 nm to 650 nm (red 610–650 nm, green 492–550 nm and blue 450 nm–495 nm). The LED based illuminator’s intensity is ~80 fold higher than the that of the blue Electroluminescence (EL) used in our previous work,42 which reduces excitation time from a couple minutes to less than a second. The multiple wavelengths also enable excitation of many different fluorophors, which makes the detector suitable for broad array of fluorescence detection applications.
3.2 Design and fabrication of LOC for BoNTs activity detection
The laminated LOC device described here is a multilayer, 3D microfluidic structure constructed with a rigid polymer core (e.g., 3.2 mm Poly(methyl methacrylate (PMMA) also known as acrylic) and laminated with layers of thin polymer (e.g., poly-carbonate (PC) film) bonded with adhesive. The relatively thick core provides rigidity to the assembly and space for high volume fluidic reservoirs for purposes such as liquid storage, waste, detection wells, and outlets. The thin polymer laminating layers encapsulate the chip, providing features such as microfluidic channels and fluid connections between layers and mixing chambers.
3.2.1 Functional elements of multi-channel LOC system
Fig. 2 shows the functional elements of the LOC system. Fig. 2A shows an expanded single channel and figure 2B shows the complete design of the assembled eight channel device. For the BoNTs cleavage assay, each channel is designed to mix the BoNTs sample with FRET labeled peptide and detect the signal. As shown in figure 2, each channel is based on a V junction design which is based on the commonly used T-junction. A T-junction is a 3-way junction that merges three channels in a letter “T” shape, with two channels joined in a straight line and the third channel emerging at a 90 degree angle. A V-junction does not have 90 degree angle channels (see figure 2), so it can utilize space more effectively and enables uncomplicated fabrication. As shown in figure 2, the sample reservoir (1) and the reagent reservoir (2) are joined via V junction (3), passing into the 1 mm joining channel (4). The BoNTs cleavage reaction is preformed and monitored in the detection wells (5), designed with air traps on both input and output to capture air bubbles. Since mixing under laminar flow is inefficient and slow, the mixing of the toxin and the substrate peptide is done via flow mixing in the 1.85 mm wells (not under laminar flow). At the end of the channel, a mixing trap chamber (6) prevents diffusion among the connected channels during incubation.
Fig. 2.

Functional elements of multi-channel LOC system. An expanded single channel (A) where the sample reservoir (1) and the reagent reservoir (2) are joined via V junction (3) to the joining channel (4). The cleavage reaction is monitored in the detection wells (5) designed with air traps to minimize air bubbles, followed by a mixing trap (6). The full schematic of eight-channel LOC chip (B), including the eight channel negative pressure distribution splitter (7) connected to a waste chamber (8) to the outlet for a pump or syringe (9). The alignment holes (10) were designed to simplify fabrication. A clear PMMA LOC device (C) photographed with blue illumination to increase contrast.
Eight of these channel designs are connected to a negative pressure distribution splitter (7), which leads to a waste chamber buffer (8). The outlet of the device (9) is connected to a pump or syringe as the prime fluid mover. When a syringe is used, no electric power is needed. Another element of the chip is the set of two holes (10) for layer alignment of the layer during fabrication. In figure 2C, a clear PMMA LOC device was photographed with blue illumination to increase contrast is shown. The clear PMMA enables better visualization of the device, although black PMMA is typically used in actual devices to minimize light scattering and crosstalk between channels.
3.2.2 Design and fabrication of laminated LOC for BoNTs detection
The polycarbonate channel layers are laminated with the adhesive and then cut using CO2 laser (both the adhesive and the polycarbonate). The layer order is such that every second layer is a polymer (normally polycarbonate) layered with double-sided adhesive. The polycarbonate-adhesive layers are assembled, layer-by-layer, by aligning them (using the alignment holes in a two pin device) with the adjoining layers.
The individual layers in the design shown in figure 2 are presented in a top down view in figure 3A. The layer numbers in figure 3 correspond to their order in the chip, with layer I on top. All layers have alignment holes in addition to functional elements, labeled using the numbering scheme introduced in figure 2:
Fig. 3.

Outline of layers for the six layers LOC. Outline of individual layers for the six layer LOC (A), side view of the layers showing fluid flow (B). Layers are numbered in order from the top layer down (I to VI). All the layers are 250 μm PC except the core layer III which is 3.2 mm PMMA. The main elements shown are: sample reservoirs (1), reagent reservoirs (2) connected to the V junction (3) via connecting slits (1A and 2A), through layer pass (3A) to the joining channel (4), detection wells (5) with air bubble traps (5A), mixing traps (6) negative pressure distribution splitter (7) a waste chamber (8) to the outlet for a pump or syringe (9).
Layer I. The top layer, made from PC, seals the LOC upper fluidic channels while enabling loading of samples (1) and reagents (2) and providing an outlet connection for a pump or syringe (9).
Layer II. The second layer, made from PC, includes in addition to the layer I features, joining channels (4), detection wells (5), mixing trap chambers (6) and a waste chamber (8), this layer carries adhesive on both sides.
Layer III. This core layer is made from PMMA, providing rigidity to the LOC and sufficient volume for sample and reagent reservoirs, detection chambers for each channel, as well as the waste chamber and layer pass (3A) which connect the sample/reagent wells to the V-junction (via connecting slits 1A and 2A in layer IV). Black PMMA is used for this layer to minimize optical interference. The PMMA layer carries adhesive on the bottom side.
Layer IV. The forth layer is made from PC and forms a bottom seal for the core layer, sealing the various chambers of layer III. Layer IV also provides inlets for the fluid from the sample and reagent wells for the connecting element of the V junctions (which is located in layer V) via connecting slits (1A and 2A). These relatively large slits assure flow even if the device is not perfectly aligned during fabrication. In addition, layer IV also contains outlets to the detection, waste chambers, mixing trap as well as an outlet for a pump or syringe. Layer IV carries no adhesive.
Layer V. The fifth layer is made from PC and forms the lower fluidic channels with the V junctions (3), negative pressure splitter (7), the detection and waste reservoir and outlet for a pump or syringe. This layer carries adhesive on both sides.
Layer VI. The bottom seal layer is made from PC with no features except the alignment holes.
The side view of the layers displaying the LOC elements and the fluidic flow between the layers is shown in figure 3B. In general, to assure even filling of the detection wells (5), each chamber’s inlets and outlets are at the top of the well.
3.3 Controlling optical noise and fluidics cross-talk between channels
Two types of cross talk between channels were observed. Optical cross talk occurs when an optical signal from one channel (or from the polymer material) interferes with the signal of an adjacent channel and fluidics cross talk occurs when there is mixing or diffusion between channels. Such cross talk decreases sensitivity and limits the usefulness of the LOC.
3.3.1 Controlling optical noise
Fluorescence emission and scattered excitation light can propagate through the chip, causing cross-talk between adjacent channels. This can become a major source of optical noise in the system42,46,54 by increasing background noise thus reducing the sensitivity of the measurements. To limit the effect of fluorescence background, PC, and not Mylar, which is the commonly used material for lamination based fabrication, was used as the main fabrication material due to its lower fluorescence background.42
Previous work used black silicone rubber absorbers46 placed between adjacent channels to optically isolate the channels from each other, avoiding the cross talk between the channels. Although effective, such approach complicates the design and fabrication of the LOC (e.g. introducing additional material and fabrication steps). Such optical background noise is shown in figure 4, which compares the use of a clear PMMA LOC (figure 4A) to a black PMMA LOC (figure 4B). In this experiment, the sample and reagent reservoirs were loaded with fluorescein (channels 1, 3, 5 and 7) and water (channels 2, 4, 6 and 8). Solutions were then drawn to the detection wells (marked with an arrow). The LOC was illuminated by blue LED and the signals of the detection wells were measured by the CCD camera setup. While the signal of the channels with fluorescein was similar for both black and clear LOC, the signal of the channels with water was 3.2 fold higher in the clear PMMA than the black PMMA, suggesting that using black material decreases the noise. Adding air gaps between channels did not reduce the background noise (data not shown).
Fig. 4.

Optical and fluidics cross-talk between channels. A clear LOC with fluidics trap (A), a black LOC with fluidics trap (B) and a black LOC without fluidics trap (C) were loaded with fluorescein (channels 1, 3, 5 and 7) and water (channels 2, 4, 6 and 8). The LOCs were incubated for 120 minutes at room temperature and the signal from the detection wells marked with an arrow was measured every 15 minutes. The plot of diffusion cross talk for the water channels (D) was calculated as a signal/noise ratio where noise is signal at T0 (before diffusion started) without trap (a), with trap (b).
3.3.2 Controlling fluidics cross-talk between channels
Another type of cross talk that occurs in multi-channel devices is the mixing and diffusion of the analyte between chambers and channels. Diffusion of the analyte “upstream” into the channel from the detection port can cause significant dilution and reduce signal. To overcome this problem in previous work, passive “diffusion valve” microchannels were used.44 Such passive diffusion valves are effective for a system in which the channels are not connected and evaporative flow from large reservoir to small used to move fluids. However, such a system is not useful in our system, in which all the channels are connected and a syringe is used to move fluids.
In our design, we use traps (figure 2A–6) which are not filled with liquids at the end of the channels to “separate” the fluidics of the connected channels. The diffusion in a LOC with traps (figure 4B) was compared with a LOC without traps (figure 4C). The sample and reagent reservoirs for both LOCs were loaded with fluorescein (channels 1, 3, 5 and 7) and water (channels 2, 4, 6 and 8). The solutions were drawn to fill the detection wells (but not the traps) for the LOC with traps (figure 4B) or drawn to the waste chamber (figure 4C). The LOCs were incubated for 120 minutes at room temperature and the signal from the detection wells was measured at 0, 10, 30, 60, and 120 min during the incubation period.
The diffusion cross talk between the fluorescein channels and the water channels can be seen in figure 4C. This cross talk was calculated as signal/noise ratio, where the noise is signal at T0 (before diffusion started). The fluidics cross talk was plotted (figure 4D) for the LOC with traps (b, rectangles) and without trap (a, circles). The signal/noise ratio for the water channels with the traps is constant (suggesting no diffusion or mixing), while starting at 10 minutes the ratio for the water channels with no traps is increasing, suggesting diffusion and mixing from the fluorescein channels. This data demonstrates that the traps are effective in preventing diffusion between interconnected channels. Longer channels cannot be used to minimize diffusion because the incubation time for many biological assays is long (e.g. hours), longer channels (with smaller volume) will not be as effective and will increase the size of the device. In addition, when using a manually-controlled device, the traps allow better monitoring of volume (the user can visually observe the trap filling).
3.3.3 Avoiding air bubbles
Another issue with measuring signal is occasional air bubbles trapped in the detection chamber (such bubbles are shown for the plate assay in figure 5A), which complicate measurements. A simple solution for this problem is the small air traps added to both sides of the detection chamber (figure 2A–5), trapping upstream and downstream bubbles.
Fig. 5.

LOC in vitro activity detection of BoNT-A light chain (LcA using the SNAP-25 cleavage assay. The SNAP-25 peptide substrate for BoTN-A is labeled with the FITC donor/DABCYL acceptor FRET pair. Interaction of the substrate with the toxin light chain LcA results in cleavage of the peptide sequence, disrupting the FRET and resulting in increased FITC donor emission as measured by CCD with 500 ms exposure. FRET activity assay was performed in a nine well plate (A) and the 8-channel LOC (B) measured with different concentrations of 2 fold LcA serial dilution in the range 0 to 16 nM nm (with 0 nM used as control) using four replicas. The assay was carried out for two hours in room temperature. The Signal to Noise of the FRET activity assay was calculated as the ratio between the value of the measurement to the value of the control (no LcA) and was plotted (C) for the nine well plate (a) and the LOC (b).
In summary, the use of channel geometry, traps and black material helps limit the optical and fluidics “noise”, which improves the overall sensitivity of detection.
3.4 LOC detection of botulinum Neurotoxin-A light chain
For the Botulinum Toxin Activity FRET assay, the peptide substrate for BoTN-A (SNAP-25) is labeled with the FITC donor/DABCYL acceptor FRET pair. In this peptide, the close proximity of the DABCYL quenches FITC fluorescence. Interaction of the substrate with the toxin light chain LcA used in this work (or the full toxin BoTN-A) results in cleavage of the peptide sequence, disrupting the FRET and resulting in FITC fluorescence at 523 nm which is measured by CCD. As in our previous work42 the FITC/DABCYL-SNAP-25 was used at a fixed 5 μM concentration and exposed to different concentrations of a 2 fold LcA serial dilution in the range 0.25 nM to 16 nM. The assay was carried out for two hours in room temperature using four identical LOCs and two 9-well plates previously described,42 excited with blue LED. The actual CCD images are shown in shown in figure 5A for the plate and figure 5B for the LOC. In each of the wells of the plate assay (figure 5A) there are bubbles of trapped air which complicate the measurement. The plot of the ImageJ quantization analysis of the results is shown in figure 5C (the nine well plate (a) and the LOC (b)), where the signal to noise ratio was calculated as the ratio between the value of the measurement to the value of the control (no LcA). As shown in figure 5C, the S/N ratio increases with the increase in LcA concentration.
The limit of detection (LOD) represents a measured concentration that generates a signal three times the standard deviation above background, which is 0.5 nM (25 ng/ml) for both the LOC and plate format. This LOD is similar to our previous results using a plate assay42 and is comparable to the measured level of LcA using peptide immobilized on beads and cleaved by the toxin, which releases fluorescent fragments into solution in a microfluidic system.44 The volume used for the assay is 10 μl and the level of detection is less than the level of detection of the mouse assay (0.03 ng/ml). However, the detection level is below the adult human lethal oral dose of 70 μg of toxin.39–41
The main advantages of the LOC is the simplification of the assay performance, ability to perform the assay in the field (e.g. no need for a microscope incubators etc) and better protection and isolation of the user from the toxin. Beyond the application described here, the ability to perform complex diagnostics assays without a laboratory is important for other medical applications ranging from microbial detection to cancer diagnostics. Such Point of Care diagnostic tools have the potential to enhance the quality of health care delivery for underserved populations.
4. Conclusion
To measure in vitro BoNTs activity, a microfluidic assay format combined with a LED-CCD sensor was created. The system enables detection of concentrations as low as 0.5 nM of LcA in a FRET cleavage assay. The device operated with a syringe enables analysis of eight samples simultaneously in two hours with minimal sample handling or manipulation. Black PMMA, which was used for fabrication minimizes scattered light and optical cross talk between channels. The issue of diffusion between channels was resolved by simple geometry. The main advantage of the lamination fabrication method described in detail here is speed of design and fabrication. It provides a rapid method for prototyping of LOC where the total time to produce successive design iterations is about several hours (depending on the complexity of the design). In contrast, PDMS technology requires masks, lithography, and molding which slow prototype development in comparison. When combined with our CCD based portable detector the system enables quick BoNTs detection without a laboratory and can be used for other Point of Care diagnostic applications and to enhance the quality of health care delivery for underserved populations.
References
- 1.Yager P, Edwards T, Fu E, Helton K, Nelson K, Tam MR, Weigl BH. Nature. 2006;442:412–418. doi: 10.1038/nature05064. [DOI] [PubMed] [Google Scholar]
- 2.Cai S, Singh BR, Sharma S. Crit Rev Microbiol. 2007;33:109–125. doi: 10.1080/10408410701364562. [DOI] [PubMed] [Google Scholar]
- 3.CDC. Botulism in the United States 1899–1996: Handbook for Epidemiologists, Clinicians, and Laboratory Workers. Centers for Disease Control and Prevention; Atlanta, Ga: 1998. [Google Scholar]
- 4.Nowakowski A, Wang C, Powers DB, Amersdorfer P, Smith TJ, Montgomery VA, Sheridan R, Blake R, Smith LA, Marks JD. Proc Natl Acad Sci U S A. 2002;99:11346–11350. doi: 10.1073/pnas.172229899. [DOI] [PMC free article] [PubMed] [Google Scholar]
- 5.Keller JE. Neuroscience. 2006 [Google Scholar]
- 6.Schantz EJ, Johnson EA. Lancet. 1990;335:421. doi: 10.1016/0140-6736(90)90263-5. [DOI] [PubMed] [Google Scholar]
- 7.Schantz EJ, Johnson EA. Microbiol Rev. 1992;56:80–99. doi: 10.1128/mr.56.1.80-99.1992. [DOI] [PMC free article] [PubMed] [Google Scholar]
- 8.Peruski AH, Johnson LH, Peruski LF., Jr J Immunol Methods. 2002;263:35–41. doi: 10.1016/s0022-1759(02)00030-3. [DOI] [PubMed] [Google Scholar]
- 9.Sharma SK, Ferreira JL, Eblen BS, Whiting RC. Appl Environ Microbiol. 2006;72:1231–1238. doi: 10.1128/AEM.72.2.1231-1238.2006. [DOI] [PMC free article] [PubMed] [Google Scholar]
- 10.Keller JE, Nowakowski JL, Filbert MG, Adler M. J Appl Toxicol. 1999;19(Suppl 1):S13–17. doi: 10.1002/(sici)1099-1263(199912)19:1+<s13::aid-jat607>3.0.co;2-3. [DOI] [PubMed] [Google Scholar]
- 11.Han SM, Cho JH, Cho IH, Paek EH, Oh HB, Kim BS, Ryu C, Lee K, Kim YK, Paek SH. Anal Chim Acta. 2007;587:1–8. doi: 10.1016/j.aca.2007.01.028. [DOI] [PubMed] [Google Scholar]
- 12.Guglielmo-Viret V, Attree O, Blanco-Gros V, Thullier P. J Immunol Methods. 2005;301:164–172. doi: 10.1016/j.jim.2005.04.003. [DOI] [PubMed] [Google Scholar]
- 13.Ferreira JL, Eliasberg SJ, Edmonds P, Harrison MA. J Food Prot. 2004;67:203–206. doi: 10.4315/0362-028x-67.1.203. [DOI] [PubMed] [Google Scholar]
- 14.Gessler F, Pagel-Wieder S, Avondet MA, Bohnel H. Diagn Microbiol Infect Dis. 2007;57:243–249. doi: 10.1016/j.diagmicrobio.2006.07.017. [DOI] [PubMed] [Google Scholar]
- 15.Sharma SK, Eblen BS, Bull RL, Burr DH, Whiting RC. Appl Environ Microbiol. 2005;71:3935–3941. doi: 10.1128/AEM.71.7.3935-3941.2005. [DOI] [PMC free article] [PubMed] [Google Scholar]
- 16.Gessler F, Hampe K, Schmidt M, Bohnel H. Diagnostic Microbiology and Infectious Disease. 2006;56:225–232. doi: 10.1016/j.diagmicrobio.2006.04.014. [DOI] [PubMed] [Google Scholar]
- 17.Rivera VR, Gamez FJ, Keener WK, White JA, Poli MA. Anal Biochem. 2006;353:248–256. doi: 10.1016/j.ab.2006.02.030. [DOI] [PubMed] [Google Scholar]
- 18.Gessler F, Hampe K, Bohnel H. Appl Environ Microbiol. 2005;71:7897–7903. doi: 10.1128/AEM.71.12.7897-7903.2005. [DOI] [PMC free article] [PubMed] [Google Scholar]
- 19.Attree O, Guglielmo-Viret V, Gros V, Thullier P. J Immunol Methods. 2007;325:78–87. doi: 10.1016/j.jim.2007.06.003. [DOI] [PubMed] [Google Scholar]
- 20.Golden J, Shriver-Lake L, Sapsford K, Ligler F. Methods. 2005;37:65–72. doi: 10.1016/j.ymeth.2005.05.010. [DOI] [PubMed] [Google Scholar]
- 21.Ligler FS, Sapsford KE, Golden JP, Shriver-Lake LC, Taitt CR, Dyer MA, Barone S, Myatt CJ. Anal Sci. 2007;23:5–10. doi: 10.2116/analsci.23.5. [DOI] [PubMed] [Google Scholar]
- 22.Ligler FS, Taitt CR, Shriver-Lake LC, Sapsford KE, Shubin Y, Golden JP. Anal Bioanal Chem. 2003;377:469–477. doi: 10.1007/s00216-003-1992-0. [DOI] [PubMed] [Google Scholar]
- 23.Shone CC, Quinn CP, Wait R, Hallis B, Fooks SG, Hambleton P. Eur J Biochem. 1993;217:965–971. doi: 10.1111/j.1432-1033.1993.tb18327.x. [DOI] [PubMed] [Google Scholar]
- 24.Schiavo G, Benfenati F, Poulain B, Rossetto O, Polverino de Laureto P, DasGupta BR, Montecucco C. Nature. 1992;359:832–835. doi: 10.1038/359832a0. [DOI] [PubMed] [Google Scholar]
- 25.Schiavo G, Poulain B, Rossetto O, Benfenati F, Tauc L, Montecucco C. Embo J. 1992;11:3577–3583. doi: 10.1002/j.1460-2075.1992.tb05441.x. [DOI] [PMC free article] [PubMed] [Google Scholar]
- 26.Sudhof TC, De Camilli P, Niemann H, Jahn R. Cell. 1993;75:1–4. [PubMed] [Google Scholar]
- 27.Blasi J, Chapman ER, Link E, Binz T, Yamasaki S, De Camilli P, Sudhof TC, Niemann H, Jahn R. Nature. 1993;365:160–163. doi: 10.1038/365160a0. [DOI] [PubMed] [Google Scholar]
- 28.Schiavo G, Rossetto O, Catsicas S, Polverino de Laureto P, DasGupta BR, Benfenati F, Montecucco C. J Biol Chem. 1993;268:23784–23787. [PubMed] [Google Scholar]
- 29.Trimble WS. J Physiol. 1993;87:107–115. doi: 10.1016/0928-4257(93)90004-d. [DOI] [PubMed] [Google Scholar]
- 30.Dong M, Tepp WH, Johnson EA, Chapman ER. Proc Natl Acad Sci U S A. 2004;101:14701–14706. doi: 10.1073/pnas.0404107101. [DOI] [PMC free article] [PubMed] [Google Scholar]
- 31.Gaunt PS, Kalb SR, Barr JR. J Vet Diagn Invest. 2007;19:349–354. doi: 10.1177/104063870701900402. [DOI] [PubMed] [Google Scholar]
- 32.Kalb SR, Moura H, Boyer AE, McWilliams LG, Pirkle JL, Barr JR. Anal Biochem. 2006;351:84–92. doi: 10.1016/j.ab.2006.01.027. [DOI] [PubMed] [Google Scholar]
- 33.Barr JR, Moura H, Boyer AE, Woolfitt AR, Kalb SR, Pavlopoulos A, McWilliams LG, Schmidt JG, Martinez RA, Ashley DL. Emerg Infect Dis. 2005;11:1578–1583. doi: 10.3201/eid1110.041279. [DOI] [PMC free article] [PubMed] [Google Scholar]
- 34.Parpura V, Chapman ER. Croat Med J. 2005;46:491–497. [PubMed] [Google Scholar]
- 35.Liu W, Montana V, Chapman ER, Mohideen U, Parpura V. Proc Natl Acad Sci U S A. 2003;100:13621–13625. doi: 10.1073/pnas.2233819100. [DOI] [PMC free article] [PubMed] [Google Scholar]
- 36.Boldt GE, Kennedy JP, Hixon MS, McAllister LA, Barbieri JT, Tzipori S, Janda KD. J Comb Chem. 2006;8:513–521. doi: 10.1021/cc060010h. [DOI] [PMC free article] [PubMed] [Google Scholar]
- 37.Perpetuo EA, Juliano L, Juliano MA, Fratelli F, Prado SM, Pimenta DC, Lebrun I. Protein Pept Lett. 2008;15:1100–1106. doi: 10.2174/092986608786071166. [DOI] [PubMed] [Google Scholar]
- 38.Hines HB, Kim AD, Stafford RG, Badie SS, Brueggeman EE, Newman DJ, Schmidt JJ. Appl Environ Microbiol. 2008;74:653–659. doi: 10.1128/AEM.01690-07. [DOI] [PMC free article] [PubMed] [Google Scholar]
- 39.Sapsford KE, Sun S, Francis J, Sharma S, Kostov Y, Rasooly A. Biosens Bioelectron. 2008;24:618–625. doi: 10.1016/j.bios.2008.06.018. [DOI] [PMC free article] [PubMed] [Google Scholar]
- 40.Rasooly R, Stanker LH, Carter JM, Do PM, Cheng LW, He X, Brandon DL. Int J Food Microbiol. 2008;126:135–139. doi: 10.1016/j.ijfoodmicro.2008.05.012. [DOI] [PubMed] [Google Scholar]
- 41.Rasooly R, Do PM. Appl Environ Microbiol. 2008;74:4309–4313. doi: 10.1128/AEM.00617-08. [DOI] [PMC free article] [PubMed] [Google Scholar]
- 42.Sapsford KE, Sun S, Francis J, Sharma S, Kostov Y, Rasooly A. Biosens Bioelectron. 2008 doi: 10.1016/j.bios.2008.06.018. [DOI] [PMC free article] [PubMed] [Google Scholar]
- 43.Sapsford KE, Francis J, Sun S, Kostov Y, Rasooly A. Anal Bioanal Chem. 2009 doi: 10.1007/s00216-009-2730-z. [DOI] [PubMed] [Google Scholar]
- 44.Frisk ML, Berthier E, Tepp WH, Johnson EA, Beebe DJ. Lab Chip. 2008;8:1793–1800. doi: 10.1039/b811075a. [DOI] [PubMed] [Google Scholar]
- 45.Mangru S, Bentz BL, Davis TJ, Desai N, Stabile PJ, Schmidt JJ, Millard CB, Bavari S, Kodukula K. J Biomol Screening. 2005;10:788–794. doi: 10.1177/1087057105278927. [DOI] [PubMed] [Google Scholar]
- 46.Irawan R, Tjin SC, Yager P, Zhang D. Biomed Microdevices. 2005;7:205–211. doi: 10.1007/s10544-005-3027-4. [DOI] [PubMed] [Google Scholar]
- 47.Schilling EA, Kamholz AE, Yager P. Anal Chem. 2002;74:1798–1804. doi: 10.1021/ac015640e. [DOI] [PubMed] [Google Scholar]
- 48.Munson MS, Hasenbank MS, Fu E, Yager P. Lab Chip. 2004;4:438–445. doi: 10.1039/b407765b. [DOI] [PubMed] [Google Scholar]
- 49.Rossier JS, Schwarz A, Reymond F, Ferrigno R, Bianchi F, Girault HH. Electrophoresis. 1999;20:727–731. doi: 10.1002/(SICI)1522-2683(19990101)20:4/5<727::AID-ELPS727>3.0.CO;2-A. [DOI] [PubMed] [Google Scholar]
- 50.Rossier J, Reymond F, Michel PE. Electrophoresis. 2002;23:858–867. doi: 10.1002/1522-2683(200203)23:6<858::AID-ELPS858>3.0.CO;2-3. [DOI] [PubMed] [Google Scholar]
- 51.Nagrath S, Sequist LV, Maheswaran S, Bell DW, Irimia D, Ulkus L, Smith MR, Kwak EL, Digumarthy S, Muzikansky A, Ryan P, Balis UJ, Tompkins RG, Haber DA, Toner M. Nature. 2007;450:1235–1239. doi: 10.1038/nature06385. [DOI] [PMC free article] [PubMed] [Google Scholar]
- 52.Mohamed H, Murray M, Turner JN, Caggana M. J Chromatogr A. 2009 doi: 10.1016/j.chroma.2009.05.036. [DOI] [PubMed] [Google Scholar]
- 53.Tan SJ, Yobas L, Lee GY, Ong CN, Lim CT. Biomed Microdevices. 2009;11:883–892. doi: 10.1007/s10544-009-9305-9. [DOI] [PubMed] [Google Scholar]
- 54.Hawkins KR, Yager P. Lab Chip. 2003;3:248–252. doi: 10.1039/b307772c. [DOI] [PubMed] [Google Scholar]