Abstract
The chloroplastic NAD kinase (NADK2) is reported to stimulate carbon and nitrogen assimilation in Arabidopsis (Arabidopsis thaliana), which is vulnerable to high light. Since rice (Oryza sativa) is a monocotyledonous plant that can adapt to high light, we studied the effects of NADK2 expression in rice by developing transgenic rice plants that constitutively expressed the Arabidopsis chloroplastic NADK gene (NK2 lines). NK2 lines showed enhanced activity of NADK and accumulation of the NADP(H) pool, while intermediates of NAD derivatives were unchanged. Comprehensive analysis of the primary metabolites in leaves using capillary electrophoresis mass spectrometry revealed elevated levels of amino acids and several sugar phosphates including ribose-1,5-bisphosphate, but no significant change in the levels of the other metabolites. Studies of chlorophyll fluorescence and gas change analyses demonstrated greater electron transport and CO2 assimilation rates in NK2 lines, compared to those in the control. Analysis of oxidative stress response indicated enhanced tolerance to oxidative stress in these transformants. The results suggest that NADP content plays a critical role in determining the photosynthetic electron transport rate in rice and that its enhancement leads to stimulation of photosynthesis metabolism and tolerance of oxidative damages.
NADP is a ubiquitous coenzyme, required in various metabolic processes, since these metabolites carry electrons through the reversible conversion between oxidized (NAD+, NADP+) and reduced (NADH, NADPH) forms in all organisms. NAD is highly oxidized and is involved primarily in intracellular catabolic reactions, whereas NADP is predominantly found in its reduced form and participates in anabolic reactions and defense against oxidative stress (Ziegler, 2000; Noctor et al., 2006; Pollak et al., 2007a). Since NAD(H) and NADP(H) play a variety of distinct physiological roles, the regulation of the NAD(H)/NADP(H) balance is essential for cell survival (Kawai and Murata, 2008; Hashida et al., 2009).
One of the key enzymes that regulates NAD(H)/NADP(H) balance is NAD kinase (NADK; EC 2.7.1.23), which catalyzes NAD phosphorylation in the presence of ATP. The genes encoding NADK were cloned recently from all organisms investigated to date, except for Chlamydia trachomatis (Kawai and Murata, 2008). Only a single gene encoding NADK has been found in some bacteria and mammals (Kawai and Murata, 2008). In contrast, NADK activity was detected in not only the cytosol but also organelles in yeast and plant (Jarrett et al., 1982; Simon et al., 1982; Dieter and Marme, 1984; Iwahashi and Nakamura, 1989; Iwahashi et al., 1989), and three genes including cytosol-type and organelle-type NADK have been cloned in yeast (Kawai et al., 2001; Outten and Culotta, 2003) and plants (Turner et al., 2004, 2005).
In Arabidopsis (Arabidopsis thaliana), one of the NADK isoforms is localized in the chloroplast (NADK2; Chai et al., 2005), the others are localized in the cytosol (NADK1 and NADK3; Chai et al., 2006). Analysis of Arabidopsis mutants revealed low chlorophyll (chl) content, low photosynthetic activity, growth inhibition, and hypersensitivity to environmental stresses in the nadk2 knockout mutant (Chai et al., 2005; Takahashi et al., 2006), whereas the nadk1 knockout mutant and the nadk3 knockout mutant did not show a significant phenotype, except for sensitivity to oxidative stress (Berrin et al., 2005; Chai et al., 2006). Moreover, the major part of NADP(H) biosynthesis in photosynthetic organ appears to be attributable to NADK2, because NADK and NADP(H) were strictly decreased in leaves of the nadk2 knockout mutant (Chai et al., 2005; Takahashi et al., 2006). In the plant cell, NADP is mainly located in the chloroplast (Heber and Santarius, 1965; Wigge et al., 1993), where NADP+ functions as the final electron acceptor of the photosynthetic electron transport. The reducing energy obtained is not only supplied for Calvin cycle, nitrogen assimilation, lipid and chl metabolism, but also play a crucial role in maintaining redox homeostasis through the regulation of producing and consuming reactive oxygen species (ROS) in the plant cell (Noctor, 2006; Noctor et al., 2006). Accordingly, these evidences indicate that chloroplastic NADK2 plays a central role in plant metabolism and stress tolerance through homeostasis of ROS as regulator of NADP/NAD balance.
Since the alteration of NAD/NADP balance affects metabolism and ROS homeostasis, manipulation of NADK can be an attractive target for the engineering of plant metabolism. It was reported that overexpression of NADK causes perturbation of NADP(H) pool and has positive effects on stress tolerance or growth in various living things. In Asperadium nidulans, overexpression of NADH kinase improves the growth efficiency of the cell (Panagiotou et al., 2009). Overexpression of NADK in human HEK293 cells causes 4-to 5-fold increase of NADPH concentration and provides moderate protection against oxidative stress (Pollak et al., 2007b). Recently, we evaluated effects of the enhanced NADP(H) content in Arabidopsis by generating NADK2-overexpressing plants (Takahashi et al., 2009). Our results indicated that enhanced NADP(H) production by NADK2 overexpression promoted nitrogen assimilation and resulted in accumulation of metabolites associated with the Calvin cycle, accompanied by increased activity of Rubisco. Together, these studies demonstrated the potential use of NADK as candidate gene in promoting primary metabolism and/or stress tolerance in transgenic plants.
Rice (Oryza sativa) is not only the primary crop for more than half of the world's population, but also a model monocot system. Rice can adapt to more strong light intensity than Arabidopsis, because rice is a sun plant, whereas Arabidopsis is a shade plant. Therefore, it is possible that effects of an increased NADP(H) content could be more significant in rice plant than in Arabidopsis, due to a higher ability to manage reductive energy involved in NADP as an electron carrier. In this article, we describe the generation and characterization of transgenic rice plants expressing an Arabidopsis chloroplastic NADK (AtNADK2), under the control of the maize (Zea mays) ubiquitin promoter. We named the rice plant as NK2. We found that pleiotropic effects on primary metabolism in NK2 rice were similar to the result obtained in NADK2-overexpressing Arabidopsis plants. However, stimulation of carbon fixation and nitrogen assimilation were observed in NK2 rice, accompanying with significant increases in electron transport and CO2 assimilation rates, unlike results of the previous study of Arabidopsis. Interestingly, the NK2 lines also showed enhanced tolerance to oxidative stress.
RESULTS
Generation of Transgenic Rice Plants Overexpressing AtNADK2
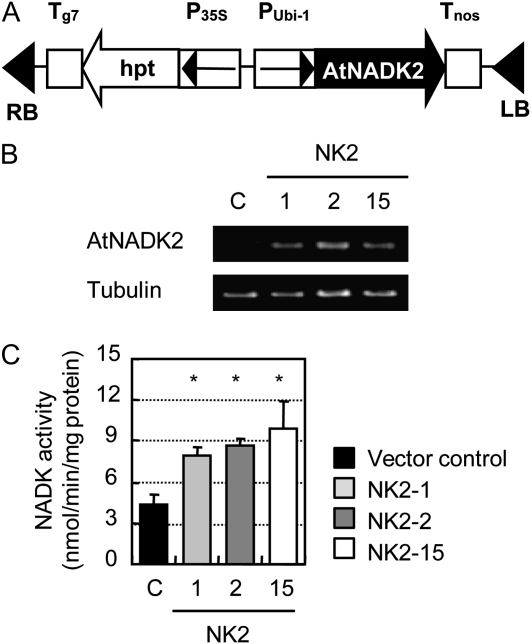
The gene encoding a chloroplastic NADK from Arabidopsis (AtNADK2) was cloned in the sense orientation into the binary vector pRiceFOX-GateA between the maize ubiquitin promoter and the nos terminator (Fig. 1A). Rice (cv Nipponbare) calli were transformed with this construct using Agrobacterium tumefaciens transformation (Toki et al., 2006). A total of 25 independent transgenic plants were regenerated in medium containing hygromycin for transgene expression screening by PCR analysis. Following the initial screening, three NK2 lines (NK2-1, NK2-2, and NK2-15) expressing the AtNADK2 gene were subjected to another hygromycin selection to obtain nonsegregating T3 transgenic lines. The homozygous T3 plants showed clear expression of the AtNADK2 gene (Fig. 1B), which caused an increase in total NADK activity (Fig. 1C).
Figure 1.
Overexpression of Arabidopsis NADK2 in transgenic rice plants. A, Construction of the chimeric gene used for generation of Arabidopsis NADK2-overexpressing transgenic plants. The coding sequence of Arabidopsis NADK gene (AtNADK2) was cloned between the maize ubiquitin promoter and nos terminator. B, RT-PCR analysis of the AtNADK2 transgene expression. Total RNA was prepared from the vector control (C) or the NK2 lines. PCR primers specific to the NADK2 transgene or β-tubulin were used. C, Total NADK activity in leaf samples from three NK2 rice lines and vector control. Samples were taken from 1-month-old plants. Data are mean ± sem of measurements of five individual plants per line. *P < 0.05, compared with the vector control (by Student's t test).
Elevated Levels of NADP(H) in NK2 Transgenic Lines
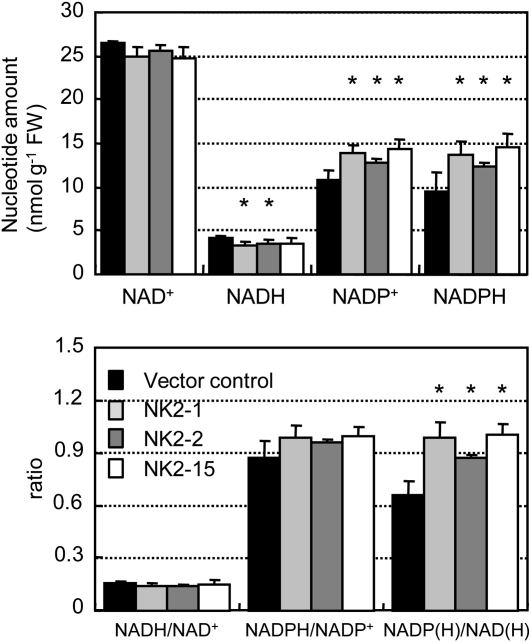
To evaluate the influence of the transgene on NADP(H) biosynthesis, pyridine nucleotides and their intermediates were determined in mature 1-month-old leaves from the vector control and NK2 line. In NK2 lines, the levels of NADP+ and NADPH, the products of the reaction catalyzed by NADK2, were elevated, whereas the levels of NAD+, NADH, and NaAD were slightly reduced (Fig. 2A; Table I). The NADPH/NADP+ and NADH/NAD+ ratios were similar in the control and NK2 lines (Fig. 2B). On the other hand, the NADP(H)/NAD(H) ratio in NK2 lines was about 1.4-fold higher than in vector control, although the total pyridine nucleotide pools was similar (Fig. 2, A and B). These results indicate that the total of NADP(P) increased at expense of the total NAD(H) in NK2 transgenic lines. In contrast, there were no significant changes in the contents of other intermediates in the NAD(P) biosynthetic pathway, suggesting that overexpression of NADK2 had a limited effect on NADP metabolism (Table I).
Figure 2.
Pyridine nucleotide contents and ratio in transgenic rice plants. Values are mean ± sem of measurements of four plants per line. *P < 0.05, compared with the vector control. FW, Fresh weight.
Table I. Intermediates in NADP biosynthesis pathway in NK2 transformants and vector control plants.
All metabolite analyses were performed from the same tissue samples. Values are the mean ± sem of measurements from four plants per line. *P < 0.05, compared with vector control (VC; by Student's t test). NaMN, Nicotinic acid mononucleotide; NaAD, nicotinic acid adenine dinucleotide.
| Content of Intermediates | Genotype |
|||
| VC | NK2-1 | NK2-2 | NK2-15 | |
| nmol/g fresh wt | ||||
| Quinolic acid | 7.01 ± 1.62 | 6.90 ± 1.12 | 7.11 ± 1.03 | 8.85 ± 1.28 |
| Nicotinate | 8.09 ± 1.76 | 9.04 ± 1.84 | 7.28 ± 1.14 | 8.03 ± 1.14 |
| Nicotinamide | 1.02 ± 0.47 | 1.11 ± 0.15 | 1.08 ± 0.14 | 1.16 ± 0.33 |
| NaMN | 0.31 ± 0.13 | 0.37 ± 0.09 | 0.21 ± 0.05 | 0.33 ± 0.07 |
| NaAD | 1.62 ± 0.27 | 1.05 ± 0.11* | 1.01 ± 0.04* | 0.87 ± 0.16* |
NK2 Lines Display Differential Effects on Metabolic Intermediates
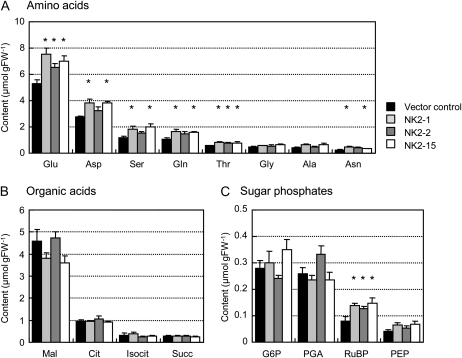
NADP affects virtually every metabolic pathway in the cell as a cofactor (Hunt et al., 2004; Noctor et al., 2006; Takahashi et al., 2009). To investigate whether the enlarged NADP(H) pool in NK2 lines affected the levels of metabolites, we performed comparative analysis of the steady-state levels of metabolites in the major primary pathways of photosynthetic metabolism using the well-expanded 1-month-old leaves from the vector control and NK2 lines. The capillary electrophoresis-mass spectrometry (CE-MS) method was employed to analyze 43 metabolites including amino acids, organic acids, and phosphorylated intermediates of rice leaves (Fig. 3; Supplemental Table S1). The amounts of amino acids, such as Glu, Asp, Ser, Gln, Thr, and Asn, were observed to be larger in NK2 lines than the vector control (Fig. 3). On the other hand, the content of organic acids and sugar phosphates in NK2 lines were only marginally different from values obtained with the control.
Figure 3.
Summary of metabolite contents of leaves of transgenic rice plants. Quantitative comparison of amino acids (A), organic acids (B), and sugar phosphates (C). Values are the mean ± sem of measurements of four plants per line. *P < 0.05, compared with the vector control (by Student's t test). FW, Fresh weight; Mal, malate; Cit, citrate; Isocit, isocitrate; Succ, succinate; G6P, Glc-6-P; PGA, 3-phosphoglyceric acid; PEP, phosphoenolpyruvate.
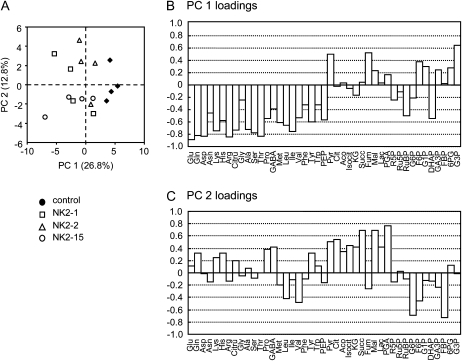
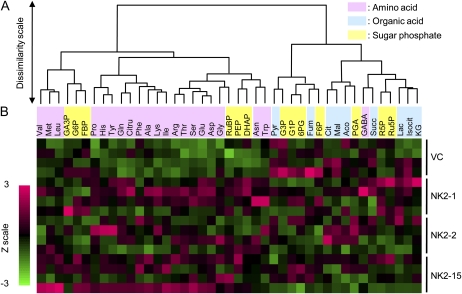
The data were analyzed using principal component analysis (PCA) on all 43 metabolites to compare the metabolic composition of the vector control and transgenic lines. The PCA scores revealed that the metabolic composition at steady state of the NK2 lines is different from that of the vector control (Fig. 4A). Indeed, the first principal component (PC1), explaining 26.7% of the total variability, clearly separated the vector control on the positive side from the NK2 lines on the negative side. In contrast, the three NK2 lines could not be separated by the PCA (Fig. 4A). Examination of PC1 loadings (Fig. 4B) suggested that the major differences between vector control and NK2 lines involved pyruvate, succinate, and glycerol-3-phosphate on the positive side, and amino acids, phosphoenolpyruvate, dihydroxyacetone phosphate (DHAP), and ribulose-1,5-bisP (RuBP) on the negative side. Hierarchical cluster analysis (HCA) of metabolite profiles exhibited two major clusters (Fig. 5). One group consisted mainly of amino acids, and six sugar phosphates (Glc-6-P, Fru-bisP, RuBP, glyceraldehyde-3-phosphate, DHAP, and phosphoenolpyruvate), whereas another group was organic acids and the rest was sugar phosphate. The heatmap indicated increases in metabolites of the left cluster in NK2 lines, whereas those metabolites of the right were similar in the two groups. In agreement with the PCA and HCA results, major differences in amino acid and sugar phosphate composition were observed between the vector control and NK lines. Indeed, Glu (NK2-1, NK2-2, and NK2-15), Gln (NK2-1 and NK2-15), Asp (NK2-1 and NK2-15), Asn (NK2-1 and NK2-15), Arg (NK2-1 and NK2-15), Ser (NK2-1 and NK2-15), Thr (NK2-1, NK2-2, and NK2-15), Tyr (NK2-1 and NK2-15), Ile (NK2-15), RuBP (NK2-1, NK2-2, and NK2-15), DHAP (NK2-1), and Rib-5-P (NK2-1) were significantly more abundant in NK2 lines than vector control, whereas Glc-3-P (NK2-1, NK2-2, and NK2-15) and Fru-bisP (NK2-2) were more abundant in the vector control than NK2 lines. This gave rise to about 20% to 40% increase in total free amino acids in leaves of NK2 lines. The accumulation of free amino acids caused by NADK2 overexpression in this study is in agreement with the results obtained in transgenic Arabidopsis plants (Takahashi et al., 2009). On the other hand, RuBP, a key metabolite in Calvin cycle, was increased in all NK2 lines, suggesting that elevated NADPH may stimulate the rate of regeneration of RuBP in chloroplasts.
Figure 4.
PCA of metabolites. A, Scores of PCA are presented based on a combination of two components (PC1 and PC2) and variances (26.8% for PC1 and 12.8% for PC2) of each component in the sample set. B and C, Loadings of metabolites with PC1 (B) and PC2 (C) components. The vertical axis represents the PC loading value.
Figure 5.
Metabolite profiling in transgenic rice plants. A, Hierarchical classification of metabolites. B, Heatmap corresponding to metabolites in relation to transgenic rice plants.
Increased Photosynthetic Capacity in NK2 Transgenic Plants
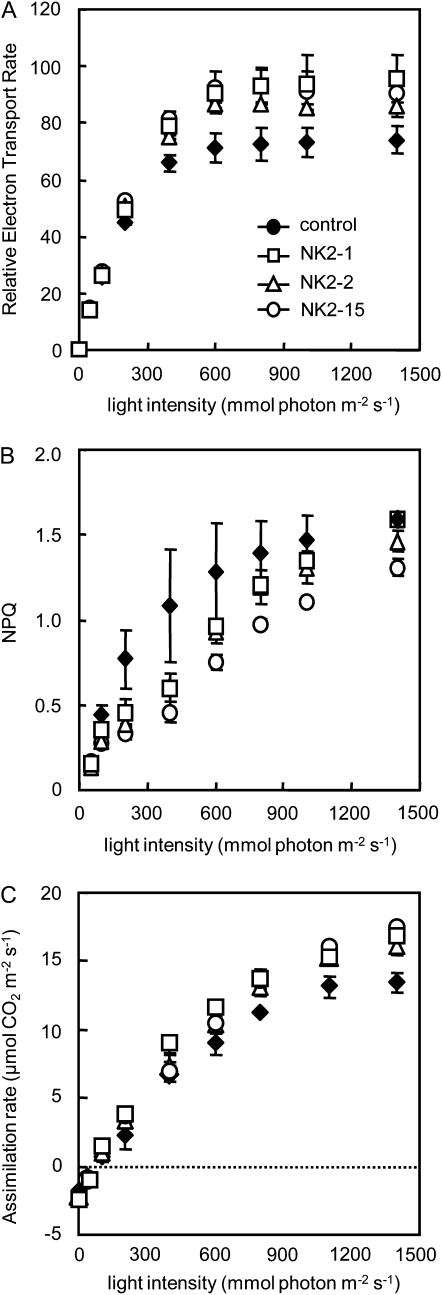
NADP in the chloroplast functions as a terminal acceptor of photosynthetic electron transport and NADPH formed is required to drive the Calvin cycle. The increases in NADP(H) and RuBP contents prompted us to evaluate the effects of NADK2 expression on photosynthesis. First, we characterized the photochemical parameter in mature leaves of 1-month-old plants. The maximum photochemical yield of PSII (Fv/Fm), the chl a/b ratio, and chl content were not affected (Table II). However, a difference was found in the light intensity dependency of the electron transport rate (ETR), which represents the rate of photosynthetic electron transport through PSII, of the NK2 lines, and vector control plant. Although the differences in ETR are small when light intensity was low, the ETR was evidently higher in the NK2 lines than the control when the light intensity was higher than that of growth condition (400 μmol photons m−2 s−1; Fig. 6A). At light intensities above 200 μmol photons m−2 s−1, nonphotochemical quenching (NPQ) was lower in NK2 lines than the control (Fig. 6B). These results indicate that the NK2 lines tended to manage more electrons thorough the photosynthetic apparatus at light saturation. Next, we characterized the irradiance dependency of the net CO2 assimilation. The respiration rate of NK2 lines that was measured in dark conditions was not different from that of the vector control. Under low irradiance (400 μmol photons m−2 s−1), the net CO2 assimilation was similar in NK lines and the vector control, whereas at higher irradiance, the former exhibited higher assimilation rates than that of the latter (Fig. 6C).
Table II. Chl (chl a + b) contents, chl a/b ratio, and Fv/Fm.
Data are mean ± sd (n = 5). Plants were grown at 300 μmol photons m−2 s−1 in a photoperiod (14 h of light, 10 h of dark) for 3 weeks.
| Plant | Chl a + b | Chl a/b | Fv/Fm |
| mg/g fresh wt | |||
| Control | 4.16 ± 0.78 | 3.03 ± 0.13 | 0.816 ± 0.005 |
| NK2-1 | 3.74 ± 0.39 | 3.04 ± 0.27 | 0.811 ± 0.005 |
| NK2-2 | 4.81 ± 0.47 | 3.03 ± 0.04 | 0.808 ± 0.007 |
| NK2-15 | 3.98 ± 0.36 | 2.76 ± 0.24 | 0.810 ± 0.024 |
Figure 6.
Irradiance dependency of net CO2 assimilation and chl fluorescence parameters in leaves of the vector control and NK2 lines. A, Light intensity dependence of ETR. B, Light intensity dependence of NPQ of chl fluorescence. C, Net CO2 assimilation. Values are mean ± sd of determinations on five individual plants per line. The plants were kept in dark for 30 min before analysis.
Carbon fixation in the Calvin cycle requires two NADPH and three ATP to assimilate one molecule of CO2 into carbohydrate and to regenerate one RuBP. To examine the effect of NADK2 overexpression on the energy status, we determined the level of adenylates (Table III). Although there were no significant differences in ATP and ADP levels, with the exception of the ATP content in NK2-15, the ATP tended to be more abundant in NK2 line than the vector control. In contrast, the ATP/ADP ratio was approximately 1.6-fold higher in NK2 lines than in the vector control.
Table III. Adenylate levels in leaves of control and NK2 lines.
Values are the mean ± sem of measurements from four plants per line. *P < 0.05, **P < 0.01, compared with the vector control (by Student's t test).
| Adenylate | Control | NK2-1 | NK2-2 | NK2-15 |
| nmol/g fresh wt | ||||
| ATP | 35.0 ± 5.6 | 50.1 ± 6.3 | 43.7 ± 7.9 | 52.5 ± 5.8* |
| ADP | 33.4 ± 5.7 | 30.8 ± 1.3 | 28.0 ± 4.9 | 31.2 ± 2.4 |
| ATP/ADP | 1.1 ± 0.2 | 1.6 ± 0.2* | 1.6 ± 0.1** | 1.7 ± 0.2** |
Increased Tolerance to Oxidative Stress in NK2 Transgenic Plants
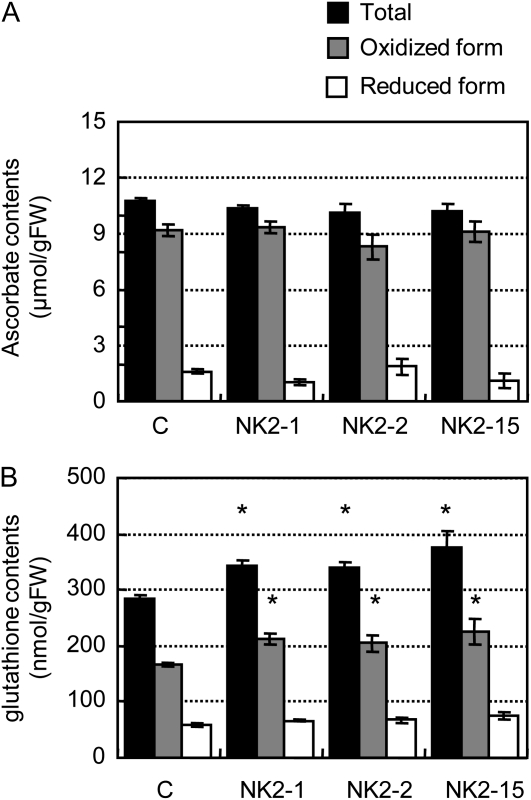
Since NADP(H) is known to regulate the sizes and redox states of glutathione (GSH) and ascorbate pools, the metabolite concentrations and redox states of GSH and ascorbate pools were determined. The ascorbate content of leaves was not different between the vector control and NK2 lines (Fig. 7A). In contrast, the latter lines exhibited a small but significant increase in the total GSH content relative to the control (Fig. 7B). The increase in the total GSH was primarily attributable to increases in the reduced forms of GSHs. Thus, the ratio of GSH to oxidized GSH was significantly elevated in NK2 lines.
Figure 7.
Ascorbate and GSH contents in rice plants. Values are mean ± sem of measurements of five plants per line. *P < 0.05, compared with the vector control (by Student's t test). C, Vector control; FW, fresh weight.
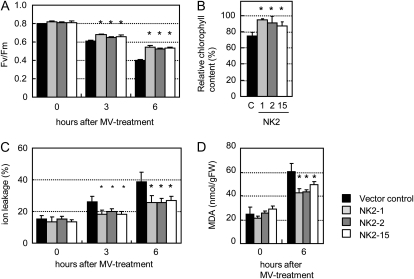
NADK2-deficient Arabidopsis plants are highly sensitive to environmental stresses that provoke oxidative stress, such as UVB, drought, heat shock, and salinity (Chai et al., 2005). We therefore analyzed the leaf discs of plants overexpressing NADK2 to methyl viologen (MV; an herbicide leading to production of ROS in chloroplasts). Two parameters related to chloroplast function, the photochemical efficiency of PSII (Fig. 8A) and total chl (Fig. 8B), showed a slower decrease in the NK2 lines after MV treatment of leaf discs of 4-month-old plants. Moreover, ion leakage caused by MV-induced membrane damage (Fig. 8C) and contents of malondialdehyde (MDA) as marker of lipid peroxidation (Fig. 8D), were significantly reduced in the NK2 lines. Thus, overexpression of AtNADK2 in rice confers enhanced tolerance to MV-generated ROS.
Figure 8.
Effects of MV on rice plants. Leaf discs of 10 mm diameter were floated on 10 μm MV and illuminated at 100 μmol photon m−2 s−1 for 3 and 6 h. A, Fv/Fm. B, MV-induced pigment degradation. C, MV-induced membrane damage. Ion leakage was estimated by measuring the increase in conductivity of the medium after MV treatment of leaf discs. D, Lipid peroxidation expressed as the MDA content in the vector control and NK2 lines. FW, Fresh weight. Values are the mean ± sem of measurements of five plants per line. *P < 0.05, compared with the vector control (by Student's t test).
DISCUSSION
NADK2 catalyzes a key step in the regulation of NAD/NADP ratio, producing NADP from NAD and ATP (Kawai and Murata, 2008; Hashida et al., 2009). In particular, chloroplastic NADP functions as the final acceptor of photosynthetic electron transport, which provides electrons in various metabolic processes and redox homeostasis (Noctor, 2006; Pollak et al., 2007a). This study showed that heterologous expression of AtNADK2 in rice plants had pleiotropic effects on primary metabolism consistent with our previous study on Arabidopsis (Takahashi et al., 2009). However, these lines exhibited the increased photosynthetic ETR and assimilation rates different from the lack of change in photosynthetic ETR in Arabidopsis overexpressing AtNADK2 (Fig. 6). Moreover, the NK2 lines displayed enhanced tolerance to oxidative stress damage by redox-cycling herbicides that propagate ROS (Fig. 8). Since Arabidopsis is a shade plant and rice is a sun plant, the introduction of AtNADK2 might have induced different effects on the photosynthetic transport rate at high light intensity and oxidative stress response, most probably due to differences in the ability to adapt to high light condition.
Consistent with the level of AtNADK2 transcript and NADK activity, NADP(H) contents of transformants were significantly increased, whereas the amounts of NAD(H), a substrate of NADP biosynthesis, decreased by about 10% (Fig. 1; Table I). Despite these changes in each pyridine nucleotide pool, both the NAD+/NADH ratio and the NADP+/NADPH ratio in NK2 lines were similar to those in the vector control (Table I). These disturbances of the pyridine nucleotide pool were in agreement with the results of previous Arabidopsis study (Takahashi et al., 2009). In contrast to the results in chloroplastic NADK-overexpressing plants, overexpression of cytoplasmic NADK decreased the NADP+/NADPH ratio (human, Pollak et al., 2007b; Escherichia coli, Li et al., 2009). These results suggest that the cellular distribution of NADP synthesized by NADK affects the redox regulation.
Since the photosynthetic electron transport chain provides energy and reducing equivalents for the reduction of fixed CO2 to carbohydrates in the Calvin cycle, some investigations have been carried out to improve photosynthetic electron transport. However, increases in protein levels of photosynthetic electron transport chain components, except for overexpression of cytochrome c6 (Cyt c6) from the red alga Porphyra yezoensis, did not result in increase in ΦPSII and plant growth [ferredoxin NADP(H) oxidoreductase, Rodriguez et al., 2007; ferredoxin, Yamamoto et al., 2006]. Overexpression of Porphyra Cyt c6 in Arabidopsis resulted in enhanced ETR through PSII and plant growth and an increase in NADPH and ATP (Chida et al., 2007). In this study, rice plants overexpressing AtNADK2 showed a phenotype similar to that of Porphyra Cyt c6-overexpressing Arabidopsis, with respect to higher photosynthetic ETR and increased NADPH and ATP (Figs. 2 and 6; Table III), indicating that regulation of the pool size of NADP(H) could be a rate-limiting step for photosynthetic electron transport.
The rates of photosynthesis electron transport and carbon assimilation in the NK2 lines at light saturation are approximately 20% higher than in the vector control, although differences in photosynthesis are small at limiting light intensities. At light saturation, the photosynthetic rate is limited by the capacity of the dark reactions, in particular the Calvin cycle and triose-P utilization in the cytoplasm (Long and Bernacchi, 2003). It has been reported that overexpression of Arabidopsis sedheptulose-1,7-bisphosphatase or Chlamydomonas sedheptulose-1,7-bisphosphatase in tobacco (Nicotiana tabacum) results in enhanced ΦPSII, probably due to enhanced RuBP regeneration (Lefebvre et al., 2005; Tamoi et al., 2006), which supports the importance of RuBP regeneration on the photosynthesis rate. Moreover, it has been assumed that RuBP regeneration at light saturation is controlled by the potential whole-chain ETR, rather than by the enzymes of the Calvin cycle downstream of Rubisco (Farquhar et al., 1980; von Caemmerer, 2000). Together with the observed high levels of the RuBP content (Fig. 4), RuBP regeneration stimulated by ATP, NADP+, and/or NADPH would be responsible for the elevated levels of light-saturated photosynthesis in the NK2 rice plants.
The comprehensive metabolic analysis by CE-MS revealed increased contents of nitrogen-rich amino acids, such as Gln, Asn, and Arg and content of RuBP, a substrate of carbon assimilation reaction in these NK2 lines (Fig. 3). Such metabolic changes observed in NK2 lines closely resemble those of NADK2-overexpressing Arabidopsis (Takahashi et al., 2009), suggesting that the positive effect of the introduction of NADK2 on carbon and nitrogen assimilation would be conserved among plant species. However, unlike the transgenic Arabidopsis, the NK2 rice plants displayed significant increases in photosynthesis ETR and carbon assimilation rates (Fig. 6). The increasing rate of photosynthesis in NK2 lines could lead to an increase in the ATP content, which is a product of photophosphorylation. In fact, the ATP/ADP ratio in NK2 lines was higher, and the ATP content in NK2 lines tended to be larger than the control (Table III). Therefore, the increase in supply of reducing energy and universal energy currency would be attributable partly to metabolic changes in NK2 lines.
The increase in RuBP in the transformants indicated a change of flow in the Calvin cycle. Two possibilities could explain the accumulation of RuBP. One is that a decrease in the initial Rubisco activity leads to the accumulation of RuBP (Eckardt et al., 1997; Law and Crafts-Brandner, 1999). The other is that an increase in the RuBP regeneration rate induces enhanced content of RuBP (Miyagawa et al., 2001; Tamoi et al., 2006). Since it is thought that initial Rubisco activity in NK2 lines is not smaller than that in the control due to an increase in the carbon assimilation rate in NK2 line (Fig. 6), one can rule out the first possibility. Accordingly, it is likely that the RuBP regeneration rate in NK2 lines would be enhanced through regulation of Calvin cycle enzyme by NADP(H) as an effecter (Trost et al., 2006; Takahashi et al., 2009) and/or through increase in supply of NADPH and ATP by elevated photosynthetic ETR. On the other hand, free amino acids increased in NK2 lines, Gln, Asn, and Arg are known to function as nitrogen storage compounds that include more than two nitrogen atoms in a molecule (Sieciechowicz et al., 1988; Slocum, 2005). Since Gln synthase, which plays pivotal roles in the biosynthesis of amino acids, catalyzes the ATP-dependent amination of Glu to Gln in plants (Temple et al., 1998), the increases in ATP levels in the NK2 lines may contribute to enhancement of the biosynthesis of amino acids and proteins.
It is not clear why overexpression of NADK2 should give rise to increased tolerance to oxidative stress. Interestingly, it has been reported that the activity of NADK increases under oxidative stress condition in bacteria (Grose et al., 2006; Singh et al., 2007), yeast (Strand et al., 2003), and plant (Berrin et al., 2005; Chai et al., 2006). Furthermore, overexpression of NADK in human has been to shown to be tolerant to oxidative stress (Pollak et al., 2007b). These results suggest that the pool size of NADP(H) might play a general role in protection against oxidants. In plants, MV catalyzes the transfer of electrons from PSI of chloroplast membrane to molecular oxygen, producing ROS. Since NADP+ also accepts electrons from PSI through ferredoxin to form NADPH, the production of ROS competes with the production of NADPH. Accordingly, the enhanced NADP(H) pool could suppress the propagation of ROS. Moreover, the synthesized NADPH serves as an electron donor for the scavenging of ROS. Taken together, we propose that the elevated NADP content is responsible for the enhanced tolerance of NK2 rice plants.
Although carbon and nitrogen metabolism were stimulated in the NADK2-overexpressing Arabidopsis plant (Takahashi et al., 2009), no changes were noted in the photosynthetic ETR and there are no reports on the enhanced tolerance of oxidative stress. Our study demonstrated that the importance of transformation of the NADK2 gene in rice plants in enhancing the ETR was accompanied by enhanced carbon assimilation rate and enhanced tolerance to oxidative stress. We consider that the discrepancy between phenotype of NADK2-overexpressing Arabidopsis and that of rice-overexpressing NADK2 may be attributable to the ability to manage reductive energy involved in NADP as an electron carrier because rice is a sun plant, whereas Arabidopsis is a shade plant. Therefore, our results are potentially important for improving crop yields, since most crops belong to sun plants.
MATERIALS AND METHODS
Production of Rice Transformants with an Arabidopsis Gene of NADK2
The full-length cDNA of AtNADK2 was cloned (Takahashi et al., 2009) and introduced into the binary vector pRiceFOX-GateA under the control of the maize (Zea mays) ubiquitin promoter (ubi-1; Toki et al., 1992). The construct was used to transform Agrobacterium tumefaciens strain EHA105. Transformation of rice (Oryza sativa ‘Nipponbare’) calli was carried out as reported previously (Toki et al., 2006). The hygromycin-resistant rice plants were subsequently acclimated in the Murashige and Skoog medium without hormones for 4 weeks and transplanted to soil. Plants were grown in a greenhouse. T3 generations (homozygous lines) were used for the all experiments in this study. As a control, Nipponbare plants possessing only hygromycin-resistant gene were used. Rice plants were grown on artificial soil, Bonsol (Sumitomo Chemical), in cylindrical pots in growth chamber at 28°C (day) and 24°C (night) under long-day (14 h light and 10 h dark) condition.
Reverse Transcription-PCR Analyses
Total RNA from rice was extracted using the RNeasy mini prep kit (Qiagen), and then first-strand cDNA was synthesized with total RNA and used for PCR. Transcripts from AtNADK2 were detected by reverse transcription (RT)-PCR with specific primers for AtNADK2 (5′-GATGATGCAATTTCCC-3′ and 5′-CATATTAAATTCTGATGC-3′). A set of primers, 5′-TCAGATGCCCAGTGACAGGA-3′ and 5′-TTGGTGATCTCGGCAACAGA-3′, was used for RT-PCR of tubulin mRNA. The reaction conditions for PCR included a denaturation step of 94°C for 2 min, followed by 25 cycles of 10 s at 98°C, 30 s at 60°C, and 1 min at 72°C, and ending with elongation step of 4 min at 72°C.
Enzyme Assays
NADK activity was measured by quantifying the production of NADP+ from NAD+ using the cycling assay as described previously (Turner et al., 2004). The NADK assay mixture (100 μL) contained 50 mm HEPES/KOH buffer (pH 8.0), 5 mm NAD+, 5 mm ATP, 10 mm MgCl2, 1 mm CaCl2, and the enzyme solution. The reaction was started by adding NAD+ and stopped by incubating in boiling water for 2 min. After centrifugation at 15,000g for 4 min at 4°C, 20 μL of the supernatant was added to the cycling assay (200 μL) containing 50 mm HEPES/KOH (pH 8.0), 0.5 mm Glc-6-P, 1 mm EDTA, 0.12 mm 2,6-dichlorophenolindophenol, 1 mm phenazine methosulfate, and 2 units of Glc-6-P dehydrogenase. The reaction was started by adding Glc-6-P dehydrogenase. Reduction of 2,6-dichlorophenolindophenol was monitored by a change in A600 and the amount of NADP quantified by comparison to a standard curve produced using analytical-grade NADP+.
Measurement of Metabolites
Chl was extracted with N,N-dimethylformamide from rice leaves. The extracts were spectrophotometrically measured at wavelengths of 646.8 and 663.8 nm (Porra et al., 1989). The concentrations of GSH and oxidized GSH in leaves were determined by the spectrometric GSH reductase-5,5′-dithio-bis-2-nitrobenzoic acid recycling assay (Noctor and Foyer, 1998). The contents of ascorbate and dehydroxylascorbate were determined as described by Foyer et al. (1983).
For measurements using the CE-MS, metabolites were extracted using methanol:MiliQ water (1:1) described by Sato et al. (2004). Leaf samples were obtained, immediately frozen in liquid nitrogen, and stored at −80°C until further analysis. The metabolites were extracted by rapid grinding of tissues in liquid nitrogen followed by immediate addition of 10 volume of ice-cooled methanol (10 μL mg−1 fresh weight) including 50 μm internal standards, Met sulfone and PIPES for cations and anions, respectively. The sample solution was mixed by a voltex mixer for 1 min at 4°C and equal volume of Milli-Q water was added to the sample mixture. After centrifugation for 5 min at 15,000g, the supernatant was ultrafilterated through a 5 kD cutoff filter (Amicon). The filtrate was analyzed using the CE-MS methods.
Separation and determination of metabolites were performed using the CE/MS system (Agilent Technologies). For the determination of anionic compounds, separations were carried out using fused-silica capillary (50 μm i.d. × 80 cm total length) filled with 50 mm ammonium acetate (pH 9.0) as the electrolyte according to the pressure-assisted CE-MS method (Harada et al., 2006). Cationic compounds were separated in an uncoated fused-silica capillary (50 μm i.d. × 100 cm total length) using 1 m formic acid (pH 1.9) as the electrolyte (Soga and Heiger, 2000; Miyagi et al., 2010). Nucleotides were separated in a fused-silica capillary (50 μm i.d. × 100 cm total length) precoated with phosphate according to the method described by Soga et al. (2007). All CE-MS data were processed using the R program with XCMS package (Smith et al., 2006). Quantification was performed using known concentrations of selected compounds.
Statistical Analysis
PCA and HCA were performed using the algorithms embedded in the R software package. The creation of heatmap and Student's t test were performed using Microsoft Excel.
Chl Fluorescence Measurements and CO2 Assimilation
Chl florescence was measured with Closed FluorCam (Photon Systems Instruments) according to the method of Kasajima et al. (2009). Minimum fluorescence (Fo) was recorded after dark adaptation for 10 min. The maximum fluorescence (Fm) was monitored by application of a 0.8-s saturating light pulse (6,000 μmol photons m−2 s−1) from white LED light. The steady-state fluorescence yield (Fs) was obtained during exposure of a leaf to actinic light 50 μmol photons m−2 s−1 to 1,500 μmol photons m−2 s−1 with the same light source. The maximal quantum yield of PSII was calculated as Fv/Fm = (Fm − Fo)/Fm. The quantum yield of PSII at the steady state was calculated as (Fm′ − Fs)/Fm′. NPQ was defined as Fm/Fm′ − 1.
CO2 assimilation was measured by using a LI6400 (LI-COR) in attached leaves. CO2 gas exchange was performed at 25°C, 60% relative humidity, a photosynthetic photon flux density of 0 to 1,400 μmol photon m−2 s−1, and a leaf-to-air vapor pressure difference of 1.0 to 1.2 kPa.
Ion Leakage Measurement
Leaf segments (approximately 1 cm in size) from 2-month-old rice plants were floated on 1 mL of 10 μm MV and vacuum infiltrated for 5 min under dark condition. After incubation under continuous light of 100 μmol photosynthetic photon flux density m−2 s−1 at 26°C for 1, 3, and 6 h, electroconductivity of the water was measured with an electrical conductivity meter (B-173; Horiba). To determine the total ion leakage, the leaf segments were autoclaved with the remaining water. The percentage of ion leakage was determined by dividing the conductivity of the preautoclaved solution by that of the autoclaved solution.
Measurement of Lipid Hydroperoxide Content
Lipid peroxidation was determined as the amount of MDA by thiobarbituric acid test (Heath and Packer, 1968). The amount of thiobarbituric acid reactive substance was estimated by measuring absorbance from A532 to A600 using a molar absorption coefficient of 1.56 × 10⁵ (Gueta-Dahan et al., 1997). All measurements were repeated three times for extracts from each leaf segment.
Sequence data from this article can be found in the GenBank/EMBL data libraries under accession numbers At1g21640 (NADK2).
Supplemental Data
The following materials are available in the online version of this article.
Supplemental Table S1. Metabolite levels in illuminated leaves from 3-week-old rice plants expressing AtNADK2.
Supplementary Material
Acknowledgments
We thank Dr. H. Nakamura and Dr. H. Ichikawa (National Institute of Agrobiological Sciences) for providing pRiceFOX-GateA. We thank Ms. E. Hagiuda and Ms. J. Hayakawa (University of Tokyo) for technical assistance.
References
- Berrin JG, Pierrugues O, Brutesco C, Alonso B, Montillet JL, Roby D, Kazmaier M. (2005) Stress induces the expression of AtNADK-1, a gene encoding a NAD(H) kinase in Arabidopsis thaliana. Mol Genet Genomics 273: 10–19 [DOI] [PubMed] [Google Scholar]
- Chai MF, Chen QJ, An R, Chen YM, Chen J, Wang XC. (2005) NADK2, an Arabidopsis chloroplastic NAD kinase, plays a vital role in both chlorophyll synthesis and chloroplast protection. Plant Mol Biol 59: 553–564 [DOI] [PubMed] [Google Scholar]
- Chai MF, Wei PC, Chen QJ, An R, Chen J, Yang S, Wang XC. (2006) NADK3, a novel cytoplasmic source of NADPH, is required under conditions of oxidative stress and modulates abscisic acid responses in Arabidopsis. Plant J 47: 665–674 [DOI] [PubMed] [Google Scholar]
- Chida H, Nakazawa A, Akazaki H, Hirano T, Suruga K, Ogawa M, Satoh T, Kadokura K, Yamada S, Hakamata W, et al. (2007) Expression of the algal cytochrome c6 gene in Arabidopsis enhances photosynthesis and growth. Plant Cell Physiol 48: 948–957 [DOI] [PubMed] [Google Scholar]
- Dieter P, Marme D. (1984) A Ca2+, calmoduline-dependent NAD kinase from corn is located in the outer mitochondrial membrane. J Biol Chem 259: 184–189 [PubMed] [Google Scholar]
- Eckardt NA, Snyder GW, Portis AR, Ogren WL. (1997) Growth and photosynthesis under high and low irradiance of Arabidopsis thaliana antisense mutants with reduced ribulose-1,5-bisphosphate carboxylase/oxygenase activase content. Plant Physiol 113: 575–586 [DOI] [PMC free article] [PubMed] [Google Scholar]
- Farquhar GD, von Caemmerer S, Berry JA. (1980) A biochemical model of photosynthetic CO2 assimilation in leaves of C3 species. Planta 149: 78–90 [DOI] [PubMed] [Google Scholar]
- Foyer C, Rowell D, Walker D. (1983) Measurement of the ascorbate content of spinach leaf protoplasts and chloroplasts during illumination. Planta 157: 239–244 [DOI] [PubMed] [Google Scholar]
- Grose JH, Joss L, Velick SF, Roth JR. (2006) Evidence that feedback inhibition of NAD kinase controls responses to oxidative stress. Proc Natl Acad Sci USA 103: 7601–7606 [DOI] [PMC free article] [PubMed] [Google Scholar]
- Gueta-Dahan Y, Yaniz Z, Zilinskas BA, Ben-Hayyim G. (1997) Salt and oxidative stress: similar and specific response and their relation to salt tolerance in sitrus. Planta 203: 460–469 [DOI] [PubMed] [Google Scholar]
- Harada K, Fkusaki E, Kobayashi A. (2006) Pressure-assisted capillary electrophoresis mass spectrometry using combination of polarity reversion and electroosmotic flow for metabolomics anion analysis. J Biosci Bioeng 101: 402–409 [DOI] [PubMed] [Google Scholar]
- Hashida SN, Takahashi H, Uchimiya H. (2009) The role of NAD biosynthesis in plant development and stress responses. Ann Bot (Lond) 103: 819–824 [DOI] [PMC free article] [PubMed] [Google Scholar]
- Heath RL, Packer L. (1968) Photo peroxidation in isolated chloroplasts. I. Kinetics and stoichiometry of fatty acid peroxidation. Arch Biochem Biophys 125: 189–198 [DOI] [PubMed] [Google Scholar]
- Heber UW, Santarius KA. (1965) Compartmentation and reduction of pyridine nucleotides in relation to photosynthesis. Biochim Biophys Acta 109: 390–408 [DOI] [PubMed] [Google Scholar]
- Hunt L, Lerner F, Ziegler M. (2004) NAD—new roles in signaling and gene regulation in plant. New Phytol 163: 31–44 [DOI] [PubMed] [Google Scholar]
- Iwahashi Y, Hitoshio A, Tajima N, Nakamura T. (1989) Characterization of NADH kinase from Saccharomyces cerevisiae. J Biochem 105: 588–593 [DOI] [PubMed] [Google Scholar]
- Iwahashi Y, Nakamura T. (1989) Localization of the NADH kinase in the inner membrane of yeast mitochondria. J Biochem 105: 916–921 [DOI] [PubMed] [Google Scholar]
- Jarrett HW, Brown CJ, Black CC, Cormier MJ. (1982) Evidence that calmodulin is in the chloroplast of peas and serves a regulatory role in photosynthesis. J Biol Chem 257: 13795–13804 [PubMed] [Google Scholar]
- Kasajima I, Takahara K, Kawai-Yamada M, Uchimiya H. (2009) Estimation of the relative sizes of rate constants for chlorophyll de-excitation processes through comparison of inverse fluorescence intensities. Plant Cell Physiol 50: 1600–1616 [DOI] [PubMed] [Google Scholar]
- Kawai S, Mori S, Suzuki S, Murata K. (2001) Molecular cloning and identification of UTR1 of a yeast Saccaromyces cerevisiae as a gene encoding an NAD kinase. FEMS Microbiol Lett 200: 181–184 [DOI] [PubMed] [Google Scholar]
- Kawai S, Murata K. (2008) Structure and function of NAD kinase and NADP phosphatase: key enzymes that regulate the intracellular balance of NAD(H) and NADP(H). Biosci Biotechnol Biochem 72: 919–930 [DOI] [PubMed] [Google Scholar]
- Law RD, Crafts-Brandner SJ. (1999) Inhibition and acclimation of photosynthesis to heat stress is closely correlated with activation of ribulose-1,5-bisphoshate carboxylase/oxygenase. Plant Physiol 120: 173–182 [DOI] [PMC free article] [PubMed] [Google Scholar]
- Lefebvre S, Lawson T, Zakhleniuk OV, Lloyd JC, Raines CA. (2005) Increased sedoheptulose-1,7-bisphosphate activity in transgenic tobacco plants stimulates photosynthesis and growth from an early stage in development. Plant Physiol 138: 451–460 [DOI] [PMC free article] [PubMed] [Google Scholar]
- Li ZJ, Cai LL, Wu Q, Chen GQ. (2009) Overexpression of NAD kinase in recombinant Escherichia coli harboring the phbCAB operon improves poly(3-hydroxybutyrate) production. Appl Microbiol Biotechnol 82: 703–712 [DOI] [PubMed] [Google Scholar]
- Long SP, Bernacchi CJ. (2003) Gas exchange measurements, what can they tell us about the underlying limitations to photosynthesis? Procedures and sources of error. J Exp Bot 54: 2393–2401 [DOI] [PubMed] [Google Scholar]
- Miyagawa Y, Tamoi M, Shigeoka S. (2001) Overexpression of a cyanobacterial fructose-1,6-/sedheptulose-1,7-bisphosphatase in tobacco enhances photosynthesis and growth. Nat Biotechnol 19: 965–969 [DOI] [PubMed] [Google Scholar]
- Miyagi A, Takahashi H, Takahara K, Hirabayashi T, Nishimura Y, Tezuka T, Kawai-Yamada M. (2010) Principal component and hierarchical clustering analysis of metabolites in destructive weeds; polygonaceous plants. Metabolomics 6: 146–155 [Google Scholar]
- Noctor G. (2006) Metabolic signaling in defence and stress: the central roles of soluble redox couples. Plant Cell Environ 29: 409–425 [DOI] [PubMed] [Google Scholar]
- Noctor G, Foyer CH. (1998) Simultaneous measurement of foliar glutathione, γ-glutamylcysteine, and amino acids by high-performance liquid chromatography: comparison with the two other assay methods for glutathione. Anal Biochem 264: 19–110 [DOI] [PubMed] [Google Scholar]
- Noctor G, Queval G, Gaklere B. (2006) NAD(P) synthesis and pyridine nucleotide cycling in plants and their potential importance in stress conditions. J Exp Bot 57: 1603–1620 [DOI] [PubMed] [Google Scholar]
- Outten CE, Culotta VC. (2003) A novel NADH kinase is the mitochondrial source of NADPH in Saccharomyces cerevisiae. EMBO J 22: 2015–2024 [DOI] [PMC free article] [PubMed] [Google Scholar]
- Panagiotou G, Grotkjar T, Hofmann G, Bapat PM, Olsson L. (2009) Overexpression of a novel endogenous NADH kinase in Aspergillus nidulans enhances growth. Metab Eng 11: 31–39 [DOI] [PubMed] [Google Scholar]
- Pollak N, Dolle C, Ziegler M. (2007a) The power to reduce: pyridine nucleotides—small molecules with a multitude of functions. Biochem J 402: 205–218 [DOI] [PMC free article] [PubMed] [Google Scholar]
- Pollak N, Niere M, Ziegler M. (2007b) NAD kinase levels control the NADPH concentration in human cells. J Biol Chem 282: 33562–33571 [DOI] [PubMed] [Google Scholar]
- Porra RJ, Thompson WA, Kriedemann PE. (1989) Determination of accurate extinction coefficients and simultaneous equations for assaying chlorophylls a and b extracted with four different solvents; verification of the concentration of chlorophyll standards by atomic absorption spectroscopy. Biochim Biophys Acta 975: 384–394 [Google Scholar]
- Rodriguez RE, Lodeyro A, Roli HO, Zurbriggen M, Peisker M, Palatnik JF, Tognetti VB, Tschiersch H, Hajirezaei MR, Valle EM, et al. (2007) Transgenic tobacco plants overexpressing chloroplastic ferredoxin-NADP(H) reductase display normal rates of photosynthesis and increased tolerance to oxidative stress. Plant Physiol 143: 639–649 [DOI] [PMC free article] [PubMed] [Google Scholar]
- Sato S, Soga T, Nishioka T, Tomita M. (2004) Simultaneous determination of the main metabolites in rice leaves using capillary electrophoresis mass spectrometry and capillary electrophoresis diode array detection. Plant J 40: 151–163 [DOI] [PubMed] [Google Scholar]
- Sieciechowicz KA, Joy KW, Ireland RJ. (1988) The metabolism of asparagines in plants. Phytochemistry 27: 663–671 [Google Scholar]
- Simon P, Dieter P, Bonzon M, Greppin H, Marme D. (1982) Calmodulin dependent and independent NAD kinase activities from cytoplasmic fractions of spinach (Spinacia oleracea L.). Plant Cell Rep 1: 119–122 [DOI] [PubMed] [Google Scholar]
- Singh R, Mailloux R, Puiseux-Dao S, Appanna VD. (2007) Oxidative stress evokes a metabolic adaptation that favors increased NADPH synthesis and decreased NADH production in Psudomonas fluorescens. J Bacteriol 189: 6665–6675 [DOI] [PMC free article] [PubMed] [Google Scholar]
- Slocum RD. (2005) Genes, enzymes and regulation of arginine biosynthesis in plants. Plant Physiol Biochem 43: 729–745 [DOI] [PubMed] [Google Scholar]
- Smith CA, Want EJ, O'Maille G, Abagyan R, Siuzdak G. (2006) XCMS: processing mass spectrometry data for metabolite profiling using nonlinear peak alignment, matching, and identification. Anal Chem 78: 779–787 [DOI] [PubMed] [Google Scholar]
- Soga T, Heiger DN. (2000) Amino acid analysis by capillary electrophoresis electrospray ionization mass spectrometry. Anal Chem 72: 1236–1241 [DOI] [PubMed] [Google Scholar]
- Soga T, Ishikawa T, Igarashi S, Sugawara K, Kakazu Y, Tomita M. (2007) Analysis of nucleotides by pressure-assisted capillary electrophoresis-mass spectrometry using silanol mask technique. J Chromatogr A 1159: 125–133 [DOI] [PubMed] [Google Scholar]
- Strand MK, Stuart GR, Longley MJ, Graziewicz MA, Dominick OC, Copeland WC. (2003) POS5 gene of Saccharomyces cerevisiae encodes a mitochondrial NADH kinase required for stability of mitochondrial DNA. Eukaryot Cell 2: 809–820 [DOI] [PMC free article] [PubMed] [Google Scholar]
- Takahashi H, Takahara K, Hashida SN, Hirabayashi T, Fujimori T, Kawai-Yamada M, Yamaya T, Yanagisawa S, Uchimiya H. (2009) Pleiotropic modulation of carbon and nitrogen metabolism in Arabidopsis plants overexpressing NAD kinase 2 gene. Plant Physiol 151: 100–113 [DOI] [PMC free article] [PubMed] [Google Scholar]
- Takahashi H, Watanabe A, Tanaka A, Hashida SN, Kawai-Yamada M, Sonoike K, Uchimiya H. (2006) Chloroplast NAD kinase is essential for energy transduction through the xanthophyll cycle in photosynthesis. Plant Cell Physiol 47: 1678–1682 [DOI] [PubMed] [Google Scholar]
- Tamoi M, Nagaoka Y, Miyagawa Y, Shigeoka S. (2006) Contribution of fructose-1,6-bisphosphatase and sedheptulose-1,7-bisphosphatase to the photosynthetic rate and carbon flow in the Calvin cycle in transgenic plants. Plant Cell Physiol 47: 380–390 [DOI] [PubMed] [Google Scholar]
- Temple SJ, Bagga S, Senqupta-Gopalan C. (1998) Down-regulation of specific members of the glutamine synthetase gene family in alfalfa by antisense RNA technology. Plant Mol Biol 37: 535–547 [DOI] [PubMed] [Google Scholar]
- Toki S, Hara N, Ono K, Onodera H, Tagiri A, Oka S, Tanaka H. (2006) Early infection of scutellum tissue with Agrobacterium allows high-speed transformation of rice. Plant J 47: 961–976 [DOI] [PubMed] [Google Scholar]
- Toki S, Takamatsu S, Nojiri C, Ooba S, Anzai H, Iwata M, Christensen AH, Quail PH, Uchimiya H. (1992) Expression of a maize ubiquitin gene promoter-bar chimeric gene in transgenic rice plants. Plant Physiol 100: 1503–1507 [DOI] [PMC free article] [PubMed] [Google Scholar]
- Trost P, Fermani S, Marri L, Zaffagnini M, Falini G, Scagliarini S, Pupillo P, Sparla F. (2006) Thioredoxin-dependent regulation of photosynthetic glyceraldehyde-3-phosphate dehydrogenase: autonomous vs. CP12-dependent mechanisms. Photosynth Res 89: 263–275 [DOI] [PubMed] [Google Scholar]
- Turner WL, Waller JC, Vanderbeld B, Snedden WA. (2004) Cloning and characterization of two NAD kinases from Arabidopsis: identification of a calmodulin binding isoform. Plant Physiol 135: 1243–1255 [DOI] [PMC free article] [PubMed] [Google Scholar]
- Turner WL, Waller JC, Snedden WA. (2005) Identification, molecular cloning and functional characterization of a novel NADK kinase from Arabidopsis thaliana (thale cress). Biochem J 385: 217–223 [DOI] [PMC free article] [PubMed] [Google Scholar]
- von Caemmerer S. (2000) Biochemical Models of Leaf Photosynthesis. CSIRO Publishing, Collingwood, Australia [Google Scholar]
- Wigge B, Krömer S, Gardeström P. (1993) The redox levels and subcellular distribution of pyridine nucleotides in illuminated barley leaf protoplasts studied by rapid fractionation. Physiol Plant 88: 10–18 [Google Scholar]
- Ziegler M. (2000) New functions of a long-known molecule: emerging roles of NAD in cellular signaling. Eur J Biochem 267: 1550–1564 [DOI] [PubMed] [Google Scholar]
Associated Data
This section collects any data citations, data availability statements, or supplementary materials included in this article.


