

Abstract
Previous systems analyses in plants have focused on a single developmental stage or time point, although it is often important to additionally consider time-index changes. During seed development a cascade of events occurs within a relatively brief time scale. We have collected protein and transcript expression data from five sequential stages of Arabidopsis (Arabidopsis thaliana) seed development encompassing the period of reserve polymer accumulation. Protein expression profiling employed two-dimensional gel electrophoresis coupled with tandem mass spectrometry, while transcript profiling used oligonucleotide microarrays. Analyses in biological triplicate yielded robust expression information for 523 proteins and 22,746 genes across the five developmental stages, and established 319 protein/transcript pairs for subsequent pattern analysis. General linear modeling was used to evaluate the protein/transcript expression patterns. Overall, application of this statistical assessment technique showed concurrence for a slight majority (56%) of expression pairs. Many specific examples of discordant protein/transcript expression patterns were detected, suggesting that this approach will be useful in revealing examples of posttranscriptional regulation.
One aim of systems biology is in developing an understanding of the complexity of living organisms by acquisition, integration, and interpretation of the information present in large omics datasets (Ilsley et al., 2009). In this regard, global methods for comparative transcript and protein profiling can be performed to discover posttranscriptionally regulated genes. One of the earliest global comparisons of transcript and protein abundance in eukaryotes revealed a weak statistical correlation (Gygi et al., 1999), suggesting that protein expression deviates from its cognate transcript more often than generally assumed. Subsequent studies have shown that the correlation between protein and transcript expression levels can vary between 20% and 70%, based upon the profiling approach used and the system being analyzed (Chen et al., 2002; Griffin et al., 2002; Ørntoft et al., 2002; Le Roch et al., 2004; Shankavaram et al., 2007; Jayapal et al., 2008; Pascal et al., 2008; Hornshøj et al., 2009). It has become increasingly clear that the various posttranscriptional mechanisms operating within a cell can substantially change, and thus regulate, steady-state protein levels. In some cases the regulation can result in patterns much different from those predicted from transcript profiling alone (Shang and Lehrman, 2004; Shendure, 2008; Hendrickson et al., 2009). Discordance between transcript and protein levels can make it difficult to answer important biological questions based upon measurement of transcript levels alone (Piques et al., 2009). Thus, an improved strategy for assessing correlation between transcript and protein levels should be broadly informative.
Nonparametric statistical tests have been previously used for pairwise comparisons of transcript/protein abundances. The Pearson product moment correlation (PPMC) was applied for analysis of yeast (Saccharomyces cerevisiae; Gygi et al., 1999) and prostate cells (Pascal et al., 2008), and the Spearman rank order correlation (SROC) has been applied to analysis of yeast (Griffin et al., 2002) and Plasmodium falciparum (Le Roch et al., 2004). There have, however, been fewer parallel time-index studies of any biological process or response that have included quantifying proteome and transcriptome coordination (Prioul et al., 2008; Tian et al., 2009). As a result the methods for statistical description of multidatapoint trends and the degree of agreement between such datasets have not been well explored. In order for profiling studies to address the kinetic aspects of biological responses, improved statistical applications will be necessary. Herein we present general linear modeling (GLM) as an approach useful for detecting concordance\discordance in the patterns of transcript and protein expression during Arabidopsis (Arabidopsis thaliana) seed development. A comparison of the results from application of GLM versus simple correlation coefficient analysis of the transcript and protein expression datasets reveals the latter to be inadequate for assessing complex biological trends.
Seeds undergo a rapid, lineal transformation from fertilized embryos to mature propagules. This developmental sequence can be separated into three distinct phases: embryogenesis, seed filling, and maturation (Goldberg et al., 1994). Seed filling is particularly interesting because it is the period of massive storage reserve (oil, protein, and starch) synthesis and deposition (Baud et al., 2009; Andriotis et al., 2010). It is well known that both protein (Hajduch et al., 2005, 2006; Agrawal et al., 2008) and transcript levels (Ruuska et al., 2002; Le et al., 2007) change dramatically during seed filling, although in no case has there been parallel comparative global profiling of both. While it is clearly important to perform parallel coincidental global profiling of transcript and protein expression, it is also important that data analysis incorporate a robust statistical approach capable of providing confidence assessments for the entire dataset. Ideally, the strategy for statistical analysis would simultaneously provide insight into the mechanisms of posttranscriptional regulation. The use of GLM in our analyses allows us to assign confidence values to our conclusions, and at the same time to identify outliers that might provide insight into the underlying mechanisms.
RESULTS
Using Fatty Acid Analysis as a Marker for the Stages of Seed Filling
Developing Arabidopsis seeds were harvested at 5, 7, 9, 11, or 13 d after flowering (DAF). Ten different fatty acids (FAs) were detectable by gas chromatography (GC), and their distribution during seed filling was quantified (Supplemental Table S1). Total FA levels increased linearly from 5 through 11 DAF, with a 2-fold increase between 11 and 13 DAF, at which point FAs comprised 20% of the seed dry mass (Fig. 1). Linoleic acid (18:2) levels steadily increased during seed development, and this was the most prominent FA at all developmental stages. Linolenic acid levels also increased steadily throughout seed filling showing a 3-fold increase between 11 and 13 DAF. Eicosanoic (20:0), 11-eicosenoic (20:1Δ11), 13-eicosenoic (20:1Δ13), and erucic (22:1Δ13) acid levels increased approximately 3.6-, 5.0-, 2.3-, and 4.9-fold between 11 and 13 DAF, suggesting that the activity of cytoplasmic fatty-acyl-CoA elongase might be temporally regulated. Total protein levels also increased steadily between 5 and 13 DAF (Fig. 1).
Figure 1.

Characterization of developing Arabidopsis seeds. A, Seeds staged at 5, 7, 9, 11, and 13 DAF. B, FA content of developing seeds as determined by GC-MS analysis of methyl ester-derivatized FAs using heptadecanoic acid as the internal standard. FAs are expressed on a seed fresh weight basis. C, Protein content of developing seed as quantified by the Coomassie dye binding assay. [See online article for color version of this figure.]
Global Proteomics and Transcriptomics Quantified 1,025 Two-Dimensional Gel Spots and 22,746 Probes, Respectively, during Seed Filling
To generate global protein expression data, proteins prelabeled with Cy5 were used in combination with high-resolution two-dimensional gel electrophoresis (2-DE; Supplemental Fig. S1). To eliminate dye-effect biases, all analytical 2-DE was carried out exclusively with Cy5 from the same production lot. Use of the single CyDye yielded 10- to 20-fold increase in sensitivity versus Sypro Ruby or Coomassie Brilliant Blue while avoiding the problems associated with differences in labeling efficiency, molar absorptivity, and lot-to-lot variations. For profiling experiments involving multiple time points we have found that the single dye and lot approach is superior to sample multiplexing.
Isolated proteins from whole seeds were separated using broad (pH 3–10) and medium (pH 4–7) range immobilized pH gradient (IPG) strips in biological triplicate (Supplemental Fig. S1). Since the majority of Arabidopsis seed proteins have acidic pI values, the pH 4 to 7 range was used in the principal analytical gel, while pH 3 to 10 gels were analyzed only within the 3 to 4 and 7 to 10 ranges. Gels were imaged using the ImageMaster Platinum software to create protein expression profiles. Only those spots detected in biological triplicate and at least two developmental stages were further analyzed. A total of 1,025 spot groups satisfied these two criteria (Supplemental Table S2).
Proteins labeled with a fluorescent dye such as Cy5 present challenges for gel excision and subsequent protein identification, so preparative colloidal Coomassie Brilliant Blue-stained gels were produced for protein identification. Due to the differences in protein detection methods, only 696 spots were unequivocally matched to the 1,025 spot groups from the Cy5-labeled analytical gels. All 696 protein spots excised from gels were subjected to trypsin digestion and tandem mass spectrometry (MS/MS) for protein identification. A total of 523 protein spots were confidently identified by assigning a minimum of two unique peptides. These spots correspond to 346 nonredundant proteins (Supplemental Table S3). In some instances proteins were present as multiple spots, presumably the products of multigene families or posttranslational modifications. Seed storage proteins had the highest frequency of multiple spots. Proteins involved in primary metabolism and energy production comprise the largest groups of developing seed proteins; approximately 21% and 18%, respectively, of the total nonredundant proteins.
Global transcript profiling was performed in biological triplicate for each developmental stage using the Affymetrix ATH1 Genome Array (Fig. 2), and analyzed using GeneSpring software (version 7.3). Supplemental Figure S2 summarizes the results of gene expression trends plotted as normalized intensities (on a log scale) and the distribution of probe intensities across all developmental stages and biological replicates. Using this approach, expression patterns for 22,746 genes were obtained for the five sequential stages of seed filling.
Figure 2.

Experimental design for large-scale comparison of transcript and protein expression during Arabidopsis seed filling. Seeds were harvested at 5, 7, 9, 11, or 13 DAF. Total protein fractions were isolated and labeled with NHS-Cy5, then resolved by high-resolution 2-DE (employing both wide and medium range pH gradients), and analyzed to acquire protein expression profiles. Analyses were conducted in biological triplicate. Protein spots for which expression profile data were acquired were excised from the gel, trypsin digested, and analyzed by LC-MS/MS for identification. A total of 523 nonredundant proteins were conclusively identified based upon the minimum criterion of two unique, nonoverlapping peptides. For transcriptome analyses, mRNA was isolated, labeled, and hybridized to the Affymetrix ATH1 Genome Array (22,746 genes) in biological triplicate. Microarray slides were scanned and computationally analyzed to acquire mRNA expression profiles. The profile trends for each protein/transcript pair were compared using both correlation coefficient analysis and GLM.
Use of the PPMC r or the Kendall Rank Order Correlation τ for Pairwise Analysis Indicates a Significant Increase in Protein/Transcript Correlation across Time
The results of pairwise protein/transcript correlations are summarized in Table I. In total, 319 pairs were established, and expression was compared in at least one developmental stage. However, the total number of protein/transcript pairs at each developmental stage differed depending upon expression: 280 pairs were correlated at 5 DAF, 299 at 7 DAF, 305 at 9 DAF, 301 at 11 DAF, and 247 at 13 DAF. Employing correlation coefficient statistics at individual stages of seed filling, 10% and 8.6% of protein/transcript pairs correlated based on Pearson's r and the Kendall rank order correlation (KROC) coefficient τ at 5 DAF, respectively. At 13 DAF, as much as 19% and 18% of the pairs were positively correlated (P < 0.05) based on Pearson's r and Kendall's τ, respectively. These time-index changes indicate a significant increase in correlation across the developmental sequence (Table I). Contrary to these low correlation coefficients, when the calculations were performed for all 319 pairs over all developmental stages, a 44% correlation was observed (Table I). This inconsistency points out the need for a more robust assessment of protein/transcript relationships for the time-index experiment.
Table I. Correlation analysis of transcript-protein pairs from developing Arabidopsis seeds.
A total of 319 protein/transcript pairs were correlated using Kendall's τ (K's T) and Pearson's correlation coefficients (P's) at least in one developmental stage. The table shows number of positively (Pos) and negatively (Neg) correlated pairs for all stages investigated (all days) and for each developmental stage individually. The table also shows percentage of significantly correlated (P < 0.05) pairs in relation to the total number of correlated pairs for each developmental stage.
| Sign | P Value | All Days |
5 DAF |
7 DAF |
9 DAF |
11 DAF |
13 DAF |
||||||
| K's T | P's | K's T | P's | K's T | P's | K's T | P's | K's T | P's | K's T | P's | ||
| Neg | <0.00016 | 32 | 27 | 24 | 24 | 24 | 24 | 25 | 25 | 26 | 26 | 49 | 49 |
| Neg | <0.05 | 60 | 61 | 24 | 29 | 24 | 28 | 25 | 33 | 26 | 36 | 49 | 54 |
| Neg | all | 111 | 121 | 131 | 132 | 150 | 161 | 150 | 158 | 172 | 167 | 118 | 120 |
| Pos | all | 208 | 198 | 149 | 148 | 149 | 138 | 155 | 147 | 129 | 134 | 129 | 127 |
| Pos | <0.05 | 135 | 139 | 24 | 29 | 13 | 15 | 22 | 34 | 17 | 26 | 45 | 47 |
| Pos | <0.00016 | 77 | 84 | 24 | 24 | 13 | 13 | 22 | 22 | 17 | 17 | 46 | 46 |
| Total correlated | 319 | 319 | 280 | 280 | 299 | 299 | 305 | 305 | 301 | 301 | 247 | 247 | |
| Significantly correlated % | 42 | 44 | 8.6 | 10 | 4.4 | 5.0 | 7.2 | 11 | 5.6 | 8.6 | 18 | 19 | |
Incorporation of Time as a Variable in the Regression Analysis Provides a More Robust Assessment of Protein/Transcript Correlations
Analysis of time-index data is difficult when only correlation coefficients are used, because this statistical approach evaluates the slope of the line and not the y-intercept or degree of line curvature. We therefore applied GLM to evaluate our datasets.
Overall, the concordance of expression profile regression parameters indicates that there is considerable similarity of response for protein/transcript pairs, and even with statistically small sample sizes some of the similarities are very strong (Table II). The distribution of concordance and discordance among the 319 protein/transcript pairs varied with the quadratic line properties including y-intercept, slope, and curvature (Fig. 3; Supplemental Table S4). Concordance with y-intercept, for example, indicates similar expression at the initial stage of seed filling, while discordance for slope or curvature suggests disparate time-index expression. The distribution of concordance for these three parameters does not appear random. Overall, 56% of the 319 protein/transcript pairs had concordant expression patterns.
Table II. Regression analysis of transcript-protein pairs from developing Arabidopsis seeds.
In total 319 transcript-protein pairs were subjected to regression analysis to evaluate their relationship during seed filling. The regression model has the following annotations: β0 is the intercept for the protein curve, β01 = β0 + β1 is the intercept for the microarray curve, β2 is the slope for the protein curve, β23 = β2 + β3 is the slope for the microarray curve, β4 is the quadratic term for the protein curve, and β45 = β4 + β5 is the quadratic term for the microarray curve.
| Regression | β0 and β01 | β2 and β23 | β4 and β45 |
| Strong concordance | 30 | 22 | 18 |
| Concordance | 164 | 169 | 160 |
| Discordance | 155 | 150 | 159 |
| Strong discordance | 47 | 5 | 3 |
Figure 3.

The GLM analysis of expression profiles for 319 transcript/protein pairs analyzed during seed filling in Arabidopsis. A, Three line parameters were evaluated by GLM including y-intercept, slope, and curvature to statistically compare transcript and protein expression. Temporal data for each transcript and protein pair were statistically evaluated for each of these parameters and determined to be either in concordance or discordance as denoted in the simplified graphical models. B, Distribution of concordant and discordant transcript/protein pairs based upon y-intercept parameter and distributed across protein functional classes. C, Functional distribution of concordant and discordant transcript/protein pairs based on slope parameter. D, Functional distribution of concordant and discordant transcript/protein pairs based on curvature parameter.
Mining the Concordance/Discordance Data
Recent progress has led to the development of efficient methods for database mining, ranging from methods of clustering, outlier analysis, frequent, sequential, and structured pattern analysis, and visualization of spatial and time-index datasets (Van den Bulcke et al., 2006; Antoine and Miernyk, 2007; Nicolas, 2009). The results from our GLM analysis of the concordance between protein and transcript expression profiles during Arabidopsis seed development suggest a similar utility (Fig. 3; Supplemental Table S4). Discordant protein/transcript pairs can be easily identified and targeted for further study, without any prior need to directly address the nature of this regulation.
DISCUSSION
An increasing body of literature addressing comparative analysis of global transcript and protein expression in eukaryotes has converged upon a general consensus that correlation between the two is poor (Gygi et al., 1999; Chen et al., 2002; Cox et al., 2007; Baerenfaller et al., 2008; Jayapal et al., 2008; Wu et al., 2008; Hornshøj et al., 2009; Tian et al., 2009). The underlying bases for the discordance in protein and mRNA abundance are manifold (Wu et al., 2008; Hendrickson et al., 2009; Piques et al., 2009), and difficulties in interpretation are exacerbated by the lack of adequate statistical tools to compensate for the inherent biases in data collection (Nie et al., 2007). The major aim of this study was to define the concordance of time-index patterns of protein/transcript expression during the early maturation stages of Arabidopsis seed development. We have employed GLM to evaluate the time variable so that it could be incorporated into the overall assessment of protein and transcript expression.
Selection of the appropriate statistical tools can have a crucial impact on data interpretation (Nie et al., 2007). In the case of comparative protein/transcript expression studies, the most commonly used nonparametric correlation analyses, the PPMC coefficient r (Rodgers and Nicewander, 1988), the SROC coefficient sr (Corder and Foreman, 2009), and the KROC coefficient τ (Degerman, 1982) yielded varying results. For instance, in yeast, the correlation analysis between protein and mRNA abundances gave an r value that is inadequate for prediction of protein expression levels from quantitative mRNA data (Gygi et al., 1999). The PPMC was also used in analysis of mRNA and protein levels in human prostate cells, with r values that varied from 0 to 0.63 (Pascal et al., 2008). In contrast to these two instances, expression of as many as 65% of the genes was judged to be significantly correlated with corresponding proteins in NCI-60 cancer cells using the PPMC (Shankavaram et al., 2007). Furthermore it was recently reported that calculation of the PPMC r indicated a positive correlation in a comparison of two porcine tissues analyzed using iTRAQ for protein and cDNA microarray/454-sequencing for transcript profiling (Hornshøj et al., 2009). Using the SROC, a significant number of genes with large discrepancies between protein and corresponding transcript abundances was determined in yeast (Griffin et al., 2002). The SROC has also been used to compare protein with corresponding transcript levels during the P. falciparum life cycle (Le Roch et al., 2004), but the calculated sr value supported concordance in only three out of seven instances. Our results suggest positive correlations of 42% and 44% through all stages of seed filling using the KROC and PPMC correlation analyses, respectively (Table I). However, dependence of pairwise correlation on the stage of seed development was also observed, ranging from 9% to 19% (Table I).
The use of GLM extends the multivariate regression model by allowing linear transformations of multiple dependent variables. This gives the GLM the important advantage that multivariate tests of significance can be employed when responses on multiple dependent variables are correlated (i.e. transcript, protein, developmental stage). This can also provide insight into which dimensions of the response variables are related to the predictor variables (Waldorp, 2009). A second advantage is the ability to analyze effects of repeated-measurement factors, which have traditionally been analyzed using ANOVA. Linear combinations of responses reflecting a repeated measure effect such as the difference of responses on a measure under differing conditions, such as time, can be constructed and tested for significance (Friston, 2008).
An important result to come from our GLM analyses addresses metabolic specialization. One aspect of Arabidopsis seed filling is the flow of carbon from Suc into FAs (Fig. 4; Hills, 2004; Baud et al., 2009; Andriotis et al., 2010). The protein/transcript pairs for pyrophosphate:Fru-6-P 1-phosphotransferase (At1g76550), cytosolic (At2g36460) and plastidial (At2g21330) Fru-bisP aldolase, cytosolic triose-P isomerase (At3g55440), cytosolic (At1g13440) and plastidial (At3g26650) glyceraldehyde-3-P dehydrogenase, plastidial phosphoglycerate kinase (At1g79550), cytosolic enolase (At2g36530), and plastidial pyruvate kinase (At5g52920) were all concordant during seed filling for at least two of three GLM parameters. At the same times, the majority of the 28 reactions of intermediary metabolism shown in Figure 4 were discordant. This reveals that there must be posttranscriptional regulation of core metabolism during seed development. A similar conclusion has been reached for bacteria and yeast (Griffin et al., 2002; Jayapal et al., 2008).
Figure 4.

Schematic view of carbohydrate metabolism during seed filling of Arabidopsis. Expression (heat) maps of individual protein (P) and transcript (T) expression based on proteomics and microarray experiments as relative value to 5 DAF are shown. Protein/transcript pairs are under one ATG number. Intermediates: UDP-G, UDP-Glc; G-1-P, Glc-1-P; G-6-P, Glc-6-P; F-6-P, Fru-6-P; 6PGLone, 6-phosphoglucono-d-lactone; 6PGLate, 6-phosphogluconate; Ru-5-P, ribulose-5-P; GAP, glyceraldehyde-3-P; F-1,6-bp, Fru-1,6-bisP; DHAP, dihydroxyacetone phosphate. Enzymes: 1, Suc synthase; 2, UDP-Glc pyrophosphorylase; 3, phosphoglucomutase; 4, Glc-6-P isomerase; 5, fructokinase; 6, phosphoglucomutase + Glc-6-P dehydrogenase + 6-phosphogluconate dehydrogenase + phosphoribulokinase; 7, phosphofructokinase; 8, Fru-1,6-bisP aldolase; 9, triose-P isomerase; 10, glyceraldehyde-3-P dehydrogenase; 11, phosphoglycerate kinase; 12, 2,3-bisphosphoglycerate-independent phosphoglycerate mutase; 13, enolase; 14, pyruvate kinase; 15, Glc-6-P isomerase + Glc-6-P dehydrogenase + 6-phosphogluconate dehydrogenase; 16, phosphoribulokinase; 17, Rubisco; 18, pyruvate dehydrogenase; 19, phosphoenolpyruvate carboxylase; 20, malate dehydrogenase.
A small majority (179 of the 319) of protein/transcript pairs were concordant (Table II; Supplemental Table S3), and are thus unlikely to be candidates for posttranscriptional regulation of expression. These results are based upon steady-state analysis and might not detect all types of posttranslational regulation. From our survey, this leaves 140 protein/transcript pairs with discordant expression patterns suggesting posttranscriptional regulation. Included among these are genes/proteins involved in cellular structure (actin 8, At1g49240), signaling (ADP-ribosylation factor ATARF1, At1g23490), and RNA metabolism (Gly-rich RNA-binding proteins, At4g39260, At2g21660, RNA-binding proteins, At4g17520, At5g47210). One example of how our experimental strategy can be used for identifying targets for additional research is the intriguing case of plastidial pyruvate kinase. The expression trend of the two plastidial pyruvate kinase proteins (At3g22960 and At5g52920) was very similar, while transcript levels were discordant (At3g22960) and concordant (At5g52920) with protein expression for all three quadratic-line variables (Supplemental Table S3). It was previously reported that these genes encode an α-subunit (At3g22960) and a β-subunit (At5g52920) that stoichiometrically assemble into a α4β4 heterooctomer (Andre et al., 2007). Apparently holomer assembly in some manner controls steady-state levels of the subunits. It will be interesting to similarly target other multisubunit complexes for comparative analysis.
In summary, we have employed GLM as an approach to determine patterns of protein/transcript concordance for a series of analyses where time was an integral component of experimental design. This approach proved to be more robust than methods used to study protein/transcript concordance based on pairwise correlations. The results of our analyses over five stages of Arabidopsis seed filling are consistent with an overall concordance of 56%. This value is substantially higher than those predicted using three different correlation coefficients, but is still too low to justify generalizations and/or assumptions regarding protein levels based solely on transcript profiling. The results indicate that GLM will be useful in data-mining applications aimed at identifying candidates suitable for studying posttranscriptional regulation of gene expression.
MATERIALS AND METHODS
Plant Material and Growth Conditions
Arabidopsis (Arabidopsis thaliana; Columbia ecotype 0) plants were grown in a controlled environment chamber (16-h-light/8-h-dark cycle, 23°C day/20°C night, 50% humidity, and light intensity of 8,000 LUX). Flowers were tagged upon opening and the developing seeds were collected at 5, 7, 9, 11, or 13 DAF, in the middle of a light cycle (between 11 am and 2 pm central U.S. time).
Seed Oil Content
FA content of developing Arabidopsis seeds at 5, 7, 9, 11, and 13 DAF was determined as described earlier (Hajduch et al., 2006) with minor modifications. Seeds were divided into three Teflon-lined glass screw cap vials per developmental stage (approximately 50 mg of seeds per tube) and dried at 80°C overnight. After dry weight determination, 1 mL of 14% BF3 in methanol was added to each tube along with 17:0 internal standard dissolved in toluene (0.5% of dry mass exactly). Total volume of toluene was brought to 150 μL and samples were incubated at 95°C for 90 min, with mixing every 10 min. After incubation, samples were cooled to 25°C. To each tube, 1 mL of water and 3 mL of hexane were added. Tubes were vortex mixed and centrifuged at 3,000g for 5 min. The upper phase was removed and transferred to a conical glass tube. Samples were back extracted with additional 3 mL of hexane, dried under N2, and resuspended in 400 μL of hexane before GC analysis. The GC analyses and quantitation were performed as described previously (Hajduch et al., 2006).
Protein Isolation and Cy5 Labeling
A total protein fraction was isolated from developing seeds and quantified using the Coomassie dye binding assay (Bio-Rad) with γ-globulin as the standard. For Cy5 labeling, protein pellets were reconstituted in 30 mm Tris-HCl, pH 8.5, containing 7 m urea, 2 m thiourea, and 4% (w/v) CHAPS with vortex mixing for 30 min at 25°C followed by centrifugation for 15 min at 14,000g to remove insoluble material. Then, 50 μg of protein were adjusted to final volume of 10 μL. One microliter of Cy5 (100 pmol) was added and the mixture was incubated on ice for 30 min in the dark. The labeling reaction was terminated by adding 1 μL of 10 mm Lys followed by incubation on ice for an additional 10 min in the dark. For isoelectric focusing (IEF), 50 μg of protein were mixed with equal volume of 2× sample buffer (8 m urea, 130 mm dithiothreitol, and 4% [w/v] CHAPS), incubated 10 min on ice, mixed with 2.25 μL of IPG buffer (Amersham Biosciences), and adjusted to total volume of 450 μL with 1× sample buffer.
For preparative colloidal Coomassie Brilliant Blue G-250-stained gels, protein pellets were resuspended in IEF resuspension media (8 m urea, 2 m thiourea, 2% [w/v] CHAPS, 2% [v/v] Triton X-100, 50 mm dithiothreitol) with vortex mixing as described above. For IEF, 1 mg of total protein was mixed with 2.25 μL of appropriate IPG buffer in a total volume of 450 μL of preparative IEF resuspension medium.
Image Acquisition and Analysis
Fluorescent gels were scanned using a FLA-5000 laser scanner (FUJI Medical). The Coomassie Brilliant Blue-stained gels were imaged by scanning densitometry (300 dpi, 16-bit grayscale). Digitized images were analyzed with ImageMaster 2-D platinum software (version 5.0, GE Healthcare). Protein abundance was expressed as a relative volume according to the normalization method provided by the software.
Protein Identification by MS
Proteins spots were excised from colloidal Coomassie Brilliant Blue-stained 2D gels and trypsin digested as described previously (Hajduch et al., 2005). The MS analyses were carried out with a linear ion trap tandem mass spectrometer (ProteomeX LTQ, Thermo-Fisher) using liquid chromatography and nanospray ionization exactly as described previously (Hajduch et al., 2006).
Database Searching with Spectral Data and Deposition in the Oilseed Proteome Database
Analysis of LC-MS/MS data was performed on a locally licensed copy of SEQUEST software (Eng et al., 1994). Searches were performed against the National Center for Biotechnology Information nonredundant database, Arabidopsis entries only (as of November 2005), and annotation for all protein matches were manually updated to current The Arabidopsis Information Resource annotation (as of December 11, 2009). Search parameters were set as follows: enzyme, trypsin; number of internal cleavage sites, 2; threshold, 500; minimum ion count, 35; peptide mass tolerance, 1.50; variable modifications, oxidation (M); static modification, carboxyamidomethylation (C). Matching peptides were filtered according to correlation scores (XCorr at least 1.5, 2.0, and 2.5 for +1, +2, and +3 charged peptides, respectively), peptide probability (maximum 0.05). For all protein assignments, a minimum of two unique, nonoverlapping peptides was required. Protein expression and summarized mass spectral assignment data from this investigation have been uploaded onto the Oilseed Proteomics server (http://oilseedproteomics.missouri.edu). Programming for the web database was performed as described previously (Hajduch et al., 2005). Data are viewable through 2-DE gels and a protein identification table. The spots on 2-DE gel and protein numbers in the protein table are hyperlinked to display expression profile and protein identification data.
Isolation of Total RNA
For total RNA isolation, a RNeasy plant mini kit (Qiagen) was used with minor modifications. In total 20 to 50 mg of harvested Arabidopsis seeds were homogenized with liquid N2 in 1.5 mL sterile polypropylene tubes using plastic pestles. Samples were resuspended in the kit-provided resuspension buffer (for 25 mg of seeds, 450 μL of resuspension buffer), incubated 5 min at 57°C, cooled on ice, and transferred to provided lilac QIAshredder spin column (450 μL of homogenate per column). The remaining procedure was performed as described according to the manual, with optional centrifugation after last wash with elution buffer. The concentration of total RNA was determined using a NanoDrop ND-1000 spectrophotometer (NanoDrop).
RNA Amplification, Target Biotin Labeling, and Hybridization to the Arabidopsis ATH1 Genechips
One microgram of seed total RNA was used to make biotin-labeled antisense RNA (aRNA) using the MessageAmp II-Biotin enhanced single round aRNA amplification kit (Ambion) according to manufacturer's procedures. Briefly, total RNA was reverse transcribed to first-strand cDNA with oligo(dT) primer bearing a 5μ-T7 promoter using ArrayScript reverse transcriptase. The first-strand cDNA then underwent second-strand synthesis and clean up to become the template for in vitro transcription. Biotin-labeled aRNA was synthesized using T7 RNA transcriptase with biotin-NTP mix. After purification, aRNA was fragmented in 1× fragmentation buffer at 94°C for 35 min. Ten micrograms of fragmented aRNA in 200 μL of hybridization solution was hybridized to the Arabidopsis ATH1 genechip (Affymetrix) at 45°C for 20 h. After hybridization, chips were washed and stained with R-phycoerythrin-streptavidin on Affymetrix fluidics station 450 using fluidics protocol EukGE-WS2v4. The image data were acquired using an Affymetrix Genechip scanner 3000.
Microarray Data Analysis
Microarray data analysis for the three replicates for each developmental stage was performed using GeneSpring GX 7.3 software (Silicon Genetics). The array intensities were normalized using data transformation to set measurements less than 0.01 to 0.01 per chip normalization to 50th percentile, and per gene normalization to median (Supplemental Fig. S1). The normalized data were transformed to natural log values to calculate the expression value. The scatter plots of replicate arrays performed after normalization indicated the data were highly reproducible. After normalization a Student's t test with a P value cutoff of 0.05, and the Benjamin and Hochberg false discovery rate was applied to filter out genes having significantly differentiated expression patterns.
Development of Cognate Gene and Protein Models for Statistical Analysis
Initially, cognate transcript and protein pairs were determined by verifying at least one protein was detected for each 2-DE spot groups. Then expression data for 2-DE spot groups that were assigned to the same gene were summed for comparison to transcript expression. To correlate proteomic and transcriptomic datasets, both the protein and transcript expression values were tested to find a minimum variance transform with the Box-Cox procedure under linear modeling assumptions (Box and Cox, 1964). The protein and microarray data were transformed y = log2 (x) where x is the observed volume or optical intensity, and the transformed values were used for the rest for the analysis. Each source of data was then statistically modeled to account for known but experimentally irrelevant factors, or sources of variation, leaving the experimentally relevant factor day within spot or probe and experimental error in the residuals.
To put the data into the same relative numeric scale, known sources of variation in the data collection process were statistically modeled and if the sources of variation were not of experimental interest their contributions to experimental variation were removed. In the case of protein data, the factors of experimental interest were spot volumes sampled at each developmental stage. These factors, together with a temporal term constitute the factor level variability. A mixed linear statistical model with the intercept held as a random effect was fit to the data without the temporal factor. The observed values minus the predicted values were the residuals and were centered on a mean value of 0. These residual values were divided by the sd of the residuals to get a normalized and standardized expected variable of 1 to estimate the spot volume for the ATG Probe for this time. Across all ATG numbers the transformed and scaled values were used to model the spot measurement values.
Because of the nature of the 2-DE analyses, there are occasionally missing values in the proteomics data. However there were sufficient biological repetitions and temporal samplings to allow use of the expectation-maximization algorithm, to estimate the distribution of the missing values and produce five values for each time point (Dempster et al., 1977). This increased the dataset size by a factor of five. The augmented dataset was then used throughout the rest of the analyses. For microarrays it was expected that probe intensity across seed development was of experimental interest, and the microarray data were normalized and standardized in the same way as the proteomics data.
The normalized proteomic and microarray datasets were then merged on the field Probe_ID-ATG ID. There are 319 protein/transcript pairs through five developmental time points, and three biological replicates. The normalized, standardized, and merged analytic datasets contain 23,025 data records and comprise the dataset used in all subsequent analyses.
Pairwise Nonparametric Analyses
The PPMC and KROC make different assumptions about the underlying distribution of data. The Pearson r measures the strength of linear association between the random variables x and y. It is scale independent and assumes the random variables have a normal distribution. The Kendall τ is a measure of the concordance for all pairs of observed values (xj,yj) and (xi,yi) where a pair is concordant if xi > xj and yi > yj or xi < xj and yi < yj, and discordant otherwise. Associated with each correlation coefficient is a measure of the probability of making a type I error; that is, the probability of being in error if you reject the null hypothesis that the correlation is zero. We can count the number of correlations that are positive or negative either across days or within days. We can also restrict these counts to those correlations with significant P values < 0.05. However, this ignores the multiple hypotheses testing condition, which says that if we want to have an overall error rate of αF, we have to apply a more stringent selection criterion, α0, for the test. Two possible methods for finding this cutoff value are Sidak's method where α0 = 1 − (1 − αF)1/G and G is the number of tests, 319 in this case, and Bonferroni's method where α0 = αF/G. Applying Sidak's method we get α0 = 0001601 and from Bonferroni we get α0 = 0001567. Thus, there will be an approximate family wise error rate of α0 = 0.05 if we set the cutoff value at α0 = 0.00016.
GLM
Regression analysis with time as integral part of the model was used to determine importance of time factor in determining protein/transcript correlations. The regression model that was fit to the protein and microarray data is a quadratic model with log spot or log probe intensity as the dependent variable and time and time squared as the independent variables. Both dependent variables were modeled with the same quadratic regression model, y = β0 + β1I + β2D + β3DI + β4D2 + β5D2I + ϵ, where y is the dependent variable, D is the independent variable day, and I is an indicator variable (I = 0 if DIGE otherwise I = 1), β is the regression parameter, and ϵ is the error term. The intercept parameter for protein only is β0, the intercept parameter for microarray is (β0 + β1) and if the parameter β1 is not statistically significantly different from 0 then there is no statistical difference between the intercepts for DIGE or microarray. Similar interpretations can be given for the linear and quadratic terms in the regression model. We will use the following notation: β0, β2, and β4, are the intercept, linear, and quadratic terms for the protein regression model. The microarray regression model has parameters β01 = β0 + β1, β23 = β2 + β3, and β45 = β4 + β5. The difference terms are β1, β3, and β5. If a difference term is not statistically different from 0, then that parameter in the protein and microarray models is statistically equivalent. To assess how well the model fits the data we can use the coefficient of multiple determination R2. Using standard linear modeling notation we can define 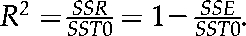 . For each spot probe pair we fit a model across both types of data, all days, and all three replicate observations. This assumes that the residuals from each model are normally distributed, r: N (0, σ2). An examination of the residual plots shows that the model fits the data well in most instances.
Since protein intensity measurements are scaled differently than microarray intensity measurements, it would not be expected that the regression equations would be the same. However, it would be expected that the linear parameter slope, β2 and β23, and the quadratic parameter direction of change over time, β4 and β45, would be good metrics for similarity or dissimilarity of biological activity. It is possible to define pairs of corresponding parameter values, β0 and β01 or β2 and β23 or β4 and β45, as having concordance if the two parameters are either significantly positive or negative for the same spot probe. Similarly, discordance would be if one parameter is significantly positive and the other is significantly negative. For concordance and discordance, there is no requirement for the parameters to be significantly different from 0. The frequency and degree of concordance/discordance measurements are presented in Table II, indicating the similarity of response for protein/transcript pairs.
Supplemental Data
The following materials are available in the online version of this article.
Supplemental Figure S1. 2-DE analysis of proteins (50 μg) isolated from immature seeds of 5, 7, 9, 11, or 13 DAF and labeled with n-hydroxysuccinimide-activated Cy5.
Supplemental Figure S2. Microarray analysis of RNA isolated from developing Arabidopsis seeds at 5, 7, 9, 11, or 13 DAF.
Supplemental Table S1. FA composition of developing Arabidopsis seeds.
Supplemental Table S2. Expression profile data for 1,025 protein spot groups from two-dimensional gels.
Supplemental Table S3. Master table of MS/MS protein identification and GLM data.
Supplemental Table S4. Summary and distribution of GLM concurrence sorted according to protein functional classes.
Supplementary Material
Acknowledgments
We thank Dr. Huachun Wang for Arabidopsis seed imaging and the two anonymous reviewers for helpful comments.
References
- Agrawal GK, Hajduch M, Graham K, Thelen JJ. (2008) In-depth investigation of the soybean seed-filling proteome and comparison with a parallel study of rapeseed. Plant Physiol 148: 504–518 [DOI] [PMC free article] [PubMed] [Google Scholar]
- Andre C, Froehlich JE, Moll MR, Benning C. (2007) A heteromeric plastidic pyruvate kinase complex involved in seed oil biosynthesis in Arabidopsis. Plant Cell 19: 2006–2022 [DOI] [PMC free article] [PubMed] [Google Scholar]
- Andriotis VME, Kruger NJ, Pike MJ, Smith AM. (2010) Plastidial glycolysis in developing Arabidopsis embryos. New Phytol 185: 649–662 [DOI] [PubMed] [Google Scholar]
- Antoine W, Miernyk JA. (2007) Shape-to-string mapping: a novel approach to clustering time-index biomics data. Online J Bioinformatics 8: 139–153 [Google Scholar]
- Baerenfaller K, Grossmann J, Grobei MA, Hull R, Hirsch-Hoffmann M, Yalovsky S, Zimmermann P, Grossniklaus U, Gruissem W, Baginsky S. (2008) Genome-scale proteomics reveals Arabidopsis thaliana gene models and proteome dynamics. Science 320: 938–941 [DOI] [PubMed] [Google Scholar]
- Baud S, Wuilleme S, To A, Rochat C, Lepiniec L. (2009) Role of WRINKLED1 in the transcriptional regulation of glycolytic and fatty acid biosynthetic genes in Arabidopsis. Plant J 60: 933–947 [DOI] [PubMed] [Google Scholar]
- Box GEP, Cox DR. (1964) An analysis of transformations. J R Stat Soc Series B Stat Methodol 26: 211–252 [Google Scholar]
- Chen G, Gharib TG, Huang CC, Taylor JM, Misek DE, Kardia SL, Giordano TJ, Iannettoni MD, Orringer MB, Hanash SM, et al. (2002) Discordant protein and mRNA expression in lung adenocarcinomas. Mol Cell Proteomics 4: 304–313 [DOI] [PubMed] [Google Scholar]
- Corder GW, Foreman DI. (2009) Nonparametric Statistics for Non-Statisticians: A Step-by-Step Approach. Wiley, Hoboken, NJ [Google Scholar]
- Cox B, Kislinger T, Wigle DA, Kannan A, Brown K, Okubo T, Hogan B, Jurisica I, Frey B, Rossant J, et al. (2007) Integrated proteomic and transcriptomic profiling of mouse lung development and Nmyc target genes. Mol Syst Biol 3: 1–15 [DOI] [PMC free article] [PubMed] [Google Scholar]
- Degerman R. (1982) Ordered binary trees constructed through an application of Kendall's tau. Psychometrika 47: 523–527 [Google Scholar]
- Dempster AP, Laird NM, Rubin DB. (1977) Maximum likelihood from incomplete data via the EM algorithm. J R Stat Soc Series B Stat Methodol 39: 1–38 [Google Scholar]
- Eng JK, McCormack AL, Yates III., Jr (1994) An approach to correlate tandem mass spectral data of peptides with amino acid sequences in a protein database. J Am Soc Mass Spectrom 5: 976–989 [DOI] [PubMed] [Google Scholar]
- Friston K. (2008) Hierarchical models in the brain. PLoS Comput Biol 4: e1000211. [DOI] [PMC free article] [PubMed] [Google Scholar]
- Goldberg RB, de Paiva G, Yadegari R. (1994) Plant embryogenesis: zygote to seed. Science 266: 605–614 [DOI] [PubMed] [Google Scholar]
- Griffin TJ, Gygi SP, Ideker T, Rist B, Eng J, Hood L, Aebersold R. (2002) Complementary profiling of gene expression at the transcriptome and proteome levels in Saccharomyces cerevisiae. Mol Cell Proteomics 1: 323–333 [DOI] [PubMed] [Google Scholar]
- Gygi SP, Rochon Y, Franza BR, Aebersold R. (1999) Correlation between protein and mRNA abundance in yeast. Mol Cell Biol 19: 1720–1730 [DOI] [PMC free article] [PubMed] [Google Scholar]
- Hajduch M, Casteel JE, Hurrelmeyer KE, Song Z, Agrawal GK, Thelen JJ. (2006) Proteomic analysis of seed filling in Brassica napus: developmental characterization of metabolic isozymes using high-resolution two-dimensional gel electrophoresis. Plant Physiol 141: 32–46 [DOI] [PMC free article] [PubMed] [Google Scholar]
- Hajduch M, Ganapathy A, Stein JW, Thelen JJ. (2005) A systematic proteomic study of seed filling in soybean: establishment of high-resolution two-dimensional reference maps, expression profiles, and an interactive proteome database. Plant Physiol 137: 1397–1419 [DOI] [PMC free article] [PubMed] [Google Scholar]
- Hendrickson DG, Hogan DJ, McCullough HL, Myers JW, Herschlag D, Ferrell JE, Brown PO. (2009) Concordant regulation of translation and mRNA abundance for hundreds of targets of a human microRNA. PLoS Biol 7: e1000238. [DOI] [PMC free article] [PubMed] [Google Scholar]
- Hills MJ. (2004) Control of storage-product synthesis in seeds. Curr Opin Plant Biol 7: 302–308 [DOI] [PubMed] [Google Scholar]
- Hornshøj H, Bendixen E, Conley LN, Andersen PK, Hedegaard J, Panitz F, Bendixen C. (2009) Transcriptomic and proteomic profiling of two porcine tissues using high-throughput technologies. BMC Genomics 10: 30. [DOI] [PMC free article] [PubMed] [Google Scholar]
- Ilsley GR, Luscombe NM, Apweiler R. (2009) Know your limits: assumptions, constraints and interpretations in systems biology. Biochim Biophys Acta 1794: 1280–1287 [DOI] [PubMed] [Google Scholar]
- Jayapal KP, Philp RJ, Kok YJ, Yap MG, Sherman DH, Griffin TJ, Hu WS. (2008) Uncovering genes with divergent mRNA-protein dynamics in Streptomyces coelicolor. PLoS One 3: e2097. [DOI] [PMC free article] [PubMed] [Google Scholar]
- Le BH, Wagmaister JA, Kawashima T, Bui AQ, Harada JJ, Goldberg RB. (2007) Using genomics to study legume seed development. Plant Physiol 144: 562–574 [DOI] [PMC free article] [PubMed] [Google Scholar]
- Le Roch KG, Johnson JR, Florens L, Zhou Y, Santrosyan A, Grainger M, Yan SF, Williamson KC, Holder AA, Carucci DJ, et al. (2004) Global analysis of transcript and protein levels across the Plasmodium falciparum life cycle. Genome Res 14: 2308–2318 [DOI] [PMC free article] [PubMed] [Google Scholar]
- Nicolas T. (2009) Data mining, a tool for systems biology or a systems biology tool. J Comput Sci Syst Biol 2: 216–218 [Google Scholar]
- Nie L, Wu G, Culley DE, Scholten JC, Zhang W. (2007) Integrative analysis of transcriptomic and proteomic data: challenges, solutions and applications. Crit Rev Biotechnol 27: 63–75 [DOI] [PubMed] [Google Scholar]
- Ørntoft TF, Thykjaer T, Waldman FM, Wolf H, Celis JE. (2002) Genome-wide study of gene copy numbers, transcripts, and protein levels in pairs of non-invasive and invasive human transitional cell carcinomas. Mol Cell Proteomics 1: 37–45 [DOI] [PubMed] [Google Scholar]
- Pascal LE, True LD, Campbell DS, Deutsch EW, Risk M, Coleman IM, Eichner LJ, Nelson PS, Liu AY. (2008) Correlation of mRNA and protein levels: cell type-specific gene expression of cluster designation antigens in the prostate. BMC Genomics 9: 246. [DOI] [PMC free article] [PubMed] [Google Scholar]
- Piques M, Schulze WX, Höhne M, Usadel B, Gibon Y, Rohwer J, Stitt M. (2009) Ribosome and transcript copy numbers, polysome occupancy and enzyme dynamics in Arabidopsis. Mol Syst Biol 5: 314. [DOI] [PMC free article] [PubMed] [Google Scholar]
- Prioul JL, Méchin V, Lessard P, Thévenot C, Grimmer M, Chateau-Joubert S, Coates S, Hartings H, Kloiber-Maitz M, Murigneux A, et al. (2008) A joint transcriptomic, proteomic and metabolic analysis of maize endosperm development and starch filling. Plant Biotechnol J 6: 855–869 [DOI] [PubMed] [Google Scholar]
- Rodgers JL, Nicewander WA. (1988) Thirteen ways to look at the correlation coefficient. Am Stat 42: 59–66 [Google Scholar]
- Ruuska SA, Girke T, Benning C, Ohlrogge JB. (2002) Contrapuntal networks of gene expression during Arabidopsis seed filling. Plant Cell 14: 1191–1206 [DOI] [PMC free article] [PubMed] [Google Scholar]
- Shang J, Lehrman MA. (2004) Discordance of UPR signaling by ATF6 and Ire1p-XBP1 with levels of target transcripts. Biochem Biophys Res Commun 317: 390–396 [DOI] [PubMed] [Google Scholar]
- Shankavaram UT, Reinhold WC, Nishizuka S, Major S, Morita D, Chary KK, Reimers MA, Scherf U, Kahn A, Dolginow D, et al. (2007) Transcript and protein expression profiles of the NCI-60 cancer cell panel: an integromic microarray study. Mol Cancer Ther 6: 820–832 [DOI] [PubMed] [Google Scholar]
- Shendure J. (2008) The beginning of the end for microarrays? Nat Methods 5: 585–587 [DOI] [PubMed] [Google Scholar]
- Tian L, Peel GJ, Lei Z, Aziz N, Dai X, He J, Watson B, Zhao PX, Sumner LW, Dixon RA. (2009) Transcript and proteomic analysis of developing white lupin (Lupinus albus L.) roots. BMC Plant Biol 9: 1. [DOI] [PMC free article] [PubMed] [Google Scholar]
- Van den Bulcke T, Lemmens K, Van de Peer Y, Marchal K. (2006) Inferring transcriptional networks by mining omics data. Curr Bioinform 1: 301–313 [Google Scholar]
- Waldorp L. (2009) Robust and unbiased variance of GLM coefficients for misspecified autocorrelation and hemodynamic response models in fMRI. Int J Biomed Imaging 2009: 723912. [DOI] [PMC free article] [PubMed] [Google Scholar]
- Wu G, Nie L, Zhang W. (2008) Integrative analyses of posttranscriptional regulation in the yeast Saccharomyces cerevisiae using transcriptomic and proteomic data. Curr Microbiol 57: 18–22 [DOI] [PubMed] [Google Scholar]
Associated Data
This section collects any data citations, data availability statements, or supplementary materials included in this article.