

Abstract
PlantMetabolomics.org (PM) is a web portal and database for exploring, visualizing, and downloading plant metabolomics data. Widespread public access to well-annotated metabolomics datasets is essential for establishing metabolomics as a functional genomics tool. PM integrates metabolomics data generated from different analytical platforms from multiple laboratories along with the key visualization tools such as ratio and error plots. Visualization tools can quickly show how one condition compares to another and which analytical platforms show the largest changes. The database tries to capture a complete annotation of the experiment metadata along with the metabolite abundance databased on the evolving Metabolomics Standards Initiative. PM can be used as a platform for deriving hypotheses by enabling metabolomic comparisons between genetically unique Arabidopsis (Arabidopsis thaliana) populations subjected to different environmental conditions. Each metabolite is linked to relevant experimental data and information from various annotation databases. The portal also provides detailed protocols and tutorials on conducting plant metabolomics experiments to promote metabolomics in the community. PM currently houses Arabidopsis metabolomics data generated by a consortium of laboratories utilizing metabolomics to help elucidate the functions of uncharacterized genes. PM is publicly available at http://www.plantmetabolomics.org.
In the post genomics era, metabolomics is fast emerging as a vital source of information to aid in solving systems biology puzzles with an emphasis on metabolic solutions. Metabolomics is the science of measuring the pool sizes of metabolites (small molecules of Mr ≤ 1,000 D), which collectively define the metabolome of a biological sample (Fiehn et al., 2000; Hall et al., 2002). Coverage of the entire plant metabolome is a daunting task as it is estimated that there are over 200,000 different metabolites within the plant kingdom (Goodacre et al., 2004). Although technology is rapidly advancing, there are still large gaps in our knowledge of the plant metabolome.
Despite this lack of complete knowledge and the immense metabolic diversity among plants, metabolomics has become a key analytical tool in the plant community (Hall et al., 2002). This has led to the emergence of multiple experimental and analytical platforms that collectively generate millions of metabolite data points. Because of this vast amount of data, the development of public databases to capture information from metabolomics experiments is vital to provide the scientific community with comprehensive knowledge about metabolite data generation, annotation, and integration with metabolic pathway data. Some examples of these public databases are given below. The Human Metabolome Project contains comprehensive data for more than 2,000 metabolites found within the human body (Wishart et al., 2007). The Golm Database is a repository that provides access to mass spectrometry (MS) libraries, metabolite profiling experiments, and related information from gas chromatography (GC)-MS experimental platforms, along with tools to integrate this information with other systems biology knowledge (Kopka et al., 2005). The Madison Metabolomics Consortium Database contains primarily NMR spectra for Arabidopsis (Arabidopsis thaliana) and features thorough NMR search tools (Cui et al., 2008). SetupX and Binbase provide a framework that combines MS data and biological metadata for steering laboratory work flows and employs automated metabolite annotation (Scholz and Fiehn, 2007).
A single analytical technique cannot identify and quantify all the metabolites found in plants. Thus, PlantMetabolomics.org (PM) was developed to provide a portal for accessing publicly available MS-based plant metabolomics experimental results from multiple analytical and separation techniques. PM also follows the emerging metabolomics standards for experiment annotation. PM has extensive annotation links between the identified metabolites and metabolic pathways in AraCyc (Mueller et al., 2003) at The Arabidopsis Information Resource (Rhee et al., 2003) and the Plant Metabolic Network (www.plantcyc.org), the Kyoto Encyclopedia of Genes and Genomes (KEGG; Kanehisa et al., 2004), and MetNetDB (Wurtele et al., 2007).
Standards for the annotation of metabolomics experiments are still under active development and the metadata types collected in PM are based on the recommendations of the Metabolomics Standards Initiative (MSI; Fiehn et al., 2007a) and the Minimal Information for a Metabolomic Experiment (Bino et al., 2004) standards. MSI attempts to capture the complete annotation of metabolomics experiments and includes metadata of the experiments along with the metabolite abundance data. The initial database schema design was guided by the schema proposed in the Architecture for Metabolomics project (Jenkins et al., 2004).
DEVELOPMENT OF PM: RATIONALE
The rationale for the development of PM as an information portal is to provide free public access to experimental data along with cross-references to related genetic, chemical, and pathway information. The portal also serves as an information resource for the field of metabolomics by providing tutorials on how to conduct metabolomics experiments. It describes minimum reporting standards (Fiehn et al., 2007a, 2007b; Sumner et al., 2007) for plant metabolomics experiments based on the recommendations of the MSI. In addition, PM contains background information about the experimental design and tools that can be used to analyze the collected data (Helsel, 2005). To our knowledge, PM is the only plant metabolomics database that contains data from Arabidopsis metabolomics experiments that utilize multiple analytical detectors combined with different separation technologies. These include GC-MS, GC time-of-flight MS, capillary electrophoresis-MS, ultra-high-pressure liquid chromatography coupled to a hybrid quadrupole time-of-flight MS, and liquid chromatography-MS (Dunn and Ellis, 2005). The statistical analysis and visualization tools are easy to use and aid non-statisticians in the analysis of the effects of different environmental conditions, genetic perturbations, and other experimental factors. The information collected within PM can be used to form hypotheses about the roles of genes of unknown function in Arabidopsis by comparing the metabolome of a wild-type sample to that of a sample altered by a mutation within a target gene, which can provide clues as to the function of that gene. The data (both biological and metabolic) and tools contained within PM, all available to the scientific community, are detailed in this article.
DESIGN REQUIREMENTS AND FUNCTIONALITY
PM allows users to explore and interpret data sets and put them in a biological context. This requires the integration of relative metabolite abundance along with the metadata of the experimental conditions including growth, harvest, and storage conditions of sample tissue, sample extraction, and instrument parameters. We also place an emphasis on ensuring ease of use and providing additional information about each identified metabolite by linking to other data sources such as AraCyc, KEGG, MetNetDB, and PubChem (Fig. 1).
Figure 1.

Diagram of the main components of the PM portal.
The MSI specifies the minimum amount of metadata from the metabolomics experiments that must be reported so that experiments can be replicated and results can be verified. These minimum data include descriptions of biological study design, sample preparation, data acquisition, data processing, and data analysis procedures. One goal of PM is to fulfill the outlined recommendations by the MSI. Data contributors are required to use the standard data submission spreadsheet templates (available through the portal) to submit metabolomics data. These sheets follow Architecture for Metabolomics and Minimal Information for a Metabolomic Experiment specifications to capture the metadata of an experiment. PM also includes educational video tutorials to aid metabolomics researchers in quality control.
PLANTMETABOLOMICS CONTENT
PlantMetabolomics in its current state houses the metabolite data generated from plant metabolomics experiments performed under the Arabidopsis 2010 program funded by the National Science Foundation. A consortium of metabolomics and metabolite profiling laboratories, in partnership with biochemists, biostatisticians, and bioinformaticists, generated the data to formulate hypotheses about Arabidopsis genes of unknown function. The consortium employed a strategy of generating Arabidopsis material at a single location followed by distribution to all analytical laboratories. Different extraction processes and analytical techniques were used among the laboratories; ultimately providing analysis of roughly 1,800 metabolites in each of the experiments conducted, around 400 of which are chemically defined. In total, among all experiments stored in the current database, roughly 3,100 compounds were detected, including 952 chemically defined compounds. A total of 579 of the known compounds have been identified in AraCyc and many of them participate in metabolic pathways described in that database. The metabolite data, along with the metadata, as generated by this consortium, are stored in the PM database.
EXPERIMENT ANNOTATION
The pipelines used by the analytical laboratories in this consortium are captured through metadata for distribution via the database. Each step of the process requires the collection of information to provide users with an understanding of collection, distribution, and extraction of sample material, along with the instrumentation setup and data processing (Fig. 2). Experimental metadata provides information about the growth and harvesting regimen, including the temperature, illumination, duration of growth, humidity, and storage parameters, which were used to produce the Arabidopsis tissue samples for analysis. This metadata also includes information that pertains to the genetic background of the samples.
Figure 2.

Schematic representation of the process used in generation of metabolite data including the steps used to generate tissue, process the samples, and collect the data. At each step metadata is collected and recorded and provided in PM portal.
The analytical metadata is collected in three sections: extraction, chromatography, and MS metadata. Each section includes details about the tissue sample extraction process and the instrumentation models, settings, and parameters used for the chromatogram and spectrometer for each analytical platform.
Each laboratory individually processes the metabolomics data obtained from the specific platform used. Metabolite identification is based on procedures developed in each individual laboratory that utilize comparisons of retention time, retention index, and mass fragmentation patterns compared to those of authentic standard compounds (when available) included in both private and public MS libraries. Metabolite peaks that cannot be chemically annotated are given a unique identifier (Bino et al., 2004). The raw data is processed and normalized based on each laboratory's instrument detection limit and analytical procedure. Specific processing procedures for each platform are available on the database on the protocols page. The processed and normalized data from each laboratory has been collected for each experiment and loaded into the database. The public can access the data online or download it for use in other applications.
DESIGN OF EXPERIMENTS
The plant metabolome responds to both environmental (E) and genetic (G) factors during plant growth. Environmental parameters such as temperature, light intensity, growing medium, humidity, and all other abiotic and biotic factors that affect plant growth and development are defined and stored. The genetic parameter is defined by the integrated expression of the alleles that encompass the organism's genome. The design of experiments conducted by the above consortium took both the genetic and environmental parameters into consideration. Genetic parameters were manipulated by using Arabidopsis stocks that contained T-DNA insertions in either a gene of known function or gene of unknown function obtained from the Arabidopsis Biological Resource Center. The stocks were selected based on availability and current knowledge and on gene predictions from association networks (Lee et al., 2010). All mutant stocks were visibly screened for phenotypes that resembled wild-type seedlings. Pictures of each mutant line at 17 d after sowing are available within PM.
PM currently contains metabolomics data from two types of experimental designs that varied the G × E interactions (Table I). The first setup used a combination of G × E variations, where the genetic parameter was comprised of two different genotypes (wild type and one mutant stock) and the environmental parameter was changed in a single abiotic or biotic manner. The experiments that fall into this first category provide information on the overall effect that both the environment and genetic parameters have on the metabolome of Arabidopsis seedlings. The second setup, which encompasses a large percentage of the data, varied only the genetic parameter and kept the environmental conditions constant during the growth period and across all experiments. Each experiment contained wild type along with eight to 15 mutant lines representing Arabidopsis stocks carrying T-DNA mutant alleles. Holding the environment constant and varying the genetic parameter provides metabolomic data that is a consequence of the genetic change and can therefore provide information about the consequence of mutating a specific gene within each stock.
Table I. Experimental setups used to generate metabolomics data currently contained in PM.
| Experiment Name | Factors Varied |
||
| Environmental (E) | Genetic (G) | Total (G × E) | |
| EIE2 | 7 | 2 | 14 |
| Fatb induction | 2 | 2 | 4 |
| Elo1 induction | 3 | 2 | 6 |
| ME1 | 1 | 9 | 9 |
| ME2 | 1 | 11 | 11 |
| ME3 | 1 | 16 | 16 |
| ME4 | 1 | 14 | 14 |
| ME5 | 1 | 11 | 11 |
EXPERIMENTAL DATA
Metabolite abundance data can be downloaded along with the metadata for each experiment contained in PM. There are three options for downloading metabolite abundance data. The first option allows the users to select and download data from specific experiments and/or analytical platforms. The downloaded file contains the user-chosen results compiled in a comma separated values format. This option also allows users to download the correlation coefficients between the various replicates along with the data. Once they download the comma separated values file they can look at the correlation coefficients and determine if they want to exclude part of the data if the correlation among the replicates is low. PM does not exclude any data based on the data quality issues but equips the users with the analysis tools and measurements so that the users can make informed decisions. The second option allows users to download the compiled Excel workbooks for individual experiments that contain a single sheet for each analytical platform. The workbooks contain the original data as submitted by the respective labs. This option provides the data in an easy to use format that can be manipulated by the user for their own analyses. The third option comes in the form of a compressed file (.zip) that provides partially processed data for each of the mutant experiments. This download includes: (1) the further scaled metabolite abundance data that reduces the variation within biological replicates; (2) scatter plots and correlation coefficient values between biological replicate data that provide additional information about the consistency of the replicates; (3) all the metabolites with false discovery rate adjusted t test, P value, and ratios between mutant and wild type, so that users can define the significantly altered metabolites by combining the P value and ratio (fold-change); and (4) Bland-Altman plots (Altman and Bland, 1983) that show changes in metabolite abundance by displaying the log concentration ratio versus the average log concentration across replicates. Detailed information about the data processing can be found in the readme.doc file included in the datasets.
TUTORIALS
The database contains tutorial information about the methodologies for the metabolomics studies developed by the consortium. These methodologies reflect metabolomics’ utility in functional genomics and the current state of the technology. Metabolomics is not yet a widely utilized technology and it is thus important to train researchers in the methodologies, technologies, and standards in metabolite profiling. This ensures laboratory-to-laboratory reproducibility and facilitates metaanalyses across multiple experiments.
Three video tutorials demonstrate the methods used for tissue harvesting and distribution. The experimental metadata describes in detail the process used for harvesting tissue material and the Tissue Harvest video tutorial provides a visual guide for this process. This tutorial details the process used to open petri dishes containing sample material, to collect the tissue, and to immediately halt metabolism by submerging the tissue in liquid nitrogen. This process is completed within <2 min as seen by the elapsed time on the timer. Each laboratory requires specific amounts of tissue for each analytical platform. Collected samples must be weighed and sorted for shipment to the analytical laboratories. The two video tutorials Sample Weighing and Sorting of Tissue Samples and Sample Weighing (Closer View) provide a visualization of this process. The three video tutorials provide an experimentalist with an additional tool to understand and repeat the process used to generate tissue samples required for metabolomics experiments.
The web portal also provides tutorials on how to browse, download, and visualize the available data. These tutorials are provided as help buttons on all the main function pages as well as under the main Tutorials menu option. Many examples and screen shots of resulting pages are provided in the tutorials.
DATA ANALYSIS AND VISUALIZATION OF EXPERIMENTAL DATA
The data analysis and visualization tools permit an analysis of data quality and hypothesis generation with dynamic graphs, which can be automatically generated with easy to use graphical user interfaces.
Users may compare metabolite levels under different experimental conditions through the generation of dynamic ratio plots of the metabolites using the graphical user interface. Users can choose any two experimental factors to compare and select specific analytical platforms to include in the analysis. The resulting ratio plot shows the abundance data (Fig. 3). The x axis shows the logarithm (base 2) ratio of the relative abundance of each metabolite between the mutant and wild-type samples selected (see “Materials and Methods”). The metabolites that have a relatively low fold-change between the two factors are close to the central vertical y axis and the metabolites that have a relatively high fold-change are distant from the central vertical y axis. The metabolites with one or more replicates with missing values are shown with different colored marks for quick inspection of data quality.
Figure 3.

Ratio plot generated by taking the ratio of the log-transformed metabolite abundances in the SALK_0003718 and combined WtCol03 samples in experiment ME#3. Each point on the plot is an individual metabolite. Hyperaccumulation and hypoaccumulation patterns of the metabolites are seen through points that are far to the right or left of the central vertical line, respectively. An investigator may click any point on the plot to be advanced to the metabolite details page for that specific metabolite. In the example, the investigator clicked Met (contained in red circle) and was advanced to the metabolite details page for Met (Fig. 4). [See online article for color version of this figure.]
A summary of the metabolite abundance data is generated along with the ratio plot. This summary contains metabolite names that can be ordered according to the number of missing values (1, 2, 3, or more, or all null values). Detailed metabolite information is available by clicking on its name on the list or on the glyph on the ratio plot.
The error plot shows the change in the metabolite abundance level among the replicates. This helps the users to see if the significant change in the metabolite abundance is similar in replicate samples. The metabolite abundance data can also be visualized in a bar chart (Fig. 4) where metabolite abundance under different experimental parameters is shown for each replicate.
Figure 4.

Metabolite details of Met. An investigator may click on the AraCyc and KEGG links to see metabolite annotations in those databases. The pathway entry shows all the pathways that are impacted by this metabolite and clicking on any pathway name links to AraCyc in the Plant Metabolic Network. Clicking on the List button after a pathway name shows experimental data for all the other metabolites in that pathway. The bar graph shows the abundance of Met in different Arabidopsis mutant lines. All replicates of the same mutant are grouped together for easier outlier detection. Under SALK_003718, the first replicate has unusually high abundance of Met, which signifies that one of the replicates might be an outlier. [See online article for color version of this figure.]
The metabolite details page also provides links to other databases to give users access to more details about the metabolites. These links include metabolic pathway information from Aracyc and MetNetDB and compound information from PubChem, CAS, KEGG, and ChEBI. The names of all the pathways that contain a metabolite are shown on the metabolite annotation details page. Links to experimental data for all the other metabolites that participate in that pathway are also provided.
DATA QUALITY CHECKS
PM provides many options where a user can check the variability between different replicates (Fig. 5) or see if some of the replicates are below the detection limit (Fig. 3). The ultimate decision to exclude the data is left with the users. The data quality plots are provided along with the data. The ratio plot discussed in the previous section also provides instant access to replicates that are below the detection limit by showing them in different colors. A summary list provided with the ratio plots groups metabolites according to the number of missing values. The list can be ordered by the metabolite names to find if the same metabolite is detected by several platforms.
Figure 5.

Replicate quality check: The numbers in boldface are the correlation coefficients between the three replicates in experiment ME#3 for the amino acids platform. Numbers close to one mean that the replicates were consistent. The bottom left triangle shows how the replicates compare using a scatterplot of the log2 values. Replicates 1 and 2 have a lower correlation coefficient than the other replicates. The zeros along the axes show imputed values where the metabolite was not detected. [See online article for color version of this figure.]
QUERY CAPABILITIES
The database can be queried by individual metabolite or pathway names. This feature helps an investigator search for a particular metabolite across different experimental conditions. Once the metabolite is located in an experiment, the investigator can identify the pathways in AraCyc and MetNetDB in which this metabolite participates. The pathway search option finds all metabolites in the PM database that are part of the same pathway. The portal contains a local copy of AraCyc synonyms for metabolites along with the web links to AraCyc. This helps in searching for metabolites by either the names by which they are stored in the PM database or any of the synonyms that can be resolved by AraCyc. The local copy is updated every 4 months.
CONCLUSION
One of the most important functions of any metabolomics database is to present collected data in a way that allows it to be used for comparison among different experiments and platforms. This requires that all metadata of standard operating procedures for sample preparation, data acquisition, and data processing be made available along with the corresponding results. Although there are some commercially available databases (Ridley et al., 2004), to our knowledge, PM is one of the first metabolomics databases available in the fundamental plant research arena. The database combines the results from many different platforms that were used in parallel to analyze the same biological material. At the end of the 2-year pilot study, we have been able to provide data from 50 mutant lines and to capture baseline variations in metabolism in response to environmental condition variations during plant growth and tissue harvest. Web-based visualization tools in the portal make it easy for a non-statistician to do initial exploration of the data, perform quality checks, and generate hypotheses. This platform not only provides the metabolomics data and the analysis tools, it also promotes the field of metabolomics by providing educational tutorials on performing the metabolomics experiments and implementing the MSI standards. We acknowledge that some of the data from the pilot project has low reproducibility between the replicates therefore the users are guided to carefully evaluate the data quality with easy to use visualization tools and tutorials so they can make educated decisions about exclusion of data from their analyses.
The metabolomics consortium expects to profile additional Arabidopsis mutant lines and upload the data to PM as it becomes available. We plan to enhance the resource by adding the derived spectral peak location, mass spectra, and metabolite peak integration data as well as make the actual chromatograms available for download in community accepted formats such as NetCDF and mzML. We plan to add more analysis and visualization tools to make this portal a better aid for generating hypotheses and promoting the field of metabolomics within the community. The web portal is also ready to accept MSI-compliant metabolomics data from other MS-based metabolomics platforms for Arabidopsis and other plants.
MATERIALS AND METHODS
Normalization and Data Processing
Metabolomics data generated are normalized and processed according to each specific laboratory's protocol. This process is detailed for each individual analytical platform and laboratory in the standard operating procedure protocols contained within PM.
Missing Values
The detection limits for every run are typically experimentally determined by the corresponding labs and are reported along with the metabolite data. Missing values or below-detection limit measurements are replaced by one-half of the estimated detection limit if the detection limit is reported for that run; otherwise the missing values are replaced by one-half of the lowest value for that run (Helsel, 2005). Missing value imputations are performed before generating the ratio plots and the error plots.
Ratio Plot
The x axis ordinate is the logarithm (base 2) of the ratio of the relative abundance of each metabolite in the wild-type versus mutant plant:
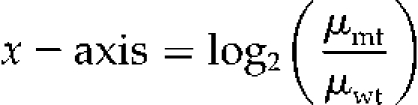 |
The values, μmt and μwt, calculated for each metabolite in each platform, are the sample means for the metabolite abundances of the replicates in the mutant and wild type, respectively.
Error Plots
The se of the log ratio was calculated using the delta method (or one-step Taylor series) approximation:
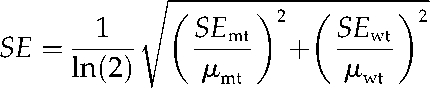 |
The values, μmt and μwt, calculated for each metabolite in each platform, are the sample means for the metabolite abundances of the replicates in the mutant and wild type, respectively. semt and sewt are the ses of the average mutant and wild-type metabolite abundances calculated by:
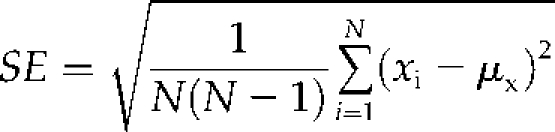 |
where N is the number of replicates.
Compound Curation in AraCyc
The experimentally verified Arabidopsis (Arabidopsis thaliana) compounds identified in the PM project were added into a broader metabolic pathway framework in AraCyc by first matching the names of PM compounds to existing compounds in the database to link the two resources. Named compounds that were not found in AraCyc were investigated using several resources such as MetaCyc (Caspi et al., 2008), SciFinder Scholar (Wagner, 2006), Chemical Entities of Biological Interest (Degtyarenko et al., 2008; ChEBI, EMBL-EBI), PubChem (National Center for Biotechnology Information), and KEGG (Kanehisa et al., 2004) to find chemical structures and synonyms. These compounds were entered into AraCyc and linked to PM. Compound names that describe multiple structures that cannot be conclusively distinguished in the metabolomics experiments were entered as classes. These contain the chemical formula of the identified compound, a text description, and, if possible, a partial structure using R groups to denote structural ambiguities. To place these compounds into the appropriate metabolic context, we searched the scientific literature and the databases used for compound identification. In addition, specific reactions between identified compounds were made based on generic reactions present in AraCyc.
Database Schema
The main structure and data organization of the PlantMetabolomics database are attached in Supplemental Document S1.
Web Site Map
The Web site map of PM is attached in Supplemental Document S2.
How to Use the Web Portal
A case study is provided in Supplemental Document S3.
Data Curation
Data is sent to the administrators using the sample spreadsheets. The spreadsheets are verified for format and then uploaded in the database by the administrators. The collaborators cannot upload the data themselves.
Supplemental Data
The following materials are available in the online version of this article.
Supplemental Document S1. Database schema.
Supplemental Document S2. Web site map of PlantMetabolomics.org.
Supplemental Document S3. Case study on how to use PlantMetabolomics.org.
Supplementary Material
Acknowledgments
This work was performed at the Virtual Reality Application Center, Iowa State University, with the assistance of the Bioinformatics Laboratory of the Bioinformatics and Computational Biology program.
References
- Altman DG, Bland JM. (1983) Measurement in medicine: the analysis of method comparison studies. Statistician 32: 307–317 [Google Scholar]
- Bino RJ, Hall RD, Fiehn O, Kopka J, Saito K, Draper J, Nikolau BJ, Mendes P, Roessner-Tunali U, Beale MH, et al. (2004) Potential of metabolomics as a functional genomics tool. Trends Plant Sci 9: 418–425 [DOI] [PubMed] [Google Scholar]
- Caspi R, Foerster H, Fulcher CA, Kaipa P, Krummenacker M, Latendresse M, Paley S, Rhee SY, Shearer AG, Tissier C, et al. (2008) The MetaCyc database of metabolic pathways and enzymes and the BioCyc collection of pathway/genome databases. Nucleic Acids Res 36: D623–631 [DOI] [PMC free article] [PubMed] [Google Scholar]
- Cui Q, Lewis IA, Hegeman AD, Anderson ME, Li J, Schulte CF, Westler WM, Eghbalnia HR, Sussman MR, Markley JL. (2008) Metabolite identification via the Madison Metabolomics Consortium Database. Nat Biotechnol 26: 162–164 [DOI] [PubMed] [Google Scholar]
- Degtyarenko K, de Matos P, Ennis M, Hastings J, Zbinden M, McNaught A, Alcantara R, Darsow M, Guedj M, Ashburner M. (2008) ChEBI: a database and ontology for chemical entities of biological interest. Nucleic Acids Res 36: D344–D350 [DOI] [PMC free article] [PubMed] [Google Scholar]
- Dunn WB, Ellis DI. (2005) Metabolomics: current analytical platforms and methodologies. Trends Analyt Chem 24: 285–294 [Google Scholar]
- Fiehn O, Kopka J, Dormann P, Altmann T, Trethewey RN, Willmitzer L. (2000) Metabolite profiling for plant functional genomics. Nat Biotechnol 18: 1157–1161 [DOI] [PubMed] [Google Scholar]
- Fiehn O, Robertson D, Griffin J, van der Werf M, Nikolau B, Morrison N, Sumner LW, Goodacre R, Hardy NW, Taylor C, et al. (2007a) The metabolomics standards initiative (MSI). Metabolomics 3: 175–178 [Google Scholar]
- Fiehn O, Sumner LW, Rhee SY, Ward J, Dickerson J, Lange BM, Lane G, Roessner U, Last R, Nikolau B. (2007b) Minimum reporting standards for plant biology context information in metabolomics studies. Metabolomics 3: 195–201 [Google Scholar]
- Goodacre R, Vaidyanathan S, Dunn WB, Harrigan GG, Kell DB. (2004) Metabolomics by numbers: acquiring and understanding global metabolite data. Trends Biotechnol 22: 245–252 [DOI] [PubMed] [Google Scholar]
- Hall R, Beale M, Fiehn O, Hardy N, Sumner L, Bino R. (2002) Plant metabolomics: the missing link in functional genomics strategies. Plant Cell 14: 1437–1440 [DOI] [PMC free article] [PubMed] [Google Scholar]
- Helsel DR. (2005) More than obvious: better methods for interpreting nondetect data. Environ Sci Technol 39: 419A–423A [DOI] [PubMed] [Google Scholar]
- Jenkins H, Hardy N, Beckmann M, Draper J, Smith AR, Taylor J, Fiehn O, Goodacre R, Bino RJ, Hall R, et al. (2004) A proposed framework for the description of plant metabolomics experiments and their results. Nat Biotechnol 22: 1601–1606 [DOI] [PubMed] [Google Scholar]
- Kanehisa M, Goto S, Kawashima S, Okuno Y, Hattori M. (2004) The KEGG resource for deciphering the genome. Nucleic Acids Res 32: D277–D280 [DOI] [PMC free article] [PubMed] [Google Scholar]
- Kopka J, Schauer N, Krueger S, Birkemeyer C, Usadel B, Bergmuller E, Dormann P, Weckwerth W, Gibon Y, Stitt M, et al. (2005) GMD@CSB.DB: the Golm Metabolome Database. Bioinformatics 21: 1635–1638 [DOI] [PubMed] [Google Scholar]
- Lee I, Ambaru B, Thakkar P, Marcotte EM, Rhee SY. (2010) Rational association of genes with traits using a genome-scale gene network for Arabidopsis thaliana. Nat Biotechnol 28: 149–156 [DOI] [PMC free article] [PubMed] [Google Scholar]
- Mueller LA, Zhang P, Rhee SY. (2003) AraCyc: a biochemical pathway database for Arabidopsis. Plant Physiol 132: 453–460 [DOI] [PMC free article] [PubMed] [Google Scholar]
- Rhee SY, Beavis W, Berardini TZ, Chen G, Dixon D, Doyle A, Garcia-Hernandez M, Huala E, Lander G, Montoya M, et al. (2003) The Arabidopsis Information Resource (TAIR): a model organism database providing a centralized, curated gateway to Arabidopsis biology, research materials and community. Nucleic Acids Res 31: 224–228 [DOI] [PMC free article] [PubMed] [Google Scholar]
- Ridley WP, Shillito RD, Coats I, Steiner HY, Shawgo M, Phillips A, Dussold P, Kurtyka L. (2004) Development of the international life sciences institute crop composition database. Journal of Food Composition and Analysis 17: 423–438 [Google Scholar]
- Scholz M, Fiehn O. (2007) SetupX—a public study design database for metabolomic projects. Pac Symp Biocomput 2007: 169–180 [PubMed] [Google Scholar]
- Sumner LW, Amberg A, Barrett D, Beger R, Beale MH, Daykin C, Fan TWM, Fiehn O, Goodacre R, Griffin JL, et al. (2007) Proposed minimum reporting standards for chemical analysis. Metabolomics 3: 211–221 [DOI] [PMC free article] [PubMed] [Google Scholar]
- Wagner AB. (2006) SciFinder Scholar 2006: an empirical analysis of research topic query processing. J Chem Inf Model 46: 767–774 [DOI] [PubMed] [Google Scholar]
- Wishart DS, Tzur D, Knox C, Eisner R, Guo AC, Young N, Cheng D, Jewell K, Arndt D, Sawhney S, et al. (2007) HMDB: the human metabolome database. Nucleic Acids Res 35: D521–D526 [DOI] [PMC free article] [PubMed] [Google Scholar]
- Wurtele E, Li L, Berleant D, Cook D, Dickerson J, Ding J, Hofmann H, Lawrence M, Lee E, Li J, et al. (2007) MetNet: systems biology software for Arabidopsis. Nikolau B, Wurtele E, , Concepts in Plant Metabolomics. Springer, Dordrecht, The Netherlands, pp 145–158 [Google Scholar]
Associated Data
This section collects any data citations, data availability statements, or supplementary materials included in this article.