

Abstract
We characterized the absorption and short-term translocation of cadmium (Cd) in rice (Oryza sativa ‘Nipponbare’) quantitatively using serial images observed with a positron-emitting tracer imaging system. We fed a positron-emitting 107Cd (half-life of 6.5 h) tracer to the hydroponic culture solution and noninvasively obtained serial images of Cd distribution in intact rice plants at the vegetative stage and at the grain-filling stage every 4 min for 36 h. The rates of absorption of Cd by the root were proportional to Cd concentrations in the culture solution within the tested range of 0.05 to 100 nm. It was estimated that the radial transport from the culture to the xylem in the root tissue was completed in less than 10 min. Cd moved up through the shoot organs with velocities of a few centimeters per hour at both stages, which was obviously slower than the bulk flow in the xylem. Finally, Cd arrived at the panicles 7 h after feeding and accumulated there constantly, although no Cd was observed in the leaf blades within the initial 36 h. The nodes exhibited the most intensive Cd accumulation in the shoot at both stages, and Cd transport from the basal nodes to crown root tips was observed at the vegetative stage. We conclude that the nodes are the central organ where xylem-to-phloem transfer takes place and play a pivotal role in the half-day travel of Cd from the soil to the grains at the grain-filling stage.
Contamination of arable soil with cadmium (Cd) is one of the most serious agricultural problems in the world. Crops, particularly irrigated rice (Oryza sativa), are generally suggested as the main source of Cd intake by humans (United Nations Environment Programme, 2008). From the viewpoint of plant nutrition, the dynamics and mechanisms of Cd transition from the soil to the edible parts in the plants should be elucidated.
Generally, the process of metal accumulation in plants mainly consists of uptake from the soil by the roots, xylem loading and transport, and distribution between metal sinks in the aerial parts (Clemens et al., 2002). It has been demonstrated that xylem loading and transport but not absorption by the roots is one of the rate-controlling steps for Cd accumulation in the grain of graminaceous plants. Hart et al. (1998) reported that greater Cd accumulation in durum wheat grain than in bread wheat grain was not correlated with the root influx rates of these cultivars. Harris and Taylor (2004) employed two near-isogenic lines of durum wheat that differ in grain Cd accumulation and showed that elevated activity of root-to-shoot transport of Cd was responsible for the higher accumulation of Cd in grain, but Cd uptake by roots was not. Uraguchi et al. (2009) analyzed two rice cultivars that show different levels of Cd accumulation in the grain and concluded that root-to-shoot Cd translocation via xylem is the major process determining the Cd accumulation level in rice grain. Phloem transport has also been considered a key step of Cd translocation to the grain, because xylem transport is directed mainly to the organs of highest transpiration, such as leaves, but not to the sites of highest demand for mineral, such as grains (Marschner, 1995). Cd was detected in the phloem sap of rice collected from leaf sheaths (Tanaka et al., 2003) and from the uppermost internode at the grain-filling stage (Tanaka et al., 2007). Tanaka et al. (2007) also estimated that 91% to 100% of Cd in rice grains is deposited from the phloem. In wheat, it has been observed in a split-root system that Cd fed to one bundle of the roots moved into the other bundle, probably via the phloem (Welch et al., 1999; Page and Feller, 2005), and steam girdling, which stops only phloem transport but not xylem flow, to the peduncle below the ear reduced Cd translocation to the grain (Riesen and Feller, 2005). These results suggest that the xylem loading and transport is the first rate-controlling step of Cd transition from the soil to the grain in graminaceous plants and the phloem transport and unloading into the grain is the last. However, the intermediate steps between the xylem and phloem transport of Cd have not been clarified. In general, it is known that mineral micronutrients are remobilized from senescent leaves to the phloem at the reproductive stage or transferred from the xylem to the phloem directly via transfer cells (Marschner, 1995; Clemens et al., 2002). Therefore, where and how the xylem-to-phloem transfer of Cd occurs is of considerable interest. The main objective of this study was to quantitatively describe the whole route and the time scale of Cd transition from the soil to the grain in rice at the vegetative and reproductive stages.
In this study, we also raised a methodological challenge. We employed a positron-emitting tracer imaging system (PETIS), one of the most advanced radiotracer-based imaging methods available today. PETIS provides serial time-course images (i.e. animation) of the two-dimensional distribution of a radiotracer within a living organism without contact. Its principle is the same as that of positron emission tomography, which has been widely used for medical diagnosis, but PETIS was specially designed for studying plants and has been applied to many studies on plant nutrition over the last decade (Uchida et al., 2003; Fujimaki, 2007; Fujimaki et al., 2010). Recently, the transport of metals, including iron (Ishimaru et al., 2006, 2007; Tsukamoto et al., 2009), zinc (Suzuki et al., 2006), and manganese (Tsukamoto et al., 2006), in intact graminaceous plants has been visualized using PETIS. Furthermore, the time course of tracer amounts within any selected region of interest (ROI) on the obtained image can be easily generated and applied for mathematical analyses because PETIS provides highly quantitative images. The rates of photoassimilation and the velocities of phloem transport in intact plants under various environmental conditions have been estimated quantitatively using PETIS (Matsuhashi et al., 2005; Kawachi et al., 2006). However, to our knowledge, no study has been carried out to describe the whole dynamics and kinetics of a substance in an intact plant body by taking full advantage of PETIS, namely noninvasive visualization and quantitative time-course analysis. The second objective of this study was to demonstrate the potential of the latest radiotracer imaging technology for plant physiology.
RESULTS
Absorption by Roots
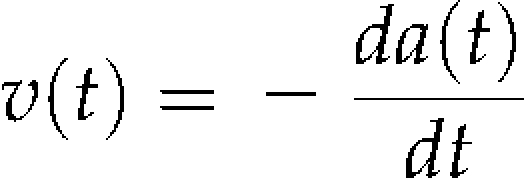
Test plants at the vegetative stage were fed with a hydroponic culture solution containing various levels of Cd including radioactive 107Cd and subjected to experiments for 24 to 36 h. Figure 1 shows a schematic illustration of the feeding system and a photograph of the experimental setup. Time-course data of Cd concentration in the solution (Fig. 2) and water uptake by the plant (data not shown) were monitored. Simultaneously, Cd movement into the aerial part of the plant was imaged using PETIS (Figs. 3 and 4; Supplemental Video S1). Representative time-course data of Cd concentration in the culture solution initially fed with 96 nm Cd are shown in Figure 2. It should be noted that this curve directly reflects absorption by the roots, because the volume of the solution was automatically maintained by supplying a fresh solution without Cd during the experiment. Cd began to decrease immediately after feeding and reached a plateau at about 18 h. This phenomenon, that certain levels of Cd remained and showed the plateau, was always observed regardless of initial Cd levels. The solution in the feeding vessel was replaced with a fresh hydroponic solution without Cd at 30 h. As a result, the curve dropped to almost a background level. This indicated that there was a nonabsorbable portion of Cd in the solution. Because only absorption by the roots can decrease the Cd amount in the culture solution in this study, an equation can be raised as:
 |
(1) |
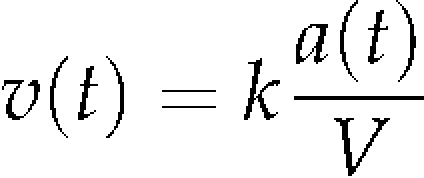
where v(t) and a(t) denote the absorption rate of Cd by the roots (pmol h−1) and the amount of absorbable Cd in the culture solution (pmol) at time t (h), respectively. Then, it was assumed that the Cd absorption, which is probably mediated by transporters, follows Michaelis-Menten kinetics. The reaction rate is approximately proportional to the concentration of substance in the range below the Km value in this kinetics. In this case, the proportionality between the absorption rate and the concentration of Cd can be described as:
 |
(2) |
where k and V denote the coefficient of the proportionality (mL h−1) and the culture volume (mL), respectively. Equations 1 and 2 lead to the following equation:
 |
(3) |
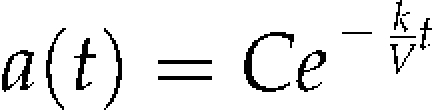
where C is a constant. Consequently, the curve from 0 to 24 h was fitted by the following equation:
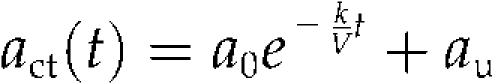 |
(4) |
where act(t), a0, and au denote total Cd level at time t, the initial absorbable Cd level, and the nonabsorbable Cd level, respectively. The parameters that provided the best fit (Fig. 2) were estimated as a0 = 1,675 (pmol), k = 4.4 (mL h−1), and au = 305 (pmol). Similar results were obtained from other experiments with various initial Cd concentrations ranging from 0.2 to 96 nm, in which the k values were estimated as 4.0 ± 0.6 mL h−1 (mean ± se, n = 9) on average. In other words, the rates of Cd absorption by the test plants were always proportional to the Cd concentration in the solution throughout all the experiments, which ranged from approximately 0.05 nm (the final plateau level in experiments with an initial Cd concentration of 0.2 nm) to 100 nm. The rates of water uptake were successfully monitored in seven experiments and proved to be highly constant in each case. The average rate was 2.1 ± 0.2 mL h−1 (mean ± se).
Figure 1.

A, Schematic illustration of the controlling and monitoring system for the culture solution. Numbers are as follows: 1, FOV of PETIS; 2, culture solution in the plastic bag; 3, monitoring of radioactivity of the culture solution using a detector; 4, siphon tube; 5, primary reservoir; 6, secondary reservoir; 7, pump; 8, automatic balance. B, Test plants and the detector heads of PETIS (stars).
Figure 2.

A typical time course of Cd concentration in culture solution during the PETIS experiment. A total of 96 nm Cd (containing 2 nmol of nonradioactive Cd and 2.7 pmol [48 MBq] of 107Cd) was fed at the beginning of the experiment in this case. The culture solution was exchanged with a fresh solution without Cd at 30 h.
Figure 3.

Imaging of Cd transport to the shoot at the vegetative stage. A, FOV of PETIS and ROIs for analysis. The dotted large rectangle indicates the FOV of PETIS. The dotted small square indicates the position of the monitoring probe for the radioactivity of the culture solution. ROIs A and B, Root; ROI C, shoot base; ROI D, leaf sheath; ROI 1, root; ROI 2, shoot base; ROIs 3 to 5, leaf sheath; ROIs 6 to 8, crown root. B, Serial images of Cd movement (0–18 h). Each frame comes from the integration of 15 original images collected every 4 min. The images after 18 h were omitted because of little change after this time point.
Figure 4.

Time courses of Cd amount in the ROIs shown in Figure 3A. A, Estimation of arrival times at ROIs A, B, C, and D. Fitting lines are indicated. B, Time courses of Cd distribution in the culture solution, roots (ROI 1), and shoot base (ROI 2). Fitting curves for culture and ROI 2 are indicated. C, Time courses of Cd distribution in the shoot base (ROI 2) and leaf sheath (ROIs 3–5). D, Time courses of Cd distribution in the shoot base (ROI 2) and crown root (ROIs 6–8).
Transport and Distribution in the Vegetative Stage
Figures 3 and 4 and Supplemental Video S1 show representative results of PETIS imaging and analyses of Cd transport and distribution above the culture solution where the plant was fed with 24 pmol (0.90 nm) of Cd. Figure 3A shows the field of view (FOV) of PETIS and the ROIs for analysis. Some crown roots were split and covered with a wet tissue paper and a plastic bag before the experiment to avoid direct contact with the culture solution. ROIs A to D were for analysis of velocity shown in Figure 4A, and ROIs 1 to 8 were for analysis of the distribution shown in Figure 4, B to D.
Figure 3B shows serial images of Cd distribution obtained by PETIS. Cd appeared in the shoot base region 1 h after feeding and accumulated there predominantly. Subsequently, a small amount of Cd moved up to the leaf sheath and also into the split crown roots. The timing and velocities of Cd transport from the culture to the shoot were analyzed. The time-course curves of Cd distribution in ROIs A to D were generated from the PETIS data and plotted, and then the initial slopes of the curves were fitted to the lines (Fig. 4A). The x intercepts of the fitting lines were used as the arriving times of Cd at the respective ROIs. As a result, it was shown that Cd arrived at the lowest region of the root (ROI A) within 10 min after feeding of Cd to the solution in all the tested plants (n = 9). The local velocity of Cd transport between the adjacent ROIs was estimated as 2.4 ± 0.3 cm h−1 (mean ± se) from 19 intervals in six plants that showed a constant rate of water uptake of 2.0 ± 0.2 mL h−1 (mean ± se).
Time courses of the Cd amount in the culture solution, roots (ROI 1), and shoot base (ROI 2) are shown in Figure 4B. The total amount of Cd absorbed was 20 pmol, and 2.9 pmol of this accumulated in the shoot base after the plateau, approximately. The shapes of the time-course curves from the culture solution and shoot base were opposite to each other, which suggested that Cd absorption by the roots and Cd accumulation into the shoot base were highly coupled. To pursue this model, these curves were fitted to Equation 4 and the following Equation 5:
 |
(4) |
 |
(5) |
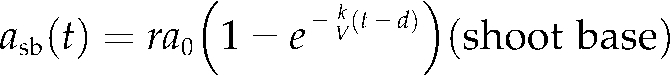
where asb(t), r, and d denote Cd amount in the shoot base at time t, the distribution ratio into the shoot base to absorbed Cd, and the time lag caused by the transport from the culture to the shoot base, respectively. The parameters that provided the best fit were estimated as a0 = 17 (pmol), k = 5.6 (mL h−1), au = 4 (pmol), r = 0.17, and d = 1.4 (h), and the fitting curves are shown in Figure 4B. Similar results were obtained from other experiments with various initial Cd concentrations ranging from 0.2 to 96 nm, in which the distribution ratios into the shoot bases were 0.14 ± 0.01 (mean ± se, n = 9) on average.
Only small portions of Cd were distributed to the upper regions in the leaf sheath (ROIs 4 and 5; Fig. 4C). However, the amount of Cd in the total leaf sheath continued to increase slightly (ROIs 3–5), even after the time-course curves from the culture solution, shoot base, and root reached a plateau after 24 h (culture and ROIs 1 and 2; Fig. 4B). Figure 4D shows the distribution into the crown roots, which were split and kept away from direct contact with the culture solution. These curves demonstrated that Cd arrived at and accumulated in the ROIs in the crown roots serially from the base to the tips in the first 24 h.
Transport and Distribution in the Grain-Filling Stage
Cd transport and distribution in the shoot of rice plants at the grain-filling stage were also analyzed using PETIS. Figure 5A shows the FOV of PETIS and the ROIs for analysis. It was observed that Cd reached the base of the stem approximately 1 h after feeding and then started to accumulate predominantly in the stem base and the nodes in each tiller from the base to the top (Fig. 5, B and C; Supplemental Video S2). The amount of Cd in the stem base fell after an initial peak at 4 h and reached a plateau after 12 h (Fig. 5C). This peak transmitted to the other time-course curves generated from the successively higher nodes in the same culm. The velocities of the upward transport in the culms were estimated in the same manner as shown in Figure 4A. As a result, the average velocity was estimated as 5.4 ± 0.4 cm h−1 (mean ± se) from 14 intervals in the two plants with constant uptake rates of water, 6.4 mL h−1 (left plant in Fig. 5A) and 5.0 mL h−1 (right plant in Fig. 5A).
Figure 5.

Imaging and analysis of Cd transport into shoot at the grain-filling stage. A, FOV of PETIS (dotted rectangle) and ROIs for analysis (numbered ellipses). ROI 1, Stem base; ROIs 2 to 4, nodes. These nodes aligned in the culm connected to the panicle indicated with a dotted ellipse. B, Serial images of Cd movement (0–8 h). Each frame comes from the integration of 15 original images collected every 4 min. The images after 8 h were omitted because of little change after this time point. C, Time courses of Cd distribution in the stem base (ROI 1) and the nodes (ROIs 2–4). A total of 690 pmol of Cd (10 nm) was fed initially in this experiment.
Figure 6 shows the results of another PETIS experiment with a focus on distribution into the panicles. It was shown that Cd reached the panicles at 7 h and started to accumulate constantly. Approximately 0.5% of Cd fed to the culture solution accumulated in the initial 24 h.
Figure 6.

Imaging and analysis of Cd transport into panicles. A, Photograph (left) and PETIS image (right) in the same view. The PETIS image comes from the integration of 360 original images obtained in the first 24 h. B, Time course of Cd accumulation into the panicles. The sum of Cd amounts in the two panicles is indicated. A total of 1,200 pmol of Cd (9.4 nm) was fed initially in this experiment.
After 36 h of PETIS experiments shown in Figure 5, the test plants were subjected to autoradiography. Strong accumulation of Cd was observed in the nodes, and a clear distribution, although at a lower level, was also found in the culms and the panicles (Fig. 7). However, no Cd signal was detected in the leaf blades.
Figure 7.

Autoradiography of detached parts of shoots at the grain-filling stage 36 h after feeding of tracer. Four tillers of the plant in Figure 5A, right, are presented as a representative. An autoradiograph (left) and photograph (right) of the same view are shown. The pairs of letters and the dotted lines indicate the cut sites and borders between the tillers, respectively. Strong accumulation of Cd in the nodes was observed (closed arrowheads), but no signal was detected from the leaf blades (open arrowheads).
DISCUSSION
To our knowledge, this is the first study to visualize Cd movement in intact plants noninvasively and to apply the imaging data for quantitative analyses of the dynamics and kinetics of the Cd transport in the whole body.
Absorption
The kinetics of Cd absorption by the roots was analyzed (Fig. 2), and it was suggested that the absorption rate of Cd by japonica cultivars of rice is proportional to the absorbable Cd concentration in the culture solution within the tested range from 0.05 to 100 nm. Homma and Hirata (1984) suggested that there are two mechanisms in the kinetics of Cd absorption by rice seedlings (8-d-old japonica cv Koshihikari) for a range of Cd concentrations, and they estimated the Km value for the lower concentration as 180 nm. Uraguchi et al. (2009) estimated the Km value as 440 nm (10-d-old japonica cv Sasanishiki). In this study, we supposed Michaelis-Menten kinetics, which approximately shows linearity between the absorption rate and the Cd concentration at a lower concentration than Km, and our results demonstrating linearity below 100 nm were consistent with the previous reports. The proportionality coefficient was estimated as 4.0 ± 0.6 mL h−1 in our study. This means that the amount of Cd absorbed by the test plants every hour was equal to that contained in 4.0 ± 0.6 mL of the culture solution at that moment. On the other hand, the water uptake rate was 2.1 ± 0.2 mL h−1 on average. Therefore, it was suggested that Cd was enriched approximately 2-fold during radial transport in the root tissue. It was also observed that Cd density in the roots exceeded that in the culture solution during the PETIS experiment (data not shown). It is likely that biological (symplastic) absorption but not physical (apoplastic) adsorption mainly accounted for the decreasing curves of Cd concentration in the culture solution, because the curve lasted for more than 12 h (Figs. 2 and 4B) and the influx of Cd into the shoot base was highly coupled with this curve (Fig. 4B). In addition, pretreatment of 0.1 μm Cd (nonradioactive) in the culture for 25 h before the PETIS experiment did not make any significant difference in absorption by the roots and transport to the shoots (data not shown). This supports the above presumption.
It was observed that some portion of Cd in the culture solution remained unabsorbed after the plateau in all the cases tested. This was not an artifact due to the background radioactivity, because the signal intensity fell to almost zero just after replacement with a fresh culture solution at 30 h (Fig. 2) and the withdrawn solution showed radioactivity (data not shown). In addition, a complex shape always appeared at around 3 to 4 h in the absorption curve, as shown in Figures 2 and 4B (culture). The mechanism of these phenomena could be explained as other heavy metals in the culture solution affecting the Cd absorption. Kukier and Chaney (2002) reported that different compositions of hydroponic culture solution with the same Cd concentration can lead to different Cd levels in rice grains. In our experiment, the heavy metal composition of the culture solution may have changed with time during the PETIS experiment, because fresh solution containing heavy metals was added to maintain the total volume. Therefore, it is possible that the resulting irregular balance of heavy metals, a higher level of zinc, for example, inhibited Cd absorption in a competitive manner. Recently, we found that the unabsorbed portion decreased to less than 10% of the initial Cd level and the complex shape around 3 to 4 h disappeared when 0.5 mm CaCl2 solution was used instead of the hydroponic culture solution (data not shown). We think this supports the above hypothesis.
In addition, our method to determine the kinetics of absorption using a radioisotope is characteristic. The concentration of substrate in the culture solution is highest at the beginning of the experiment, and the status of decrease is continuously monitored during the experiment. A data set from one experiment can provide an entire kinetic curve in principle, although only the lower and linear part of the kinetics of Cd absorption was examined in this study.
Transport and Distribution into Shoot Organs via Xylem
It was shown that Cd was absorbed by the roots, loaded into the xylem, and transported toward the shoot within several minutes after feeding to the culture solution (Fig. 4A, ROI A). This result suggested that the time required for radial transport of Cd including xylem loading in the root tissue is less than 10 min in rice.
In the shoot, it was shown that the shoot base is the dominant site where Cd accumulates at the vegetative stage (Fig. 3B), and the accumulation is coupled with absorption by the roots (Fig. 4B). Equations 4 and 5 indicate that the deposition rate of Cd into the shoot base is constantly proportional to the absorption rate by the root with a time lag. In the representative case shown in Figures 3 and 4, it was estimated that 17% of Cd absorbed by the roots was constantly deposited into the shoot base after a 1.4-h time lag. There can be three transmembrane processes between the culture and the shoot base tissues: absorption to symplast and xylem loading in the root tissue, and unloading from the xylem in the shoot base. It seems that the simple proportionality above is achieved by the tandem arrangement of the transmembrane processes whose rates are dependent on the Cd concentrations in the respective tissues.
A limited amount of Cd was distributed into the leaf sheaths (Figs. 3B and 4C), and no Cd was detected in the leaf blades (Fig. 7) within 36 h after feeding. However, a larger amount of Cd may finally accumulate in the leaf organs over a longer period, because Cd in the leaf sheath kept increasing (even though very slightly) after the time-course curves from the culture solution and the shoot base reached a plateau (Fig. 4, B and C). This might imply that root tissue immersed in the culture solution acted as an ongoing source for Cd supply for the leaves.
The average velocities in the long-distance transport of Cd through the shoot at the vegetative stage and the grain-filling stage were estimated as 2.4 ± 0.3 and 5.4 ± 0.4 cm h−1, respectively. It should be noted that these velocities seem to be remarkably lower than that of the bulk flow in the xylem. The average water uptake rates were 2.0 ± 0.2 and 5.7 ± 0.7 mL h−1 for the vegetative stage and the grain-filling stage, respectively. If the bulk flow in the xylem had the same velocities as Cd transport, the total cross-sectional area of the xylem should reach about 1 cm2, which is very unlikely. Kiyomiya et al. (2001b) estimated that the velocity of transport of 13N compounds in the xylem from the shoot base to the newest leaf was 520 cm h−1 in a rice plant at the vegetative stage when 13NH4+ tracer was fed to the roots. Mori et al. (2000) and Kiyomiya et al. (2001a) reported that H215O moved in the shoot toward the leaves at velocities of 24 and 66 to 110 cm h−1, respectively, in rice plants at the vegetative stage. Compared with these substances, Cd showed 1/200th to 1/9th lower velocities in this study, although rice plants at a similar growth stage were tested. Interestingly, Tsukamoto et al. (2006) reported that the velocity of transport of 52Mn in the shoot from the shoot base was 3.6 cm h−1 in a 3-week-old manganese-deficient barley plant, which was very similar to our results with Cd. It is known that interactions take place between cationic solutes and negatively charged groups in the cell walls of the xylem vessels along the pathway from the roots to the leaves (Marschner, 1995), and organic chelating compounds including citrate affect these interactions (Senden et al., 1992). We speculated that Cd (and probably manganese as well) bound to organic compounds in the xylem flow interacts with the cell walls of the xylem vessels, and this makes the transport velocity slower than that of the bulk flow, for which the mechanism is similar to chromatography.
It should also be noted that the above quantitative estimations of transport dynamics inside living plant organs can hardly be provided by other methods than the combination of PETIS and a mathematical model. It is likely that the values of these parameters vary under different environmental conditions (e.g. higher levels of other heavy metals) or in transgenic plants with modified expression of transporters. Therefore, the model analysis using PETIS presented in this study should be a very powerful tool for elucidation of the complex transport systems in living plants.
Xylem-to-Phloem Transfer
Within 36 h after feeding, Cd reached the panicles and showed a constant accumulation at 7 h (Figs. 6 and 7), but in contrast, no Cd was detected in the leaf blades (Fig. 7). These results suggested that in the shoot at the grain-filling stage, Cd completely transferred from the xylem, the destination of which is the leaves, to the phloem, which proceeds to the sink organs including the grain. This idea also suggests that the signal in the panicles (Figs. 6 and 7) mainly represented Cd in the grain but not the husk. However, quantitative determination of this point may require other methods, such as sampling of the tissues or steam girdling for inactivation of the phloem. Figure 5 shows that Cd moved from the root into the shoot base containing the lower nodes, separated into the tillers, accumulated in each node on the upward way in the tillers, and went up with a velocity of approximately 5.4 cm h−1. This velocity was consistent with the idea that Cd went straight from the root to the panicles about 40 cm above and took about 7 h, and there was no need to go through the leaves. Therefore, the site of xylem-to-phloem transfer should be in the path in the culm, and it is very likely in the nodes that showed an intense accumulation of Cd.
We examined the functions of nodes at the vegetative stage. Figures 3 and 4D show that Cd moved from the shoot base into the crown roots in the direction to the root tips. This direction proved it was phloem transport. It is known that the shoot base of rice at the same vegetative stage contains densely packed nodes from which the crown roots originate (Itoh et al., 2005). Therefore, it was clearly demonstrated that Cd transferred from the xylem to the phloem at the nodes in the shoot base at the vegetative stage. At the beginning of the reproductive phase, the shoot apical meristem is converted into an inflorescence meristem and differentiation of floral organs occurs, and finally a few internodes just below the inflorescence elongate rapidly, which causes the emergence of the ear (Itoh et al. 2005). In this study, it should be noted that the curves from the nodes in the elongated region of a culm at the grain-filling stage (ROIs 2–4 in Fig. 5C) had a plateau and were very similar to that from the shoot base at the vegetative stage (ROI 2 in Fig. 4). The plateau may indicate prolonged retention in flow path and/or accumulation into the surrounding tissues of Cd in these nodes, which may suggest that the nodes have complex functions such as selective withdrawal of solutes from the xylem stream through the cell membrane. In contrast, the stem base in Figure 5C showed a different shape of the curve with a peak, which indicates passing of Cd. We conclude that the nodes in the culms of rice at the grain-filling stage retain the function of the xylem-to-phloem transfer of Cd since the vegetative stage and play a pivotal role in Cd transport to the grains.
Generally, the xylem-to-phloem transfer of solutes is an important process for the mineral nutrition of plants, because xylem transport is directed mainly to organs with the highest transpiration, which are usually not the sites of highest demand for mineral nutrients (Marschner, 1995). Van Bel (1984) showed that the xylem-to-phloem transfer of amino acids can take place all along the pathway in the stem in tomato (Solanum lycopersicum) plants using 14C-labeled inulin carboxylic acid as a xylem marker and amino acids (α-aminoisobutyric acid and Val). Such transfer is considered to be mediated by the transfer cells in the vascular system (Marschner, 1995). In rice, it has been reported that transfer cells are present in the nodes (Zee, 1972), which also supports our conclusions.
CONCLUSION
The processes of Cd transition from soil to the grains in rice were considered as follows: (1) absorption from the soil to the symplast of the root tissue; (2) efflux to the xylem or sequestration in the root cells; (3) xylem transport to the shoot; (4) xylem-to-phloem transfer in the nodes; (5) phloem transport to the grains; and (6) post-phloem transport and accumulation in the grains. Processes 1, 2, 4, and 6 are transmembrane transport, and it seems natural to consider that they are mediated by transporters for essential heavy metals. For instance, Nakanishi et al. (2006) showed that iron-deficient/sufficient conditions affected Cd distribution in rice plants and that the expression of OsIRT1 and OsIRT2, Fe2+ transporter genes in rice, increased Cd sensitivity in yeast, which suggests that these transporters are involved in Cd translocation in rice. Therefore, a feasible approach to generate rice cultivars with reduced Cd content in the grain is to modify the substrate specificity of such transporters. We also suggest that it may be more effective to modify multiple processes simultaneously rather than only one process, in order to avoid the loss of essential heavy metals in the grains. In this study, process 4, xylem-to-phloem transfer in the nodes, was suggested to be one of the pivotal steps in Cd translocation in rice; thus, its molecular mechanisms should be a focus for elucidation in subsequent studies.
From a methodological point of view, this study developed a new noninvasive system to monitor absorption, translocation, and accumulation of a substance in a living plant in real time and demonstrated great potential of the current approach of radiotracer imaging in plant biology. Noninvasive imaging provides observation of real-time responses of a living plant to changing environmental conditions, such as the concentration of a substance, and quantitative analyses of physiological activities, such as absorption rate and velocity of vascular transport. We are now planning to assess various environmental and genetic conditions that may alter the physiological activities in Cd absorption and translocation using PETIS and to develop a practical technique to regulate Cd movement in major crops, including rice.
MATERIALS AND METHODS
Plant Materials
Surface-sterilized rice seeds (Oryza sativa ‘Nipponbare’, a japonica cultivar) were germinated with deionized water for 1 week in the dark. The seedlings were transferred to a hydroponic culture solution containing 0.70 mm (NH4)2SO4, 0.17 mm Na2HPO4, 0.27 mm K2SO4, 0.47 mm MgSO4, 0.37 mm CaCl2, 11 mg L−1 FeC6H5O7·nH2O (Fe citrate), 0.16 μm CuSO4, 0.15 μM ZnSO4, 0.10 μm Na2MoO4, 15 μm H3BO3, and 4.6 μm MnSO4. The culture solution was renewed every week, and the pH was adjusted again to 5.5 at 2 or 3 d after solution renewal. The seedlings were grown in a growth chamber with day/night temperatures of 30°C/25°C (12/12 h). Plants at the seven- to eight-leaf stage (4 weeks after sowing) and plants 10 d after emergence of the first ear (approximately 10 week after sowing) were applied for the vegetative stage experiments and the grain-filling stage experiments, respectively.
107Cd Tracer
107Cd radioisotope was produced as follows (N.S. Ishioka, N. Suzui, S. Nakamura, and S. Fujimaki, unpublished data). A natural, 1-mm-thick silver foil was bombarded for 120 min with a 17-MeV energetic proton beam at a current of 2 μA delivered from a cyclotron at Takasaki Ion Accelerators for Advanced Radiation Application, Japan Atomic Energy Agency. The irradiated target was dissolved in 4 mL of concentrated nitric acid and 2 mL of water in a glass beaker on a heater. After adding 20 mL of warm water, hydrochloric acid with gradually increasing concentrations from 0 to 2 m was added slowly to the solution to precipitate the silver gently but completely. This gradient was made by adding 10 mL of 2 m hydrochloric acid to 30 mL of water little by little. The supernatant was filtered with a 0.22-μm filter and dried out by heating in a new glass beaker. 107Cd on the bottom of the beaker was dissolved in an appropriate volume of the culture solution containing a designed concentration of nonradioactive Cd. Finally, 50 to 100 MBq (2.8–5.6 pmol) 107Cd was fed to each test plant.
Controlling and Monitoring of the Culture Solution
Feeding of the culture solution to the test plant through the imaging experiment was controlled and monitored as described in Figure 1A. The root of a test plant was inserted into a plastic bag (2) filled with the culture solution. The solution was continuously stirred with gentle aeration in order to maintain a uniform composition. The surface level of this solution was balanced with that in the primary reservoir (5) using a siphon tube (4) and fixed a few centimeters below the bottom of the FOV for PETIS (1). The culture solution in the primary reservoir was supplied continuously from the secondary reservoir (6) using a pump (7), and excess solution overflowed back to the secondary reservoir. As a result, the surface level of the primary reservoir and the plastic bag was always maintained, which provided a constant volume of solution in the plastic bag regardless of water uptake by the plant. To measure the rate of this water uptake, the amount of solution that moved through the siphon tube was constantly monitored and recorded by an automatic balance (8).
Just before the imaging experiment, the siphon tube was closed and the culture solution in the plastic bag was removed. The same volume of culture solution containing 107Cd tracer was fed into the bag just when the PETIS imaging was started, then the siphon tube was reopened. The radioactivity of the culture solution was monitored and recorded constantly using a Positron Multi-probing System (3; Hamamatsu Photonics).
PETIS Imaging
A typical setup for the imaging experiment with PETIS is shown in Figure 1B. The two opposing detector heads of the PETIS apparatus (modified type of PPIS-4800; Hamamatsu Photonics) were set 20 cm apart from one another, and the test plant was placed at the mid plane between them. Serial images of the distribution of the tracer in the plant were generated by the following mechanism. A positron emitted from a tracer immediately undergoes annihilation by collision with an electron of an adjacent atom in the plant tissue. A pair of γ-rays is emitted in opposite directions from that point. The detector heads, which are composed of arrays of scintillators and photomultipliers, detect the pair of annihilation γ-rays at the same moment. Then the emission point is determined as the middle point of the two incident points. Repeated determination of the emission points reconstructs a static image of the tracer distribution. The unit of time to obtain one static image with sufficient quality is called a “frame,” and a course of imaging experiment consists of hundreds of frames to yield one serial time-course image (for more details, see Uchida et al., 2003). In this study, one frame was set to 4 min, and 360 (24 h) or 540 (36 h) frames were collected in each experiment. The typical size of the FOV was 12 cm in width and 19 cm in height, and the pixel size of the obtained image was 1.1 mm2. The entire setup was installed in a growth chamber, and the conditions inside were controlled to 30°C, 65% humidity, and continuous light throughout the imaging experiments.
Analyses of PETIS Data
The data of serial images were transferred from the PETIS apparatus to a personal computer for analyses using NIH Image J 1.42 software (http://rsb.info.nih.gov/ij/). Using this software, ROIs were selected manually on the image data and the time-activity curves (time courses of signal intensity in the ROIs) were generated. Data plotting and fitting analysis of the time-activity curves were performed using Gnuplot version 4.0 software (http://www.gnuplot.info/).
Quantitative Determination and Decay Correction
In the feeding experiments, the indicated amounts of nonradioactive Cd were mixed with measured activities of pure 107Cd at a certain time before feeding to the plants. Therefore, the amount of total Cd (i.e. sum of radioactive and nonradioactive Cd) corresponding to the radioactivity of 107Cd at a given time can be easily determined. All the graphs and PETIS images shown in this paper indicate the determined amounts of total Cd, not just the intensities of 107Cd signal.
Autoradiography
The aerial region of the test plant was dissected and placed on paper sheets after the PETIS imaging was finished and then placed in contact with imaging plates (Fujifilm) in cassettes. After overnight or a few days of exposure, the imaging plates were scanned using a Bio Imaging Analyzer (BAS-1500; Fujifilm) to generate the autoradiographic images.
Supplemental Data
The following materials are available in the online version of this article.
Supplemental Video S1. Video file of Figure 3B.
Supplemental Video S2. Video file of Figure 5B.
Supplementary Material
Acknowledgments
We gratefully thank Mr. H. Suto (Tokyo Nuclear Services Co., Ltd.) for his technical assistance in irradiation for 107Cd production, Dr. H. Hayashi, formerly of the University of Tokyo, for the setup for this scientific project, and Dr. S. Mori (University of Tokyo), Dr. N.K. Nishizawa (University of Tokyo), and Dr. H. Nakanishi (University of Tokyo) for their kind support for the PETIS apparatus.
References
- Clemens S, Palmgren MG, Krämer U. (2002) A long way ahead: understanding and engineering plant metal accumulation. Trends Plant Sci 7: 309–315 [DOI] [PubMed] [Google Scholar]
- Fujimaki S. (2007) The positron emitting tracer imaging system (PETIS), a most-advanced imaging tool for plant physiology. ITE Lett Batteries New Technol Med 8: 404–413 [Google Scholar]
- Fujimaki S, Ishii S, Ishioka NS. (2010) Non-invasive imaging and analyses of transport of nitrogen nutrition in intact plants using a positron-emitting tracer imaging system (PETIS). Ohyama T, Sueyoshi K, , Nitrogen Assimilation in Plants. Research Signpost, Kerala, India: (in press) [Google Scholar]
- Harris NS, Taylor GJ. (2004) Cadmium uptake and translocation in seedlings of near isogenic lines of durum wheat that differ in grain cadmium accumulation. BMC Plant Biol 4: 4. [DOI] [PMC free article] [PubMed] [Google Scholar]
- Hart JJ, Welch RM, Norvell WA, Sullivan LA, Kochian LV. (1998) Characterization of cadmium binding, uptake, and translocation in intact seedlings of bread and durum wheat cultivars. Plant Physiol 116: 1413–1420 [DOI] [PMC free article] [PubMed] [Google Scholar]
- Homma Y, Hirata H. (1984) Kinetics of cadmium and zinc absorption by rice seedling roots. Soil Sci Plant Nutr 30: 527–532 [Google Scholar]
- Ishimaru Y, Kim S, Tsukamoto T, Oki H, Kobayashi T, Watanabe S, Matsuhashi S, Takahashi M, Nakanishi H, Mori S, et al. (2007) Mutational reconstructed ferric chelate reductase confers enhanced tolerance in rice to iron deficiency in calcareous soil. Proc Natl Acad Sci USA 104: 7373–7378 [DOI] [PMC free article] [PubMed] [Google Scholar]
- Ishimaru Y, Suzuki M, Tsukamoto T, Suzuki K, Nakazono M, Kobayashi T, Wada Y, Watanabe S, Matsuhashi S, Takahashi M, et al. (2006) Rice plants take up iron as an Fe3+-phytosiderophore and as Fe2+. Plant J 45: 335–346 [DOI] [PubMed] [Google Scholar]
- Itoh J, Nonomura K, Ikeda K, Yamaki S, Inukai Y, Yamagishi H, Kitano H, Nagato Y. (2005) Rice plant development: from zygote to spikelet. Plant Cell Physiol 46: 23–47 [DOI] [PubMed] [Google Scholar]
- Kawachi N, Sakamoto K, Ishii S, Fujimaki S, Suzui N, Ishioka NS, Matsuhashi S. (2006) Kinetic analysis of carbon-11-labeled carbon dioxide for studying photosynthesis in a leaf using positron emitting tracer imaging system. IEEE Trans Nucl Sci 53: 2991–2997 [Google Scholar]
- Kiyomiya S, Nakanishi H, Uchida H, Nishiyama S, Tsukada H, Ishioka NS, Watanabe S, Osa A, Mizuniwa C, Ito T, et al. (2001a) Light activates H215O flow in rice: detailed monitoring using a positron-emitting tracer imaging system (PETIS). Physiol Plant 113: 359–367 [DOI] [PubMed] [Google Scholar]
- Kiyomiya S, Nakanishi H, Uchida H, Tsuji A, Nishiyama S, Futatsubashi M, Tsukada H, Ishioka NS, Watanabe S, Ito T, et al. (2001b) Real time visualization of 13N-translocation in rice under different environmental conditions using positron emitting tracer imaging system. Plant Physiol 125: 1743–1753 [DOI] [PMC free article] [PubMed] [Google Scholar]
- Kukier U, Chaney RL. (2002) Growing rice grain with controlled cadmium concentrations. J Plant Nutr 25: 1793–1820 [Google Scholar]
- Marschner H. (1995) Mineral Nutrition of Higher Plants, Ed 2 Academic Press, New York, pp 79–115 [Google Scholar]
- Matsuhashi S, Fujimaki S, Kawachi N, Sakamoto K, Ishioka NS, Kume T. (2005) Quantitative modeling of photoassimilate flow in an intact plant using the positron emitting tracer imaging system (PETIS). Soil Sci Plant Nutr 51: 417–423 [Google Scholar]
- Mori S, Kiyomiya S, Nakanishi H, Ishioka NS, Watanabe S, Osa A, Matsuhashi S, Hashimoto S, Sekine T, Uchida H, et al. (2000) Visualization of 15O-water flow in tomato and rice in the light and dark using a positron-emitting tracer imaging system (PETIS). Soil Sci Plant Nutr 46: 975–979 [Google Scholar]
- Nakanishi H, Ogawa I, Ishimaru Y, Mori S, Nishizawa NK. (2006) Iron deficiency enhances cadmium uptake and translocation mediated by the Fe2+ transporters OsIRT1 and OsIRT2 in rice. Soil Sci Plant Nutr 52: 464–469 [Google Scholar]
- Page V, Feller U. (2005) Selective transport of zinc, manganese, nickel, cobalt and cadmium in the root system and transfer to the leaves in young wheat plants. Ann Bot (Lond) 96: 425–434 [DOI] [PMC free article] [PubMed] [Google Scholar]
- Riesen O, Feller U. (2005) Redistribution of nickel, cobalt, manganese, zinc, and cadmium via the phloem in young and maturing wheat. J Plant Nutr 28: 421–430 [Google Scholar]
- Senden MHMN, van Paassen FJM, van der Meer AJGM, Wolterbeek HT. (1992) Cadmium-citric acid-xylem cell wall interactions in tomato plants. Plant Cell Environ 15: 71–79 [Google Scholar]
- Suzuki M, Takahashi M, Tsukamoto T, Watanabe S, Matsuhashi S, Yazaki J, Kishimoto N, Kikuchi S, Nakanishi H, Mori S, et al. (2006) Biosynthesis and secretion of mugineic acid family phytosiderophores in zinc-deficient barley. Plant J 48: 85–97 [DOI] [PubMed] [Google Scholar]
- Tanaka K, Fujimaki S, Fujiwara T, Yoneyama T, Hayashi H. (2003) Cadmium concentrations in the phloem sap of rice plants (Oryza sativa L.) treated with a nutrient solution containing cadmium. Soil Sci Plant Nutr 49: 311–313 [Google Scholar]
- Tanaka K, Fujimaki S, Fujiwara T, Yoneyama T, Hayashi H. (2007) Quantitative estimation of the contribution of phloem in cadmium transport to the grains in rice plants (Oryza sativa L.). Soil Sci Plant Nutr 53: 72–77 [Google Scholar]
- Tsukamoto T, Nakanishi H, Kiyomiya S, Watanabe S, Matsuhashi S, Nishizawa NK, Mori S. (2006) 52Mn translocation in barley monitored using a positron-emitting tracer imaging system. Soil Sci Plant Nutr 52: 717–725 [Google Scholar]
- Tsukamoto T, Nakanishi H, Uchida H, Watanabe S, Matsuhashi S, Mori S, Nishizawa NK. (2009) 52Fe translocation in barley as monitored by a positron-emitting tracer imaging system (PETIS): evidence for the direct translocation of Fe from roots to young leaves via phloem. Plant Cell Physiol 50: 48–57 [DOI] [PMC free article] [PubMed] [Google Scholar]
- Uchida H, Okamoto T, Ohmura T, Shimizu K, Satoh N, Koike T, Yamashita T. (2003) A compact planar positron imaging system. Nucl Instrum Methods Phys Res Sect A 516: 564–574 [Google Scholar]
- United Nations Environment Programme (2008) Draft Final Review of Scientific Information on Cadmium, Version of November 2008. http://www.chem.unep.ch/pb_and_cd/SR/Draft_final_reviews_Nov2008.htm (August 4, 2009)
- Uraguchi S, Mori S, Kuramata M, Kawasaki A, Arao T, Ishikawa S. (2009) Root-to-shoot Cd translocation via the xylem is the major process determining shoot and grain cadmium accumulation in rice. J Exp Bot 60: 2677–2688 [DOI] [PMC free article] [PubMed] [Google Scholar]
- Van Bel AJE. (1984) Quantification of the xylem-to-phloem transfer of amino acids by use of inulin [14C]carboxylic acid as xylem transport marker. Plant Sci Lett 35: 81–85 [Google Scholar]
- Welch RM, Hart JJ, Norvell WA, Sullivan LA, Kochian LV. (1999) Effects of nutrient solution zinc activity on net uptake, translocation, and root export of cadmium and zinc by separated sections of intact durum wheat (Triticum turgidum L. var durum) seedling roots. Plant Soil 208: 243–250 [Google Scholar]
- Zee S-Y. (1972) Transfer cells and vascular tissue distribution in the vegetative nodes of rice. Aust J Bot 20: 41–48 [Google Scholar]
Associated Data
This section collects any data citations, data availability statements, or supplementary materials included in this article.