

Abstract
Neutron spin-echo (NSE) spectroscopy was used to study structural fluctuations that occur in hemoglobin (Hb) and myoglobin (Mb) in solution. Using NSE data to very high momentum transfer, q (~ 0.62 Å-1), the internal dynamics of these proteins were characterized at the level of the dynamical pair correlation function and self-correlation function in the time range of several picoseconds to a few nanoseconds. In the same protein solution the data transitions from pair correlation to self correlation motion as the momentum transfer, q, increases. At low q, coherent scattering dominates; at high q, observations are largely due to incoherent scattering. The low q data were interpreted in terms of the effective diffusion coefficient; the high q, in terms of mean square displacements. Comparison of data from the two homologous proteins collected at different temperatures and protein concentrations was used to assess the contributions to the data made by translational and rotational diffusion and internal modes of motion. The temperature dependence of the decay times can be attributed to changes in viscosity and temperature of the solvent as predicted by the Stokes-Einstein relationship. This is true for contributions from both diffusive and internal modes of motion indicating an intimate relationship between the internal dynamics of the proteins and the viscosity of the solvent. Viscosity change associated with protein concentration can account for changes in diffusion observed at different concentrations, but is apparently not the only factor involved in the changes in internal dynamics observed with change in protein concentration. Data collected at high q indicate that internal modes in Mb are generally faster than in Hb, perhaps due to the greater surface to volume ratio of Mb and the fact that surface groups tend to exhibit faster motion than buried groups. Comparison of data from Hb and Mb at low q indicates an unexpectedly rapid motion of the hemoglobin αβ-dimers relative to one another. Dynamic motion of subunits is increasingly perceived as important to the allosteric behavior of hemoglobin. Our data demonstrate that this motion is highly sensitive to protein concentration, temperature and solvent viscosity, indicating that great care need be exercised in interpreting its effect on protein function.
Introduction
Hemoglobin (Hb) is the prototypical allosteric protein, the behavior of which has been extensively studied, documented and described in thousands of papers and featured in essentially every modern biochemistry text. Hb is made of four subunits, two α and two β, each structurally similar to myoglobin (Mb). In switching from the oxy- to deoxy-states, the two αβ dimers of Hb rotate approximately 15° relative to one. The canonical description of the quaternary structural changes that Hb undergoes in support of its cooperative binding of oxygen derives from crystallographic studies of the oxy (R-state) and deoxy (T-state) structures1. The discovery of additional quaternary structures of the liganded state2 has raised questions about the details of this canonical model. NMR studies3 have indicated that the structure of the liganded protein in solution is intermediate between the R-state and a second crystallographically defined R2-state2. These findings have triggered a re-thinking of the structure, dynamics and conformational changes of Hb and how they relate to function4.
Recent WAXS studies5 have revealed that Hb undergoes concentration-dependent structural fluctuations that rapidly increase in amplitude as protein concentration is reduced below about 50 mg/ml (0.8 mM). The concentration dependence was interpreted as being due to macromolecular crowding – damping of fluctuations at higher concentrations. The nature of the concentration dependent intensity changes indicates that they are due to slow coordinated motions of rigid bodies. Because Mb exhibits similar behavior, the rigid bodies were hypothesized to be α-helices. This is consistent with observations from molecular dynamics calculations on Mb that the α-helices undergo displacements as nearly rigid bodies within the protein6,7. The WAXS data indicate that in Hb at 5 mg/ml interatomic vectors of ~10 Å length fluctuate by +/- 1.2 Ǻ. Because the fluctuations are cumulative, interatomic vectors of ~60 Ǻ length may exhibit fluctuations of +/- 7.2 Ǻ – approximately the magnitude of structural motion seen in the R- to T-state transition. This supports the assertion that at low concentration, Hb is exhibiting fluctuations in which it explores multiple quaternary states. Although the original observations were carried out on bovine met-Hb5, more recent work on human CO-Hb has revealed analogous behavior with amplitudes less than those observed for met-Hb (in preparation). WAXS data provide information about the spatial scale of these fluctuations, but provide no information about the time scale on which they take place. The NSE data reported here provide the complementary time-scale information about these fluctuations.
Dynamic properties of proteins in solution have been increasingly tied to protein function8. The fluctuation-dissipation theorem9 dictates a quantitative relationship between the fluctuations of a thermodynamic system at equilibrium and its response to external driving force (as might be provided by a functional interaction). Consistent with this relationship, intramolecular motions driven by thermal fluctuations appear to mimic conformational changes that are required for function of the protein. For instance, the conformations of the flap regions of ligand-free adenylate kinase appear to move through low energy pathways that include conformations adopted in response to binding of ligand10,11. Normal mode analysis of the fluctuations of Hb in the unliganded state define a free energy pathway that stretches towards conformations close to those expected in the liganded form12. These observations indicate that detailed studies of the structural fluctuations of proteins in solution will provide substantial insight into the motions that proteins undergo during function.
There are relatively few biophysical techniques that can provide insight into the slow correlated motions that most proteins undergo during function. NMR provides information about the motions of individual groups on fast time scales (e.g. picosecond)13 and residual dipolar coupling provides some information about the coordinated slow motions that are often involved in functional activities14. Crystallography provides information about the flexibility of groups not involved in crystal contacts15. Wide-angle x-ray solution scattering (WAXS) can be used to characterize the breadth of the ensemble of structures that a protein takes on in solution5. Computational studies using molecular dynamics (MD) can provide insight into motions that occur on the relatively fast timescales accessible to MD and normal mode analysis (NMA) provides insight into modes of motion that may be involved in protein function16. Although these techniques provide substantial information about protein motions in solution, no technique is comprehensive, and new approaches are badly needed in order to gain further insight into these motions.
Neutron spin-echo spectroscopy17 is an underutilized probe of protein dynamics sensitive to slow correlated motions (including translational and rotational diffusion and internal modes) on the picosecond to nanosecond time scale. NSE provides information about the time evolution of structural correlations analogous to dynamic light scattering but at time and length scales more relevant to protein internal modes18. At relatively small q, the NSE signal is dominated by coherent scattering and one measures the intermediate scattering function Sij (q,t), which records the correlations of density fluctuations due to relative displacements ri-rj.
| (1) |
where q is the momentum transfer, t denotes the time shift and i and j run over all atoms.
At larger q, the signal is dominated by incoherent scattering by protons (within the protein, since solvent is 100% D2O) and one measures the self correlation function,
| (2) |
Assuming that the atomic displacement distribution functions are Gaussian, equation 2 becomes19,20,
| (3) |
where <ri2(t) > is the mean square displacement of atom “i”.
From the intermediate scattering function one can extract a generalized time- and wavevector-dependent diffusion coefficient which corresponds to collective motion21. The relaxation rate, Γ(q) is given by
| (4) |
and the effective diffusion constant, Deff(q), and correlation time, τ, are obtained by
| (5) |
The effective diffusion constant is thereby a measure of the decay rate of structural features with length scales corresponding to 2π/q. Deff has contributions from translational and rotational diffusion - both of which can be affected by inter-particle interactions – as well as from internal modes of motion. In the limit of infinitely dilute solution, the effective diffusion coefficient, Deff(q) becomes D°eff(q), the single particle effective diffusion constant. At experimentally approachable concentrations, inter-particle interactions become important and collective diffusion is a factor. The structural and hydrodynamic interactions are related by22
| (6) |
where, H(q) is the hydrodynamic function23; S(q) is the structure factor. According to the Stokes-Einstein relation, D°eff(q) = kT/6πηR, for a rigid, spherical particle of hydrodynamic radius R. However, for a protein, D°eff(q) will have contributions from translational and rotational diffusion as well as internal modes of motion. Interpretation of D°eff(q) in terms of these contributions is a substantial challenge and, as shown in equation (6), determination of D°eff(q) depends on measurement of Deff(q), H(q), and S(q).
Deff(q) is measurable from NSE, as indicated by equation (5). S(q) is measurable from SANS or SAXS. H(q), however, is difficult to estimate22,23. It has a q-dependence similar to S(q) and leads to an overall constant downshift of the high q data21. For some systems, at q > 0.06 Å-1 any oscillations in H(q) are below 1% and can be safely ignored21. Doster and Longeville24 use the relationship, (6), to estimate H(q) – which appears roughly proportional to S(q) as a function of q. For the range of q examined in this study, H(q) appears to be nearly constant and can be safely dropped from equation (6), leaving, to a very good approximation,
| (7) |
There remains the challenge of separating the contributions of rotational and translational diffusion and internal modes from the values of D°eff(q) obtained from (7). One approach is to calculate from atomic coordinates the contributions of rotational and translational diffusion to D°eff(q)18,21 and assume that what remains is due to internal modes. This has been done with some success for taq polymerase18 and alcohol dehydrogenase21. These calculations require the calculation of hydrodynamic properties, in particular, the generalized 6×6 diffusion coefficient matrix which can be obtained from atomic coordinates using the program HYDROPRO25. This calculation involves the adjustment of a free parameter that is different for each protein25. While the use of the diffusion coefficient matrix for calculation of D°eff(q) appears straightforward18,21, the calculation, as currently used, ignores details of the hydration layer of proteins and results in predictions that must be adjusted to fit the observed values of the translational and rotational diffusion constants. Ignoring the hydration layer can lead to substantial errors, even in calculation of SAXS or WAXS data from atomic coordinates26,27. Using this approach - while cognizant of its limitations - leads to an estimate of D°eff(q) for Hb and Mb that indicates rotational diffusion may contribute to variations in the value of D°eff(q) as a function of q by up to 25%. Although Doster and Longeville22 assert that since Hb is “almost spherical and the molecular scattering density distribution is homogeneous at the low q-values, translational and not rotational displacements dominate the scattering function,” we believe that at larger q > 0.2 Å-1, rotational diffusion may well contribute to our data (see Figure 11 and associated discussion).
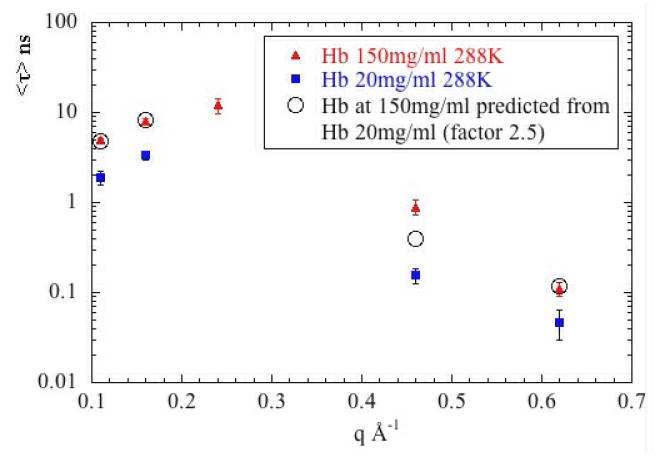
Figure 11.
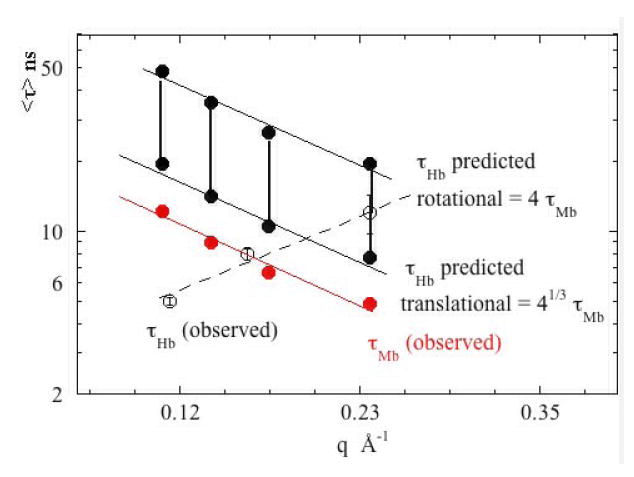
Hemoglobin does not behave like a larger version of myoglobin. τ is plotted as a function of q for Hb (open circles) and Mb (solid red circles) and compared to that predicted from the Mb data (solid black circles) by scaling according to protein size assuming pure translation (lower set of predictions) and pure rotational motions (upper set of predictions). At q = 0.24 Å-1the Hb data is consistent with the predictions assuming a combination of rotational and translational motion. At lower q, the observed motions of Hb are inconsistent with those predicted on the basis of the behavior of Mb.
Given the challenges involved in separating the various contributions to D°eff(q), we have chosen a different approach. Here, we carry out a set of NSE measurements on two homologous proteins (Mb and Hb) at different temperatures and protein concentrations, and analyze the differences in D°eff(q) among these measurements in terms of the behaviors expected for translational and rotational diffusion and internal modes of motion. In this way we are able to extract from our observations insights into the motions contributing to those data. In particular, we expect observations dominated by translational diffusion to behave approximately as Dt = kT/6πηR. As diagrammed in Figure 1, Hb is composed of 4 subunits, each of which is highly homologous to the Mb molecule and Rhb ~ 41/3 Rmb. Therefore, for comparisons of Hb with Mb, we expect Dthb/Dtmb = 4-1/3. Rotational diffusion scales as Dr = kT/8πηR3, and we would expect Drhb/Drmb ~ 1/4. Data that cannot be explained on the basis of these scaling arguments may be dominated by the effect of internal modes of motion. We use similar scaling arguments to analyze the effect of temperature, viscosity, and protein concentration on the dynamic behavior of the proteins.
Figure 1.
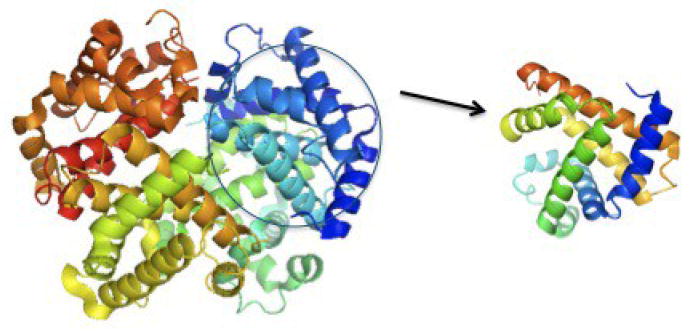
Rendering of Hb tetramer and monomeric Mb. Hb is composed of four subunits – two α–subunits and two β–subunits; each highly homologous to Mb.
Results
WAXS
Examination of the WAXS scattering from Hb and Mb provides a useful context in which to interpret the NSE data. In the range of coherent scatter, NSE data taken at a momentum transfer of q probes the dynamics of structural elements (interatomic vectors) of a size corresponding to roughly 2π/q. Typically, the dynamics of structural elements are highly dependent on the degree of structural correlation that exists in that size range and WAXS provides a measure of that correlation. Figure 2 displays WAXS data taken from both Hb and Mb (bovine met-Hb and equine horse heart skeletal muscle Mb) using methods described previously5. The overall distribution of intensity in the two patterns is very similar. Since Hb is roughly 4 times the volume and mass of Mb, the WAXS pattern from Hb contains higher frequency terms. This is most obvious at the position of the peak at 0.1875 Å-1 which is present in Hb but not Mb. This peak corresponds to interatomic vectors ~33 Å in length, roughly the center-to-center distance between subunits in the Hb tetramer – features absent in Mb. The peak at 0.64 Å-1 corresponds to interatomic vectors ~10 Å in length and is present in essentially all proteins with a large α-helical content because α-helices pack with a center-to-center distance of about 10 Å. From these data at concentrations of 150 mg/ml and 50 mg/ml, estimates for the structure factor, S(q), were calculated, and are shown in Figure 3. At concentrations below 50 mg/ml, the form factors of Hb and Mb change due to a broadening of their structural ensembles5, making that data worthless for the estimation of S(q). The structure factors in Figure 3 were used to estimate D°eff from Deff using equation (6).
Figure 2.
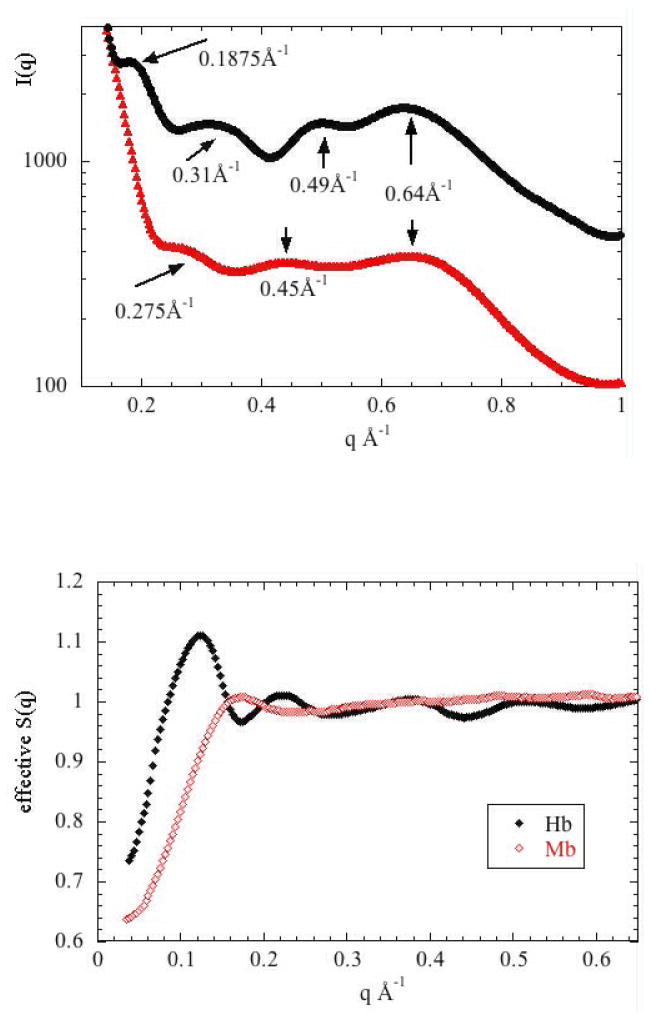
WAXS I(q) for 150mg/ml Hb and Mb in PBS buffer at 278K. Intensity is on an arbitrary scale and has been shifted to allow visual comparison of the two scattering patterns.
Figure 3.
Effective S(q) for 150 mg/ml of Hb and Mb (calculated as I(q; 150 mg/ml)/I(q; 50 mg/ml).
NSE data
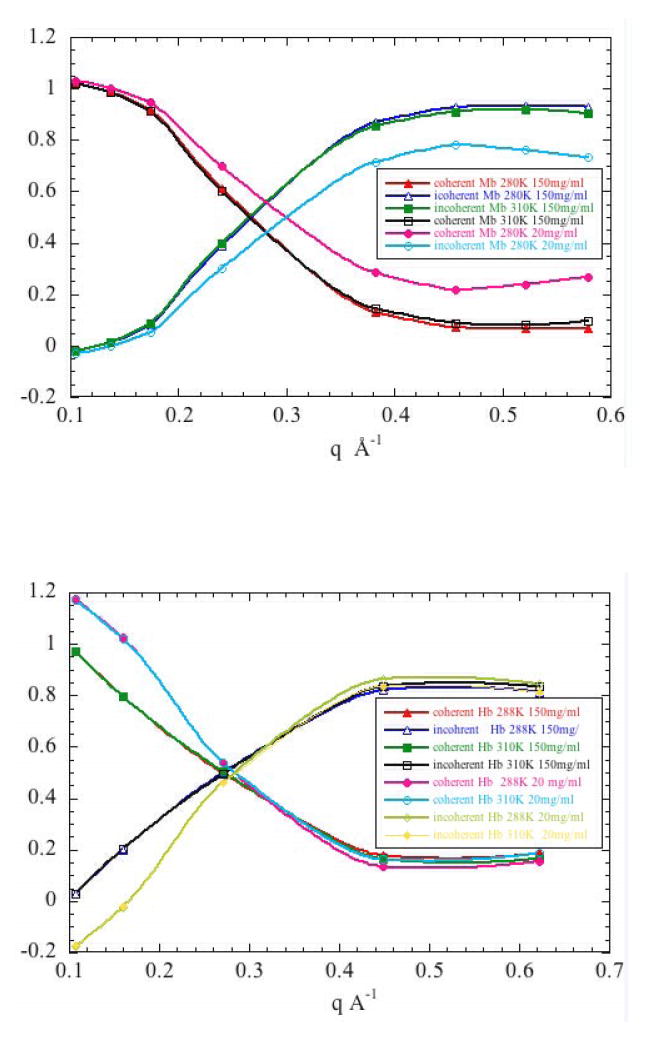
The NSE experiments carried out here provide measurements of the dynamical structure factor Si,j(q,t)/Si,j(q,0) out to t ~ 2 nsec. Data from Hb and Mb were collected over a range of q from 0.1 to 0.6 Å-1. Data were collected at two protein concentrations (20 mg/ ml and 150 mg/ml) and two temperatures (288°K and 310°K). A polarization analysis was carried out at the beginning of data collection for all NSE spectra to determine the polarization and average signal for each detector. The detectors were grouped together with the same grouping as used for the spectra and the fraction of coherent and incoherent scattering as derived from the polarization analysis are plotted for Mb and Hb in Figures 4a and 4b respectively. At low q the signal is largely coherent; at high q the signal arises from mainly incoherent scattering. The transition point is at q ~ 0.26 Å-1.
Figure 4.
Fraction of coherent and incoherent scattering as derived from polarization analyses are plotted for (a) Mb and (b) Hb. The polarization analysis was carried out at the beginning of all NSE spectra to determine both polarization and average signal for each detector. The detectors were grouped together with the same grouping as used for the collecting spectra (analysis of relaxation time).
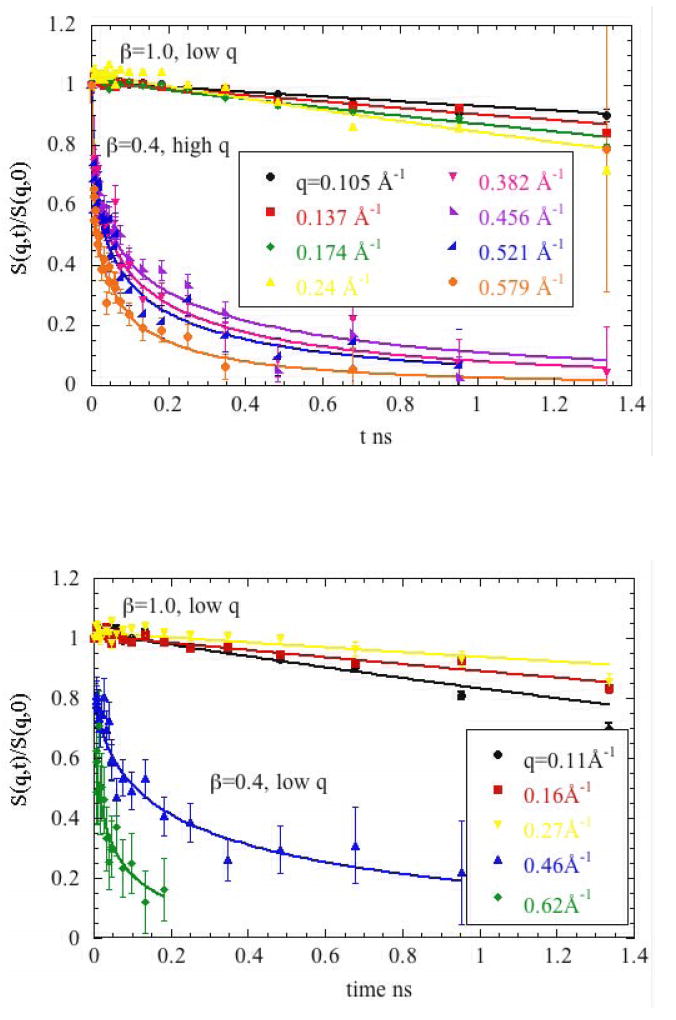
Figure 5 includes representative plots of Si,j(q,t)/Si,j(q,0) for Mb (Figure 5a) and Hb (Figure 5b) measured at different q’s. The data segregate into two classes that correspond to the degree of coherence in the scattering and clearly exhibit distinctive behaviors. The low q data exhibit relatively slow decay times and can be characterized in terms of a single exponential decay. At higher q > 0.26 Å-1 the coherent scattering contributes only modestly to the signal (8-15%) and was analyzed as though due entirely to incoherent scattering. This data was not consistent with a single exponential decay, but fit well to a ’stretched exponential function’ without an elastic background level. At these scattering angles, any coherent dynamics in our time window would lead to an upwards motion of the S(q,t) curve, but this is not observed after D2O subtraction, consistent with our decision to ignore the coherent fraction of the data at these q values.
Figure 5.
Normalized intermediate scattering functions S(q,t)/S(q,0) of (a) Mb and (b) Hb in D2O measured with the neutron spin-echo spectrometer IN11c (Institut Laue-Langevin in Grenoble) at several wave-vectors q for concentration of 150mg/ml and temperature 288K. Solid Lines indicate fits of the data to a single exponential (low q regime) and stretched exponential decay function (high q regime).
Analysis of Data in the Small q Regime
The data collected at q < 0.26Å-1 are accurately fit using a single exponential, where
| (8) |
Correlation times, τ = 1/Γ, are tabulated in Tables I and II.
Table I.
Dynamic parameters derived from fitting of S(q,t)/S(q,0) plots (such as those in Figure 5a and b) for NSE data from Mb at 150 mg/ml (288°K and 310°K) and 20 mg/ml (288oK). Characteristic time τKWW(ns) and exponential stretch parameter, β, are derived from fitting the data to the stretched exponential of equation (2), exp(-t/τKWW(q))β(q). The characteristic time is named for early users of the stretched exponential (Kohlrausch–William–Watts). The average relaxation time, < τ >= (τkww/β)Γ(1/β), [where in this case Γ(1/β) is the Gamma function] is equal to the single exponential function for the case of β=1.
| Mb | 150mg/ml | 20mg/ml | ||||||||
|---|---|---|---|---|---|---|---|---|---|---|
| 288K | 310K | 288K | ||||||||
| q Å-1 | β | A | τKWW (ns) | < τ > (ns) | A | τKWW (ns) | < τ > (ns) | A | τKWW (ns) | < τ > (ns) |
| 0.105 | 1.0 | 1.0100 | 12.148±0.99 | 12.148±0.99 | 1.0103 | 7.0061±0.33 | 7.0061±0.33 | 0.99978 | 7.5325±0.81 | 7.5325±0.81 |
| 0.137 | 1.0 | 1.0110 | 8.8813±0.36 | 8.8813±0.36 | 1.0096 | 5.0475±0.12 | 5.0475±0.12 | 0.99922 | 7.6048±0.64 | 7.6048±0.64 |
| 0.174 | 1.0 | 1.0132 | 6.6254±0.19 | 6.6254±0.19 | 1.0154 | 3.5693±0.06 | 3.5693±0.06 | 0.99638 | 4.6941±0.32 | 4.6941±0.32 |
| 0.240 | 1.0 | 1.0369 | 4.8692±0.17 | 4.8692±0.17 | 1.0376 | 2.2920±0.05 | 2.2920±0.05 | 0.97506 | 2.7422±0.27 | 2.7422±0.27 |
| 0.382 | 0.4 | 1.0063 | 0.11282±0.01 | 0.37494±0.03 | 1.0248 | 0.09742±0.01 | 0.32373±0.03 | - | - | - |
| 0.456 | 0.4 | 0.98814 | 0.14758±0.01 | 0.49046±0.03 | 1.0127 | 0.08557±0.007 | 0.28436±0.023 | 1.0257 | 0.0274±0.07 | 0.09108±0.23 |
| 0.521 | 0.4 | 0.99916 | 0.09129±0.01 | 0.30338±0.03 | 1.0099 | 0.05868±0.007 | 0.19500±0.023 | - | - | - |
| 0.579 | 0.4 | 0.99661 | 0.03939±0.003 | 0.13090±0.010 | 1.0063 | 0.02598±0.002 | 0.08635±0.007 | - | - | - |
Characteristic time τKWW(ns). Average Relaxation Time < τ >=τkww/β Γ(1/ β). Amplitude Factors A. Stretch parameter β.
Table II.
Dynamic parameters for Hb derived in the same way as data in Table I.
| Hb | 150mg/ml | 20mg/ml | |||||||||||
|---|---|---|---|---|---|---|---|---|---|---|---|---|---|
| 288K | 310K | 288K | 310K | ||||||||||
| q Å-1 | β | A | τKWW(ns) | < τ >(ns) | A | τKWW(ns) | < τ >(ns) | A | τKWW(ns) | < τ >(ns) | A | τKWW(ns) | < τ >(ns) |
| 0.11 | 1.0 | 1.0179 | 4.9815±0.20 | 4.9815±0.20 | 1.0163 | 4.6954±0.19 | 4.6954±0.19 | 0.9932 | 1.9195±0.34 | 1.9195±0.34 | 0.9952 | 2.1213±0.41 | 2.1213±0.41 |
| 0.16 | 1.0 | 1.0095 | 7.9516±0.46 | 7.9516±0.46 | 1.0098 | 5.0314±0.22 | 5.0314±0.22 | 0.9749 | 3.3247±0.34 | 3.3247±0.34 | 0.9679 | 2.3607±0.17 | 2.3607±0.17 |
| 0.24 | 1.0 | 1.0186 | 11.968±2.20 | 11.968±2.20 | 1.0275 | 4.7244±0.44 | 4.7244±0.44 | - | - | - | 0.9962 | 2.9951±0.29 | 2.9951±0.29 |
| 0.46 | 0.4 | 1.0043 | 0.2688±0.05 | 0.8932±0.17 | 1.0351 | 0.1599±0.03 | 0.5314±0.10 | 1.0087 | 0.0472±0.01 | 0.1568±0.03 | - | - | - |
| 0.62 | 0.4 | 1.0004 | 0.0331±0.007 | 0.1099±0.02 | 1.0188 | 0.0113±0.004 | 0.0375±0.013 | 1.0044 | 0.0140±0.005 | 0.0465±0.017 | 1.0042 | 0.0139±0.006 | 0.0463±0.019 |
Characteristic time τKWW(ns). Average Relaxation Time < τ >=τkww/β Γ(1/ β). Amplitude Factors A. Stretch parameter β.
Comparable NSE data in the small q regime have been reported for Mb28 and Hb24. Our measurements on Mb correspond closely to those reported previously28. Our data on Hb are, for the most part, taken at higher q values than reported by Doster and Longeville (2007)24 and at much lower protein concentrations. Furthermore, we measured data from met-Hb, whereas they used oxy-Hb. In the region where there is overlap in q between the data reported here and that reported previously24, our data reflect significantly faster relaxation phenomena. We believe this is due to a combination of two factors: structural fluctuations in Hb are highly sensitive to protein concentration5; and liganded Hb appears to exhibit substantially lower amplitude fluctuations than met-Hb (in preparation). Our data from met-Hb do not follow the patterns established in the Mb data and suggest that Hb is moving quite differently from Mb in these samples. This is most apparent when τ is plotted as a function of q as in Figure 6. Mb behaves as expected for a relatively rigid, freely diffusing quasi-spherical particle with τ decreasing as a function of q in the range of 0.1 < q <0.25 Å-1 (Figure 6a). If Hb behaved analogously, we would expect to see a pattern similar to that of Mb, but shifted to a higher τ (slower) by a factor of 41/3 due to the larger size of Hb. However, in the same range, τ for Hb actually increases as a function of q. Both rotational diffusion and internal modes appear to contribute to this anomalous behavior.
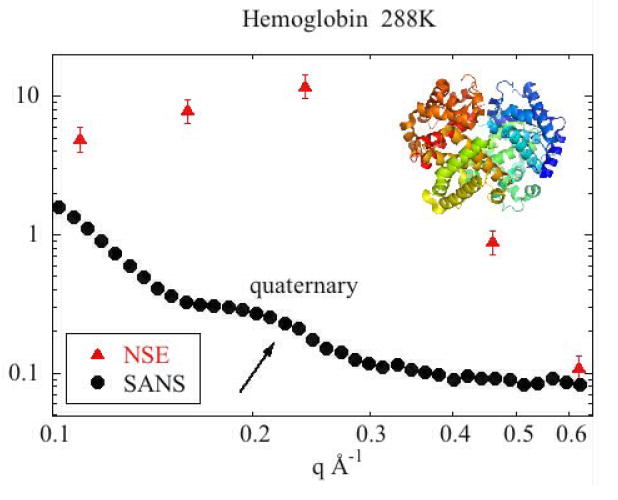
Figure 6.
Relaxation times, <τ>, in nanoseconds (red) and small angle neutron scattering (SANS) intensities, I(q) (black) for (a) Mb and (b) Hb.
In Figure 6, these data are superimposed on SANS data from the two proteins to provide a context in which to consider these observations. In the Hb data (Figure 6b), the very large τ at 0.24 Å-1 coincides with a peak in the SANS data known to be due to the quaternary structure of Hb, arising largely to inter-atomic vectors between different domains. Translational motion alone cannot account for its value. However, we will show that this value can be interpreted as arising from a combination of translational and rotational diffusion and falls within the range expected on the basis of these motions (see below).
Analysis of Data in the Large q Regime
At large q, (> 0.26 Å-1), the data derive largely from incoherent scatter. In this range, Sii(q,t) cannot be accurately fit with a single exponential decay function. They do, however, fit well to a ‘stretched’ exponential29,30 of the form:
| (9) |
as shown in Figures 5a and 5b. Analysis of predicted quasi-elastic neutron scattering data from MD simulations30 indicates that the stretch factor β(q) reaches a constant value for large q in the range of 0.2-0.5 Å-1, with the specific value dependent on the nature of the atoms contributing (e.g. main chain; side chain). Our observations are consistent with these predictions with β =0.4 0 and Γ = 1/τKWW (see Tables I and II), where τKWW is the Kohlrausch-William-Watts characteristic time30. As indicated in equation (3), these data can be used to obtain the mean square displacement, , versus time. As is apparent in Figure 6a, the data for q > 0.4 Å-1 collapse onto a single curve as shown for Mb at 288°K and 150mg/ml. Data from both Hb and Mb at other temperatures and protein concentrations exhibit similar behavior. This collapse onto a single curve is consistent with the processes at q > 0.40 Å-1 being due to self motion of protons. The time dependence of <ri2(t) > ~ tβ can be described by a power law exponent of β=0.4 ±0.03 (see solid line fits in the Figure 7a) which indicates sub-diffusive motion. Data taken at q < 0.4 Å-1 do not collapse onto a single line as shown in the data taken at q=0.382 Å-1 in Figure 7a. This may be due to contamination by coherent scattering or other factors. These values of mean square displacement are rather larger than observed in hydrated powders of Mb31.
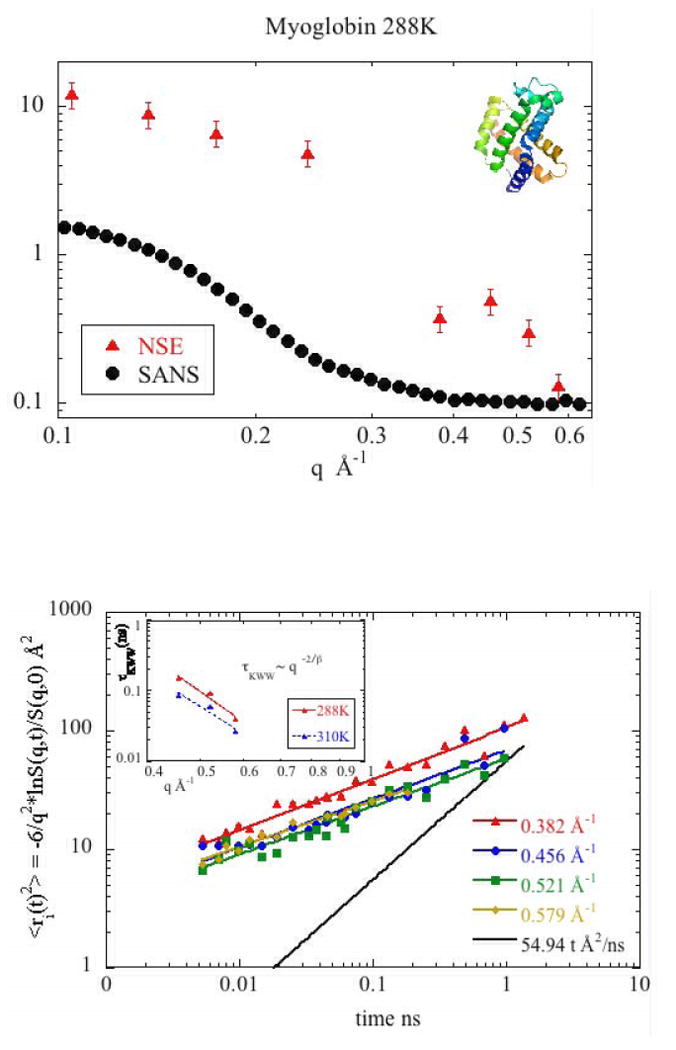
Figure 7.
(a) Mean square displacement of the Mb protons at 288K obtained from Si(q,t) at q>0.26 Å-1. For the 3 largest values of q, a nearly perfect collapse of the experimental data onto a single curve is obtained. The solid colored lines represent <ri2(t)>~tβ with β=0.4. The solid black line displays the results of the calculation of mean square displacement obtained using equation (10). Inset shows the scaling τKWW ~ q−2/β for Mb 150mg/ml at 288K and 310K (b) Mean square displacement of the Hb protons at 20mg/ml and 150mg/ml at 288K obtained from Si(q,t) at q=0.46 Å-1. The solid black line displays the results of the calculation of mean square displacement obtained using equation (10).
In order to estimate the contribution of internal modes of motion on the MSDs, we calculated the contributions from translational and rotational motions according to Le Coeur and Longeville, (2008)32. Assuming a decoupling of the motions,
| (10) |
where Dt is the translational diffusion coefficient and Dr is the rotational diffusion coefficient related to the rotational diffusion time by τr = 1/2Dr Using literature values for these diffusion coefficients (Riveros-Moreno and Wittenberg, 1972; Wang et al., 1997), the resulting MSDs are plotted on the graphs in Figure 7. For all time-scales measured, the observed MSD is greater than that estimated from equation (10). The difference between observed and calculated MSDs is a measure of the contribution of internal modes of motion on the total motion of atoms in the proteins. For short times, most of the motion is due to internal modes. As expected, for longer times, the whole body motion of the protein (translational and rotational) accounts for a progressively larger proportion of the motion.
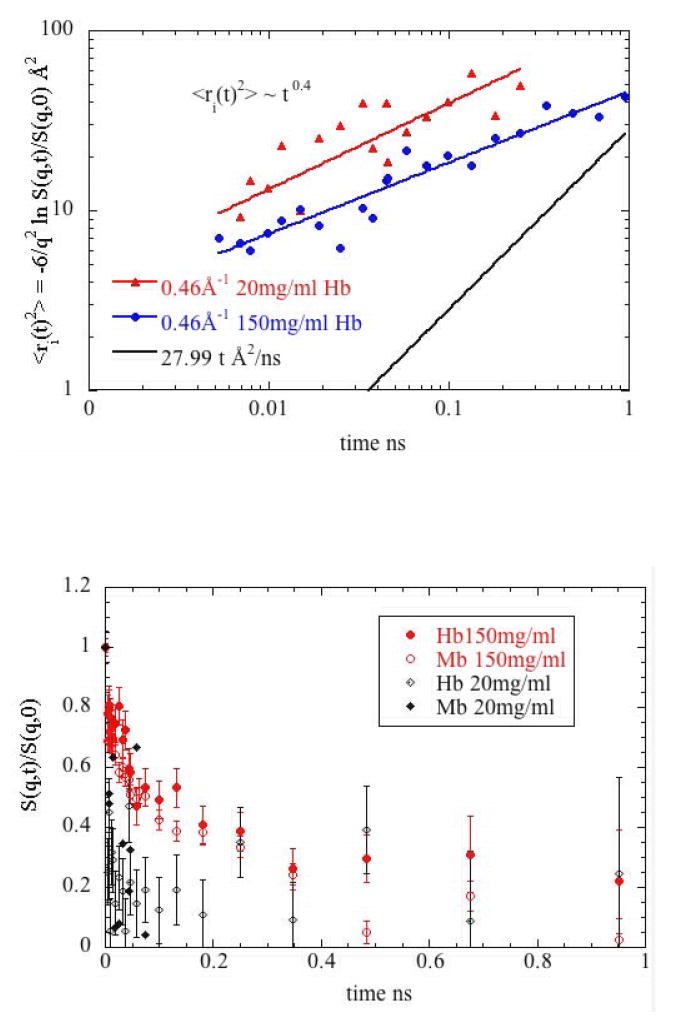
Figure 7b shows that the motion of protein hydrogens is sensitive to protein concentration. Except at the shortest time scales, the mean square displacement of hydrogen is clearly greater for Hb at 20 mg/ml than at 150 mg/ml. This is seen for both Hb and Mb independent of temperature. A portion of the data used to derive the plots in Figure 7 is shown in Figure 8. In all cases, decay times are shorter at 20 mg/ml than at 150 mg/ml. The concentration-dependence of the low q data is consistent with the well known fact that diffusive motion will be faster at low protein concentrations. But we also observe concentration dependence in the large q regime where the data correspond to motions of individual protons. The effect of protein concentration on the observed dynamics is quite dramatic. Figure 8 shows that both Hb and Mb undergo much more rapid decay of correlations at low concentration than at high concentration. Although this plot presents data taken at q = 0.46 Å-1 this trend was consistently observed for all q and at both 288°K and 310°K.
Figure 8.
Normalized intermediate scattering functions S(q,t)/S(q,0) of Mb and Hb at q = 0.46 Å-1 and T = 288°K measuring the internal relaxation at 150 mg/ml (red) and 20 mg/ ml (black). These plots clearly show that relaxation times observed at 20 mg/ml are substantially faster than those seen at 150 mg/ml.
The q-dependence of the τKWW follows a power law such that τKWW~ q-2/β (inset Figure 7a), indicating a diffusive-like character but with a q dependence much steeper than simple diffusion (q-2). This kind of behavior has been measured for a large number of polymer systems20 for q ≤ 1Å-1 and for simulation-derived intermediate scattering functions for protein backbone atoms30. To our knowledge this is the first NSE measurement on incoherent scattering from proteins in solution exhibiting the same self-atomic motion of protons as seen for polymers in this q range.
Discussion
The data collected in this study segregates into that arising from pair-correlation (small q; coherent scattering) and self-correlation (large q; incoherent scattering). Analysis of the coherent scatter provides insight into large scale, correlated motions including whole body diffusion. Analysis of the incoherent scatter provides insight into motion of individual protons which, in the time window available for this study, corresponds to internal modes of motion of the protein. In the following discussion, while recognizing these differences, we will nonetheless combine interpretation of these two data types as well as plot decay times derived from them in the same Figures. This is done to simplify the discussion of the physical basis for the observations and to move as quickly as possible from the data to conclusions about the dynamic character of the proteins.
All NSE data reported here were collected in a time window of 1.4 ns (see, for instance, Figure 5) which, for the slowest decay processes limits the accuracy of the derived relaxation times. As seen in Figure 5, the decay processes at low q extend for time periods far beyond the 1.4 ns window. The errors on the derived relaxation times (see Tables) were calculated from fitting the data within this window, but may be subject to additional errors arising from small errors in scaling and background subtraction. Nevertheless, the trends in relaxation times - as observed, for instance in the low q data in Figures 5a and 5b - appear well defined by the data and fully support our conclusions.
A key motivation for collecting NSE data on homologous proteins of different sizes at different temperatures and protein concentrations was to use comparisons of these data sets to better understand the contributions of translational and rotational diffusion and internal modes on the observed decay times. The simplest predictor of the relationship between decay times collected under different conditions is the Stokes-Einstein equation that states that for a solid sphere, the translational diffusion constant can be expressed as
| (11) |
Generally, we would expect observations dominated by translational diffusion to behave consistent with this relationship when temperature, viscosity or molecular radius are varied. Conversely, there would seem to be no obvious reason for observations dominated by internal modes to scale according to this relationship. Similarly, rotational diffusion of a rigid sphere is predicted to behave as
| (12) |
Changes in temperature, viscosity or particle radius should scale according to equation (12) if rotational diffusion dominates.
The Effect of Temperature and Solvent Viscosity
The viscosity of an aqueous solution changes rather rapidly with temperature. The Stokes-Einstein equation (11) indicates that τ will scale like η/T. That is,
| (13) |
This relationship can be tested using our data for Hb and Mb collected at two different temperatures. We used the τ observed at 288°K to predict the observations at 310°K according to equation (13) in the form:
| (14) |
or
| (15) |
where the subscripts indicate values at temperatures 1 and 2 and the viscosities are those of D2O at the relevant temperatures. This relationship is equally valid for both translational and rotational motion. Figure 9a compares the observed values of τ for Mb at 310°K with that predicted from observations at 288°K using equation (14). The correspondence is striking, indicating that differences in the decay times observed at different temperatures can be attributed entirely to changes in temperature and viscosity of the solvent. It is not surprising that low q data which is dominated by diffusion should behave this way.
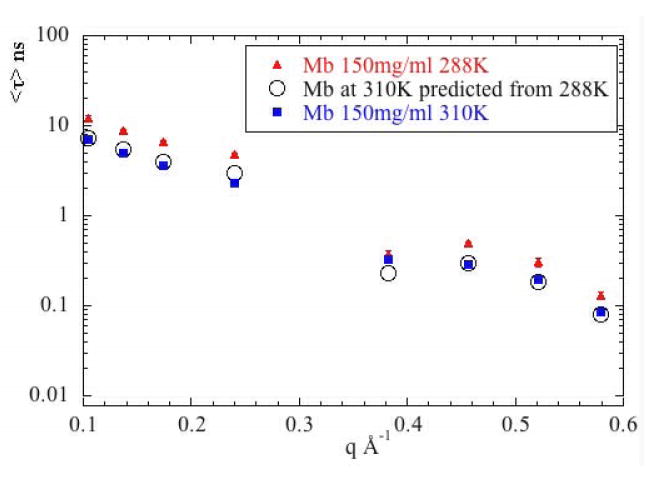
Figure 9.
The effect of temperature and viscosity. Here, τ is plotted as a function of q for (a) Mb and (b) Hb for data collected at T=288°K and 310°K (150 mg/ml protein concentration). Also plotted are predictions for 310°K as calculated from the data collected at 288°K and the Stokes-Einstein equation as described in the text. For Mb, the predictions fall virtually on top of the observations, indicating that temperature and solvent viscosity account for essentially all differences between the τ observed at different temperatures. For Hb, internal modes and rotational diffusion contribute to discrepancies seen in the low q regime.
Our observations on Mb (Figure 9a) and Hb (Figure 9b) indicate that the self-diffusion decay times observed at high q and attributed to internal modes of motion also scale in this way. This observation suggests an intimate relationship between the internal dynamics of the proteins and the viscosity of the solvent. A close relationship between internal dynamics and solvent viscosity has been observed by other techniques35,36,37 and appears to be a fundamental aspect of protein dynamics38. The data reported here provide strong evidence for this relationship.
At low q, the temperature/viscosity scaling is less successful for Hb. The very low value of τ at q = 0.11 Å-1 cannot be accounted for by translational or rotational motions. This momentum transfer corresponds to structural features that are ~ 60 Å in size, approximately the size of the αβ dimers of Hb that rotate relative to one another during quaternary switching. We suggest that the observations at q = 0.11 Å-1 may reflect relatively rapid rotations of the dimers relative to one another.
The observation of a stretched exponential decay at these high q values is consistent with the expected motion of the hydrogen constituents of proteins in solution. Diffusion of protein hydrogens must necessarily be time-dependent and can be broken down into at least 3 time regimes. At very short times their motion will be essentially harmonic, constrained to very fast motion within a local energy well. At somewhat longer times their motion will include movement in concert with the secondary structures, tertiary structures and domains to which they are covalently attached. At very long time scales the mean square displacement will be governed largely by whole-body diffusion of the protein. We would expect a fairly broad range of variation in the first two processes, depending on the local environment of the proton. Since all hydrogens in the protein contribute, the data constitute a weighted average over the entire protein structure. The longer the time scale; the slower the process; resulting in the observation of a multi-scale, stretched exponential decay.
The Effect of Protein Concentration
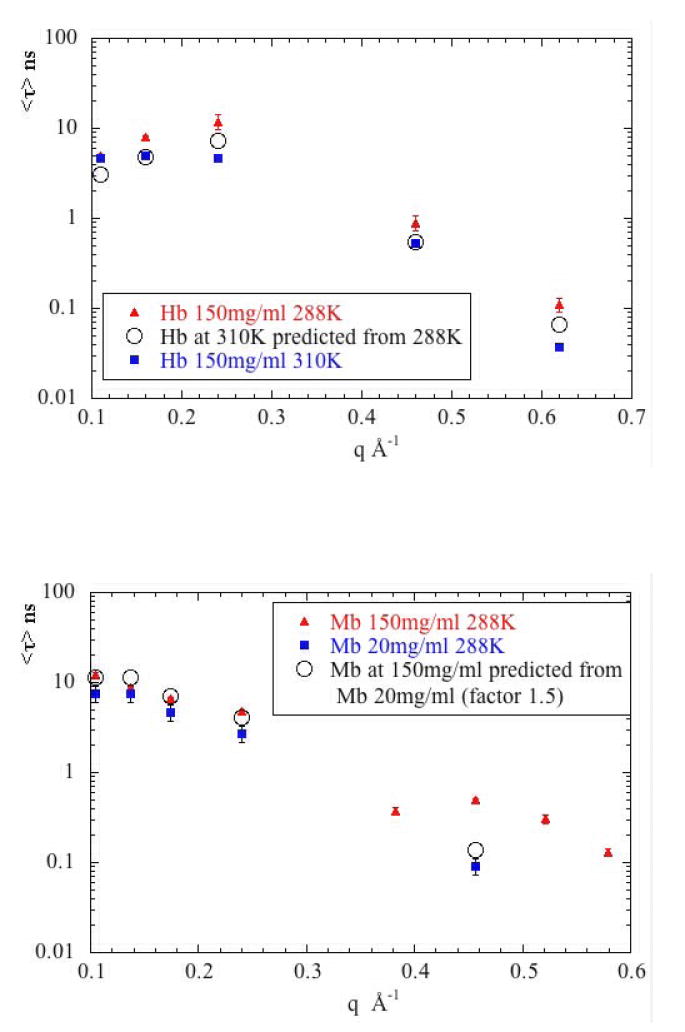
The breadth of the structural ensembles of both Hb and Mb change dramatically as a function of protein concentration below 50 mg/ml5. The viscosity of protein solutions changes substantially as a function of protein concentration and may contribute to these observations. Solutions of Hb at 150 mg/ml are about 2.5 times as viscous as solutions at 20 mg/ml39,40,41, and for Mb42 the difference is about a factor of 1.5. Using the Stokes-Einstein relationship to scale the data at low protein concentrations to those at high concentrations, we obtain the results shown in Figure 10a (for Mb) and 10b (for Hb). For low-q observations, this scaling works exceedingly well, the data from the high concentration (150 mg/ml) specimen being quite accurately predicted from the data collected on the 20 mg/ml solution. For high q, the data are inadequate to make general statements. The scaling moves the data in the right direction, but in only 1 of 3 cases does it appear to accurately predict the high concentration data. The tentative conclusion is that viscosity change associated with protein concentration can account for observed changes in translational diffusion (as expected), but may not be the only factor involved in the changes in internal dynamics observed with change in protein concentration. In other words, a change in protein concentration changes viscosity (which, in turn, affects the observed dynamics) but it may also change other properties of the solution that will have further impact on dynamics. The fact that the spatial scale of structural fluctuations appears relatively constant at protein concentrations above 50 mg/ml5 - whereas viscosity will continue to increase with concentration in this range - further supports the assertion that viscosity is not the only factor contributing to the concentration-dependence of structural fluctuations. Hydrodynamic interactions may account for part (or all) of this discrepancy. It has been observed43 that when macromolecular co-solutes are used to alter viscosity both translational and rotational diffusion coefficients deviate strongly from the Stokes-Einstein laws. Viscosity change due to change in protein concentration is analogous to that due to macromolecular co-solutes.
Figure 10.
The effect of protein concentration. τ is plotted as a function of q for (a) Mb and (b) Hb for data collected at 288°K and concentrations of 20 mg/ml and 150 mg/ml. Also plotted are predictions for 150 mg/ml calculated on the basis of the difference in viscosity of the low and high concentration solutions. In the low q regime, viscosity appears to account for virtually the entire difference observed. In the high q regime, the data are inadequate to support a conclusive statement, but on the basis of limited observations, viscosity differences do not appear to be adequate to account for all observed differences.
The Effect of Protein Size
Qualitative comparison of the data from Hb with that from Mb suggests that decay processes for Mb are - for the most part - slightly faster (lower τ) than for Hb under similar conditions. This is expected for low q observations where diffusion is a major contributor (however, see below). But it also appears to be the case for the high-q observations which are dominated by internal modes of motion. Given the homologous nature of Mb to the subunits of Hb, one would expect the dynamics on internal modes of the two molecules to be roughly the same. One possible origin of the differences is the different surface to volume ratios of the two molecules. Numerous studies have indicated that chemical groups at or near the surface of a molecule are more highly dynamic than those in the interior29, 38. If this is the case, since Mb has a higher surface to volume ratio than Hb, its average rate of internal dynamics should be greater. Our observations are consistent with this interpretation, but fall far short of a proof.
Additional insight can be obtained by a quantitative scaling of the low q data from Hb with that of Mb. To quantitatively scale the two data sets, we assume that Hb will act identically to a Mb molecule with radius increased by a factor of 41/3. If translational diffusion dominates, then equation (14) in the form, τHb = (RHb/RMb)τMb or τHb = 41/3 τMb should be appropriate. If rotational diffusion dominates, then, τHb = (RH/RM)τMb or τHb = 4 τMb should apply. As shown in Figure 11, the low q data for Hb fall in the predicted range only at q ~ 0.24 Å-1 where it appears to arise from a combination of translational and rotational motions. At lower q, the observed τHb is too fast to be accounted for on the basis of whole-body motions. We conclude that diffusion does not dominate the low q data for Hb. This suggests a substantial contribution from internal modes in the small q regime.
Relative Motion of Hemoglobin Subunits
The lowest q data from met-Hb indicate motion on an unexpectedly fast time scale, but at a q value that reflects the size of the α of Hb. The αβ-dimers of Hb rotate relative to one another during quaternary changes that have long been known to be associated with the cooperative binding of ligands by Hb. The concentration-dependent τ observed at q ~ 0.1 Å-1 suggests that at concentrations considerably lower than that in red cells the αβ-dimers are in rapid motion relative to one another. On the basis of data24 collected on oxy-Hb at higher concentrations and over a lower q range we would suggest that these motions do not occur – or are much slower – in oxy-Hb at concentrations comparable to those in the intact red cell. NSE and WAXS measurements on CO-Hb indicate that in liganded Hb, the moton of αβ-dimers is slower and of substantially smaller amplitude (in preparation). The apparent rapid motion of αβ-dimers in met-Hb at 20 mg/ml suggests that there exists a readily accessible, low energy pathway connecting distinct functional states that greatly facilitates these movements and is highly occupied at low protein concentrations. Hb and Mb, like all proteins, have evolved into molecular machines whose properties are highly tuned to the needs of the organism. Their properties, from oxygen affinity to structural fluctuations reflect their functional requirements. The unexpectedly low τ observed at q (~ 0.1 Å-1) appears to reflect motions of αβ-dimers that have evolved in response to the functional requirements of the molecules. This interpretation is consistent with the notion that proteins in solution undergo fluctuations during which their conformations follow low-energy pathways connecting functional sub-states10,11,35.
Recent work has pointed to a dominant role of dynamics in the allosteric behavior of hemoglobin46. The liganded form of hemoglobin in solution appears to be a dynamic intermediate between two quaternary forms (the R and R2 form)3,47. The observed affinity of Hb may arise from an ensemble average of all possible T and R conformations in solution48. The data presented here demonstrate that the dynamic behavior of Hb is highly sensitive to protein concentration, temperature and solvent viscosity, indicating that great care need be exercised in design of experiments aimed at understanding its effect on protein function.
Methods
Wide-angle x-ray scattering (WAXS) data were collected at the BioCAT undulator beam line (18ID)45 at the Advanced Photon Source (APS), Argonne, IL. The experiments on protein dynamics were performed at the NSE spectrometer IN11c at the Institut Laue Langevin, Grenoble, using a wavelength of 5.5 Å.The intermediate scattering function S(q,t) as function of Fourier time, t was measured over a Fourier time range from 0.005 to 1.5 ns and a momentum transfer range from 0.1 Å-1 to 0.62 Å-1.
The NSE experiments were performed at two different concentrations of bovine met-Hb and equine horse heart skeletal muscle Mb (Sigma-Aldrich): 20mg/ml (volume fraction = 1.5%) and 150 mg/ml (volume fraction = 11.25%) dissolved in deuterated water. The experiments were carried out at 288°K and 310°K. Data from pure deuterated solvent was measured in separate runs.
In the wide angle regime q > 0.26 Å-1, for the Hb solution data the scattering from the deuterated water (D2O) has significant contribution and has to be subtracted carefully. This is done by assuming that the scattering from the pure sample is reduced by the fact that D2O is replaced by Hb. In addition, the stronger scattering from the Hb will reduce the likelihood of scattering from the D2O by the ratio of the transmission coefficient. Transmission coefficients were determined at Argonne IPNS beamline SASI, at 5.5 Å. For Hb at 150mg/ml the transmission coefficient was 0.742, Hb at 20mg/ml, 0.816; for D2O, 0.834. The values were used to scale the D2O data which was subtracted using factors of 0.742/0.834*0.8875=0.7896 for D2O subtracted from the 150mg/ml solutions and 0.816/.834*0.985=0.9637 for D2O subtracted from the 20mg/ml solution. The first factor, is the ratio of transmission coefficients, accounting for the fact that the D2O is “shadowed” by the Hb; the second factor is the volume faction of D2O in the sample (1- excluded volume of Hb). Similar subtraction was also done for Mb. For Mb at 150mg/ml a transmission of 0.7715, Mb at 20mg/ml a transmission of 0.8456 and for D2O a transmission of 0.8572 was measured directly at IN11c. The specific volume of Mb was assumed to be 0.743 cm3/g and Hb 0.750 cm3/g.
Acknowledgments
We would like to thank R. Fischetti, D. Gore, S. Mandava and D. Rodi for assistance with the WAXS experiments; Dennis Liang for help with the SNAS experiments; and C. Ho for informative discussions. We have benefited from the dedicated efforts of an anonymous referee whose comments have considerably improved this paper.
Footnotes
Publisher's Disclaimer: This is a PDF file of an unedited manuscript that has been accepted for publication. As a service to our customers we are providing this early version of the manuscript. The manuscript will undergo copyediting, typesetting, and review of the resulting proof before it is published in its final citable form. Please note that during the production process errors may be discovered which could affect the content, and all legal disclaimers that apply to the journal pertain.
Literature Cited
- 1.Perutz MF. Stereochemistry of cooperative effects in haemoglobin. Nature. 1970;228:726–39. doi: 10.1038/228726a0. [DOI] [PubMed] [Google Scholar]
- 2.Mueser TC, Rogers PH, Arnone A. Interface sliding as illustrated by the multiple quaternary structures of liganded hemoglobin. Bioch. 2000;39:15353–15364. doi: 10.1021/bi0012944. [DOI] [PubMed] [Google Scholar]
- 3.Lukin JA, Kontaxis G, Simplaceanu V, Yuan Y, Bax A, Ho C. Quaternary structure of hemoglobin in solution. Proc Natl Acad Sci. 2003;100:517–520. doi: 10.1073/pnas.232715799. [DOI] [PMC free article] [PubMed] [Google Scholar]
- 4.Tame JRH. What is the true structure of hemoglobin? TIBS. 1999;24:372–377. doi: 10.1016/s0968-0004(99)01444-9. [DOI] [PubMed] [Google Scholar]
- 5.Makowski L, Rodi DJ, Mandava S, Minh D, Gore D, Fischetti RF. Molecular crowding inhibits intramolecular breathing motions in proteins. J Mol Biol. 2008;375:529–546. doi: 10.1016/j.jmb.2007.07.075. [DOI] [PMC free article] [PubMed] [Google Scholar]
- 6.Elber R, Karplus M. Multiple conformational states of Proteins: A molecular dynamics analysis of myoglobin. Science. 1987;235:318–321. doi: 10.1126/science.3798113. [DOI] [PubMed] [Google Scholar]
- 7.Smith J, Kuczera K, Karplus M. Dynamics of myoglobin: Comparison of simulation results with neutron scattering spectral. Proc Nat Acad Sci. 1990;87:1601–1605. doi: 10.1073/pnas.87.4.1601. [DOI] [PMC free article] [PubMed] [Google Scholar]
- 8.Vendruscolo M, Dobson CM. Dynamic visions of enzymatic reactions. Science. 2006;313:1586–1587. doi: 10.1126/science.1132851. [DOI] [PubMed] [Google Scholar]
- 9.Kubo R. The fluctuation-dissipation theorem. Rep Prog Phys. 1966;29:255–284. [Google Scholar]
- 10.Henzler-Wildman KA, Thai V, Lei M, Ott M, Wolf-Watz M, Fenn T, Pozharski E, Wilson MA, Petsko GA, Karplus M, Hubner CG, Kern D. Intrinsic motions along an enzymatic reaction trajectory. Nature. 2007a;450:838–844. doi: 10.1038/nature06410. [DOI] [PubMed] [Google Scholar]
- 11.Henzler-Wildman KA, Lei M, Thai V, Kerns SJ, Karplus M, Kern D. A hierarchy of timescales in protein dynamics is linked to enzyme catalysis. Nature. 2007b;450:913–916. doi: 10.1038/nature06407. [DOI] [PubMed] [Google Scholar]
- 12.Mouawad L, Perahia Motions in Hemoglobin Studied by Normal Mode Analysis and Energy Minimization: Evidence for the Existence of Tertiary T-like, Quaternary R-like Intermediate Structures. J Mol Biol. 1996;258:393–410. doi: 10.1006/jmbi.1996.0257. [DOI] [PubMed] [Google Scholar]
- 13.Lindorff-Larsen K, Best RB, DePristo MA, Dobson CM, Vendruscolo M. Simultaneous determination of protein structure and dynamics. Nature. 2005;433:128–132. doi: 10.1038/nature03199. [DOI] [PubMed] [Google Scholar]
- 14.Mittermaier A, Kay LE. New tools provide new insights in NMR studies of protein dynamics. Science. 2006;312:224–228. doi: 10.1126/science.1124964. [DOI] [PubMed] [Google Scholar]
- 15.Petsko GA, Ringe D. Fluctuations in Protein structure from x-ray diffraction. Annu Rev Biophys Bioeng. 1984;13:331–371. doi: 10.1146/annurev.bb.13.060184.001555. [DOI] [PubMed] [Google Scholar]
- 16.Ma J. Usefulness and limitations of normal mode analysis in modeling dynamics of biomolecular complexes. Structure. 2005;13:373–380. doi: 10.1016/j.str.2005.02.002. [DOI] [PubMed] [Google Scholar]
- 17.Mezei F. Neutron Spin Echo. Springer Verlag; 1980. [Google Scholar]
- 18.Bu Z, Biehl R, Monkenbusch M, Richter D, Callaway DJE. Coupled protein domain motion in Taq polymerase revealed by neutron spin-echo spectroscopy. Proc Natl Acad Sci. 2005;102:17646–17651. doi: 10.1073/pnas.0503388102. [DOI] [PMC free article] [PubMed] [Google Scholar]
- 19.Tehei M, Madern D, Franzetti B, Zaccai G. Neutron Scattering Reveals the Dynamic Basis of Protein Adaptation to Extreme Temperature. J Blol Chem. 2005;280:40974–40979. doi: 10.1074/jbc.M508417200. [DOI] [PubMed] [Google Scholar]
- 20.Richter D, Monkenbusch M, Arbe A, Colmenero J. Advances in Polymer Science. Vol. 174. Springer; 2005. Neutron Spin Echo in Polymer Systems. [Google Scholar]
- 21.Biehl R, Hoffmann B, Monkenbusch M, Falus P, Preost S, Merkel R, Richter D. Direct Observation of Correlated Interdomain Motion in Alcohol Dehydrogenase. Phys Rev Letts. 2008;101:138102. doi: 10.1103/PhysRevLett.101.138102. [DOI] [PubMed] [Google Scholar]
- 22.Ackerson BJ. Correlations for interacting Brownian particles. J Chem Phys. 1976;64:242–246. [Google Scholar]
- 23.Gapinsky J, Wilk A, Patkowski A, Haubler W, Banchio AJ, Pecoraand R, Nagele G. Diffusion and microstructural properties of solutions of charged nanosized. proteins: Experiment versus theory. J Chem Phys. 2005;123:054708. doi: 10.1063/1.1996569. [DOI] [PubMed] [Google Scholar]
- 24.Doster W, Longeville S. Microscopic Diffusion and Hydrodynamic Interactions of Hemoglobin in Red Blood Cells. Biop J. 2007;93:1360–1368. doi: 10.1529/biophysj.106.097956. [DOI] [PMC free article] [PubMed] [Google Scholar]
- 25.Miguel X, Fernandes MX, Garcia de la Torre J. Brownian Dynamics Simulation of Rigid Particles of Arbitrary Shape in External Fields. Biop J. 2002;83:3039–3048. doi: 10.1016/S0006-3495(02)75309-5. [DOI] [PMC free article] [PubMed] [Google Scholar]
- 26.Bardhan JP, Park S, Makowski L. SoftWAXS: A Computational Tool for Modeling Wide-Angle X-ray Solution Scattering from Biomolecules. J Appl Cryst. 2009;42:932–943. doi: 10.1107/S0021889809032919. [DOI] [PMC free article] [PubMed] [Google Scholar]
- 27.Park S, Bardhan JP, Roux B, Makowski L. Simulated X-Ray Scattering of Protein Solutions Using Explicit-Solvent Molecular Dynamics. J Chem Phys. 2009;130:134114. doi: 10.1063/1.3099611. [DOI] [PMC free article] [PubMed] [Google Scholar]
- 28.Longeville S, Doster W, Kali G. Myoglobin in crowded solutions: structure and diffusion. Chem Physics. 2003;292:413–424. [Google Scholar]
- 29.Glockle WG, Nonnenmacher TF. A Fractional Calculus Approach to Self-Similar Protein Dynamics. Biop J. 1995;68:46–53. doi: 10.1016/S0006-3495(95)80157-8. [DOI] [PMC free article] [PubMed] [Google Scholar]
- 30.Dellerue S, Petrescu A-J, Smith JC, Bellissent-Funel M-C. Radially Softening Diffusive Motions in a Globular Protein. Biop J. 2001;81:1666–1676. doi: 10.1016/S0006-3495(01)75820-1. [DOI] [PMC free article] [PubMed] [Google Scholar]
- 31.Zaccai G. How soft is a protein? A protein dynamics force constant measured by neutron scattering. Science. 2000;288:1604–1607. doi: 10.1126/science.288.5471.1604. [DOI] [PubMed] [Google Scholar]
- 32.Le Coeur C, Longeville S. Microscopic protein diffusion at high concentration by neutron spin-echo spectroscopy. Chemical Phys. 2008;345:298–304. [Google Scholar]
- 33.Riveros-Moreno V, Wittenberg JB. The self-diffusion coefficients of myoglobin and hemoglobin in concentrated solutions. J Biol Chem. 1972;247:895–901. [PubMed] [Google Scholar]
- 34.Wang D, Kreutzer U, Chung Y, Jue T. Myoglobin and Hemoglobin Rotational Diffusion in the Cell. Biop J. 1997;73:2764–2770. doi: 10.1016/S0006-3495(97)78305-X. [DOI] [PMC free article] [PubMed] [Google Scholar]
- 35.Fenimore PW, Frauenfelder H, McMahon BH, Young RD. Bulk-solvent and hydration-shell fluctuations, similar to alpha- and beta-fluctuations in glasses, control protein motions and functions. Proc Natl Acad Sci. 2004;101:14408–14413. doi: 10.1073/pnas.0405573101. [DOI] [PMC free article] [PubMed] [Google Scholar]
- 36.Finkelstein IJ, Massari AM, Fayer MD. Viscosity-dependent Protein dynamics. Biop J. 2007;92:3652–3662. doi: 10.1529/biophysj.106.093708. [DOI] [PMC free article] [PubMed] [Google Scholar]
- 37.Kim S, Lim M. Effects of Solvent Viscosity on Conformational Dynamics of Heme-pocket in Myoglobin and Hemoglobin. Bull Korean Chem Soc. 2006;27:1825–1831. [Google Scholar]
- 38.Frauenfelder H, Chen G, Berendzen J, Fenimore PW, Jansson H, McMahon BH, Stroe IR, Swenson J, Young RD. A unified model of protein dynamics. Proc Natl Acad Sci. 2009;106:5129–5134. doi: 10.1073/pnas.0900336106. [DOI] [PMC free article] [PubMed] [Google Scholar]
- 39.Schlecht P, Mayer A, Hettner G, Vogel H. Dielectroic properties of hemoglobin and myoglobin. I. Influence of solvent and particle size on the dielectric dispersion. Biopolymers. 1969;7:963–974. doi: 10.1002/bip.1969.360070611. [DOI] [PubMed] [Google Scholar]
- 40.Ross PD, Minton AP. Hard quasispherical model fo rthe viscosity of hemoglobin solutions. Bioch Biop Res Comms. 1977;76:971–976. doi: 10.1016/0006-291x(77)90950-0. [DOI] [PubMed] [Google Scholar]
- 41.Iino M, Okuda Y. Concentration dependence of brownian motion and viscosity of hemoglobin solutions. Jpn J Appl Phys. 1997;36:3786–3790. [Google Scholar]
- 42.Tanford C, Kawahara K, Lapanje S. Proteins as Random Coils. I. Intrinsic Viscosities and Sedimentation Coefficients in Concentrated Guanidine Hydrochloride. J Am Chem Soc. 1967;89:729–736. [Google Scholar]
- 43.Lavalette D, Hink MA, Tourbez M, Tetreau C, Visser AJ. Proteins as micro viscometers: Brownian motion revisited. Eur Biophys J. 2006;35:517–522. doi: 10.1007/s00249-006-0060-z. [DOI] [PubMed] [Google Scholar]
- 44.Zhou Y, Vitkup D, Karplus M. Native proteins are surface-molten solids: application of the Lindemann criterion for the solid versus liquid state. J Mol Biol. 1999;285:1371–1375. doi: 10.1006/jmbi.1998.2374. [DOI] [PubMed] [Google Scholar]
- 45.Fischetti R, Stepanov S, Rosenbaum G, Barrea R, Black E, Gore D, Heurich R, Kondrashkina E, Kropf AJ, Wang S, Zhang K, Irving TC, Bunker GB. The BioCAT undulator beamline 18ID: a facility for biological non-crystalline diffraction and X-ray absorption spectroscopy at the Advanced Photon Source. J Synchrotron Radiat. 2004;11:399–405. doi: 10.1107/S0909049504016760. [DOI] [PubMed] [Google Scholar]
- 46.Yonetani T, Laberge M. Protein Dynamics Explain the Allosteric Behaviors of Hemoglobin. Biochim Biophys Acta. 2008;1784:1146–1158. doi: 10.1016/j.bbapap.2008.04.025. [DOI] [PMC free article] [PubMed] [Google Scholar]
- 47.Gong Q, Simplaceanu V, Lukin JA, Giovannelli JL, Ho NT, Ho C. Quaternary Structure of Carbonmonoxyhemoglobins in Solution: Structural Changes Induced by the Allosteric Effector Inositol Hexaphosphate. Biochemistry. 2006;45:5140–5148. doi: 10.1021/bi052424h. [DOI] [PubMed] [Google Scholar]
- 48.Song X, Simplaceanu V, Ho NT, Ho C. Effector-Induced Structural Fluctuation Regulates the Ligand Affinity of an Allosteric Protein: Binding of Inositol Hexaphosphate Has Distinct Dynamic Consequences for the T and R States of Hemoglobin. Biochemistry. 2008;47:4907–4915. doi: 10.1021/bi7023699. [DOI] [PMC free article] [PubMed] [Google Scholar]