Abstract
For nearly four decades, adaptive beamforming (ABF) algorithms have been applied in RADAR and SONAR signal processing. These algorithms reduce the contribution of undesired off-axis signals while maintaining a desired response along a specific look direction. Typically, higher resolution and contrast is attainable using adaptive beamforming at the price of an increased computational load. In this paper, we describe a novel ABF designed for medical ultrasound, named the Time-domain Optimized Near-field Estimator (TONE). We performed a series of simulations using synthetic ultrasound data to test the performance of this algorithm and compared it to conventional, data independent, delay and sum beamforming (CBF) method. We also performed experiments using a Philips SONOS 5500 phased array imaging system. CBF was applied using the default parameters of the Philips scanner, whereas TONE was applied on per channel, unfocused data using an unfocused transmit beam. TONE images were reconstructed at a sampling of 67 µm laterally and 19 µm axially. The results obtained for a series of five 20-µm wires in a water tank show a significant improvement in spatial resolution when compared to CBF. We also analyzed the performance of TONE as a function of speed of sound errors and array sparsity, finding it robust to both.
Index Terms: Beamforming, image reconstruction, ultrasound imaging
I. INTRODUCTION
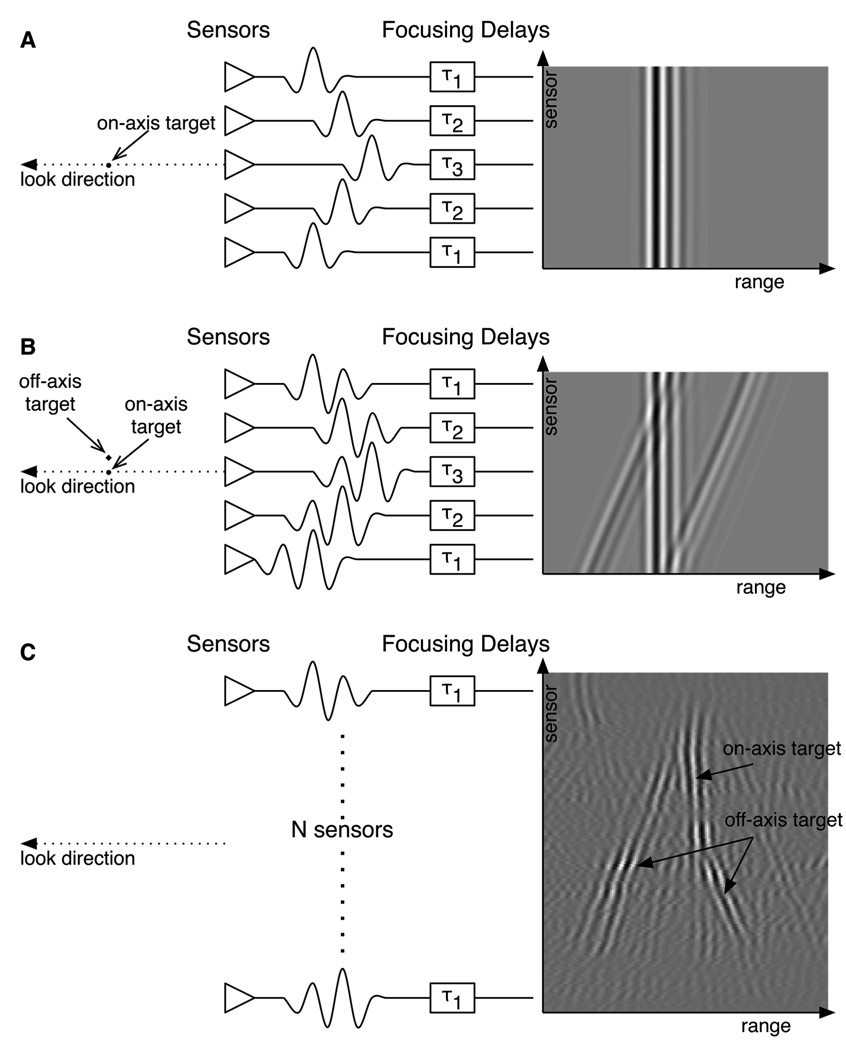
Sensor arrays are used in many application fields including RADAR, SONAR, geophysics, and medical imaging. For these applications, the received data is often processed using conventional “delay-and-sum” beamforming. In this method, the output is formed by summing weighted and delayed versions of the received signals. The delays used for each sensor element are determined by the array geometry and the desired look direction. While this approach is straightforward and easy to implement, off-axis scatterers can introduce clutter, reducing the overall quality of the beamformer output. This is shown schematically and experimentally in Fig. 1. In Fig. 1(A), an array of sensors is focused along the dotted line and a single point target is placed in the look direction, or on-axis, at a fixed distance from the array. The target reflects energy toward the array, generating a signal on each of the individual sensors. Focal delays are applied to each signal to generate the sensor/range data set shown in the right of the figure. Summation across sensors to form an image line will amplify the signal coming from the look direction. However, when a secondary target is placed off-axis, as shown in Fig. 1(B), it may lie within the array’s transmit beam and therefore contribute to the received echo. This is apparent in the tilted waveforms visible in the sensor/range data set. Although summation across sensors amplifies the signal coming from directly in front of the array, it does not entirely eliminate the contribution of the off-axis target. Finally, Fig. 1(C) depicts medical ultrasound data obtained from the thyroid of a human subject (data courtesy of G. E. Trahey, Duke University, Durham, NC). At least three clear waveforms (possibly due to micro-calcifications in the thyroid) are visible in this sensors/range data set. These nonfocal targets would appear in this image line as clutter, ultimately reducing image contrast and resolution.
Fig. 1.
A: An array of sensors is focused along the look direction (dotted line) where a single point target is placed at a fixed distance from the array. Received data after focusing is depicted on the right side. B: When a secondary target is placed off-axis it will corrupt the received data by introducing the tilted waveforms observed on the right-hand side of this figure. C: in vivo single channel thyroid data. Data clearly show the presence of bright off-axis scatterers, as evidenced by the tilted wave fronts. Data in C courtesy of G. E. Trahey, Duke University.
The problem of nulling the contribution of off-axis scatterers was first investigated for RADAR and SONAR systems by extending the pioneering work of Norbert Wiener. The application of Wiener filter theory to array signal processing led to the initial development of adaptive beamforming [1]–[3]. In adaptive beamforming (ABF), the information encapsulated in the data received by an array of sensors is used to determine a set of weights that optimize the beamformer output.
For nearly four decades, a variety of adaptive beamforming algorithms have been developed, each exploiting specific properties of the received data. These algorithms are able to achieve resolution far superior to that predicted by diffraction theory, while simultaneously attaining excellent side lobe reduction. The most common approaches calculate a series of weights by minimizing the energy in the beamsum signal, subject to the constraint that the beamformer must exhibit a given response in the look-direction [4], [5]. Attenuation of off-axis targets is obtained by applying those weights to the received data. Typically, the second-order statistics (i.e., the covariance matrix) of the data are used to determine the weights. These algorithms were initially applied in passive SONAR, where the use of receive only systems allowed acquisition of numerous unique statistical looks at the environment. This is not generally the case for a transmit/receive system, such as medical ultrasound.
Alternative ABF algorithms were simultaneously developed to utilize different properties of the received signals. Common approaches include the reduced rank beamformers [6]–[8]. The basic concept underlying these methods is to save computation time by calculating a reduced rank covariance matrix that only includes the strongest scatterers. Oblique projections have also been proposed to beamform the data in a subspace which is orthogonal to the space spanned by the scatterers [9], [11].
It is often the case that limited data are available, making computation of a reliable covariance matrix difficult. This could be due, for example, to nonstationary environments, fast moving targets, or transmit/receive operation. In these cases, several groups have proposed the use of a diagonal loading term to obtain a stable covariance matrix which allows solution for the optimal weights [12]–[15]. Diagonal loading is a common technique in array signal processing to stabilize a matrix which is ill-conditioned for inversion. Another series of adaptive algorithms has been developed which does not rely on statistical properties of the data and thus can be used on a single realization (or snapshot). These approaches are particularly well suited to pulse-echo imaging. These algorithms include techniques based on generalized eigenvalue problems [16], [17], Bayesian approaches [18]–[20], maximum likelihood estimators [21], [22], data-adaptive regularization [23], and minimum worst-case gain methods [24].
In medical ultrasound, bright off-axis targets can seriously degrade image quality by introducing broad image clutter, which reduces image contrast and resolution. This is confirmed in the thyroid data of Fig. 1(C). Further, it is well known that the acoustic reflectivity of targets within the body covers many orders of magnitude [25]. The successful application of adaptive beamforming to medical ultrasound would reduce the effects of bright off-axis targets, thus improving the overall image quality. However, the unique characteristics of ultrasound data make blind application of existing adaptive beamforming algorithms unlikely to be successful. Unlike passive SONAR, for example, limited statistics are available in medical ultrasound to form a robust covariance matrix. Furthermore, on-axis and off-axis signals are strongly correlated, requiring the use of special algorithms such as the Duvall beamformer [26] or preprocessing techniques such as spatial smoothing to decorrelate signals before filtering is applied [27]–[31]. Lastly, ultrasound imaging is generally performed using broadband signals in the near-field, while many adaptive beamforming techniques are specifically designed for narrow-band signals in the far-field.
In the past, several groups have applied adaptive algorithms to medical ultrasound beamforming. Mann and Walker [32], [33] showed increased resolution and contrast using a modified version of the Frost beamformer [5]. Other groups [35], [40] have applied the Capon beamformer [4] coupled with spatial smoothing to decorrelate on-axis and off-axis signals. Wang et al. [34] used synthetic transmit focusing to generate a robust covariance matrix. Although Wang’s initial results are positive, the use of synthetic transmit significantly limits the application of these algorithms in real clinical environments because of potential motion artifacts and limitations of existing hardware.
In this paper, we present an algorithm that is well suited for beamforming in medical ultrasound imaging. We briefly describe the algorithm, present initial results from simulations and experiments, and offer discussion and conclusions.
Note for the reader: matrices are represented using underlined upper-case italic characters such as X, while vectors are represented using underlined lower-case italics such as x. Superscripts H and T represent conjugate transpose and regular transpose operations, respectively.
II. TIME-DOMAIN, OPTIMIZED, NEAR-FIELD ESTIMATOR (TONE)
The algorithm presented here is developed from the Spatial Processing: Optimized and Constrained (SPOC) technique originally developed by Van Trees et al. for applications in passive SONAR [18]. We term it Time-domain, Optimized, Near-field Estimator (TONE). TONE is particularly useful since it does not require knowledge of second-order statistics and is, therefore, applicable with only a single realization of data. Furthermore, it does not require any preprocessing technique to be applied. This algorithm is briefly described as follows.
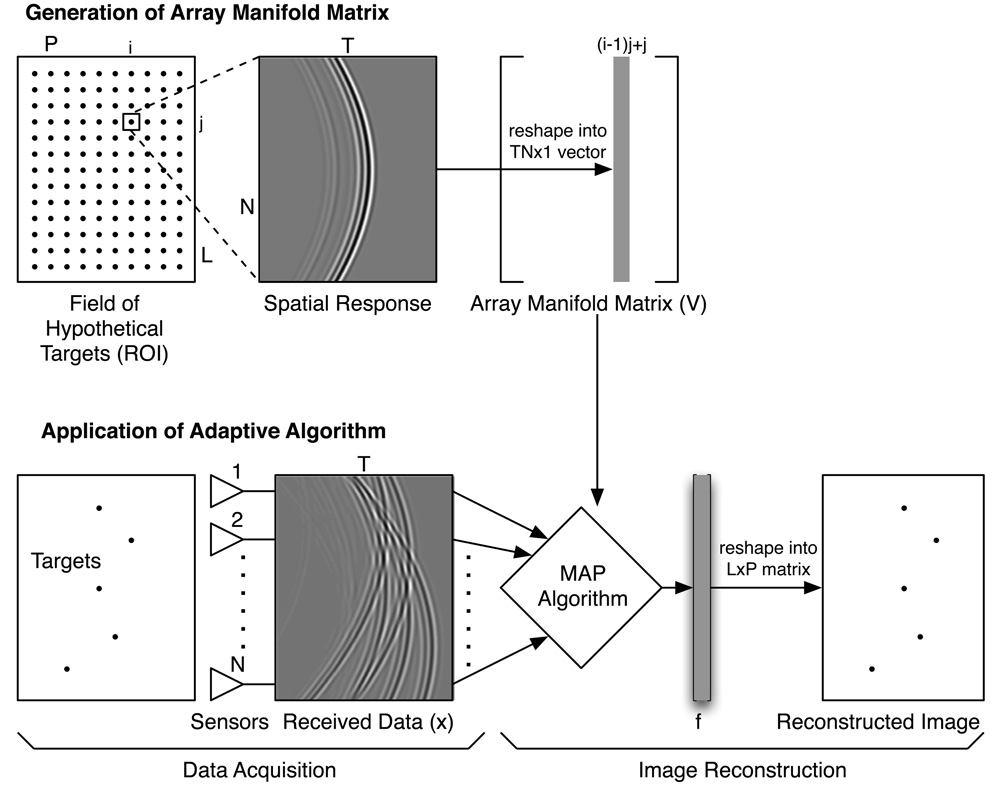
The TONE algorithm is built upon the following linear model of image formation. Similar linear model formulations have been used in medical ultrasound [41]–[43]. The imaging region, referred to as the region of interest (ROI), is first subdivided into a collection of hypothetical targets at arbitrary positions, as shown schematically in Fig. 2. Finer grid sampling yields finer final image resolution but entails higher computational costs. For each hypothetical targets in the ROI, we determine (through experiment, simulations, or theory) the signal received by the array from a target at that specific point. We refer to this two-way response as the spatial response for a particular target. For every hypothetical target, the spatial response is a matrix of dimensions T × N, where T is the number of samples in the axial, or temporal, dimension and N is the number of sensor elements in the array. Note that this formulation accommodates any array geometry. After the spatial responses for all the hypothetical targets have been determined, these responses are reshaped to form an array manifold matrix V of dimensions NT × LP, where L and P are the numbers of hypothetical targets in the range and lateral dimensions, respectively. The observation model becomes
| (1) |
where x = [x1 x2 … xN]T is the data received by the N-element array and f is the LP × 1 target vector, whose elements are the amplitudes of the hypothetical target located in the ROI x is an NT × 1 vector that is obtained by concatenating the T × 1 channel data xi. Given x and V, TONE operates on the received data x and the array manifold matrix V to solve for the position and intensity of the real targets (i.e., the f vector). In this paper, we solve this under determined problem using a maximum a posteriori estimate of the target vector, as explained below. We initially consider the joint probability density function (PDF) p(x, f). The maximum likelihood estimate of f is given by [39]
| (2) |
Fig. 2.
Schematic representation of TONE beamforming. A signal model is first generated of the field produced by a series of hypothetical targets. The s ensors’ output is matched to the signal model to solve for the position and intensity of the real targets. Statistics are not required and both near-field/far-field and broad/narrow band cases can be considered.
Note that the estimate of f is obtained by constraining the problem such that the observation model in (1) is satisfied. That is to say, x = Vf̂. The joint PDF in (2) can be rewritten using the conditional PDF p(x/f) and the marginal density p(f) as follows:
| (3) |
which is referred to as the maximum a posteriori (MAP) estimate of f. Note that the conditional PDF p(x/f) is equally likely for every f that satisfies the observation model described in (1). Thus, (3) reduces to the following:
| (4) |
Furthermore, we assume that the marginal PDF p(f) is known a priori and mathematically expressed as a zero-mean Gaussian distribution. That is to say that the targets follow a Gaussian amplitude distribution. The constraint imposed by the observation model (1) on (4) assures that the trivial solution f̂= 0 (which is the maximum likelihood solution for a zero-mean Gaussian pdf) is not obtained for nonzero target distribution. Thus, the MAP problem becomes
| (5) |
where fι are elements of f. A solution for the MAP optimization problem is found using the following iterative procedure [18], [36].
-
Step 1)
Perform an eigen-decomposition of the matrix VHV = PΛPH, where P contains the eigenvectors and Λ = diag(λ1, λ2,…, λLP) contains the eigenvalues in descending order. Note that the maximum rank of VHV is NT, therefore, there will be at least LP-NT zero eigenvalues.
-
Step 2)
Divide the eigenvalues into two groups: non zero (λ1, λ2,…, λfix), and zero (λfix+1, λfix+2,…, λLP).
-
Step 3)
Decompose the eigenvector matrix P into Pfree and Pfix, corresponding to the nonzero and zero eigenvalues, respectively.
-
Step 4)
Compute x′fix = (VPfix)Hx.
-
Step 5)
Compute where
-
Step 6)
Initialize f′free to zero.
-
Step 7)
Compute f = Pfixf′fix + Pfreef′free.
-
Step 8)
Compute the diagonal matrix T = diag(|f1|2,|f2|2,…,|fLP|2).
-
Step 9)
Compute
-
Step 10)
Repeat steps 7–9 until f′free has converged.
-
Step 11)
The target amplitudes are given by Step 7.
The original SPOC algorithm of Van Trees was developed for applications in passive SONAR, assuming narrow-band signals received from the far-field. In this application, the received data x is simply an N element vector of the complex demodulated signals received on each channel. Since passive SONAR assumes narrow-band signals, this received data consists of only a single complex sample on each channel. The signal from a single far-field target received by a uniformly spaced linear array takes on the form of a discretely sampled complex exponential. The array manifold matrix for this application thus consists of a set of Q columns, each of which is an N sample complex exponential of a different frequency (Q is the number of hypothetical targets placed in the far-fleld). In medical ultrasound, the received signals are near-field and broad-band, and this requires a significantly different signal model. Hypothetical targets are now distributed over the range (P) and lateral (L) dimensions of the ROI. Furthermore, time records of length T are necessary to fully capture the broad-band nature of the signals. Given an N element linear array, the array manifold matrix is thus of dimensions NT × LP, as described above.
It is also possible to formulate a signal model in the frequency domain. In this case, the algorithm is applied to every frequency bin and the array manifold matrix is constructed using complex exponential signals with different phases. Although both the frequency and time domain approaches are possible, in this paper we use the time domain approach because it more fully captures the intrinsic complexity of the data.
Extension to 3-D data sets simply requires distribution of hypothetical targets over a volume and three dimensional spatial responses to form the array manifold matrix. The mathematical formulation is the same of that used in (1) except that the dimensions of V are now NTZ by LPQ, where Z and Q are the number of samples and the number of hypothetical targets in the third dimension, respectively (the dimensions of f and x also change accordingly).
III. SIMULATION METHODS
Computer simulations were performed to compare the performance of TONE to conventional delay-and-sum beamforming. All calculations were performed in MATLAB (MathWorks Inc., Natick, MA), and utilized synthetic ultrasound signals.
A. Resolution
For this set of simulations, we modeled a 32 element linear array operating at 5 MHz with roughly 70% fractional bandwidth (BW) and 150-µm element pitch. The array response was modeled using DELFI, an ultrasound system simulation tool recently developed in our lab [44]. The radio-frequency (RF) data were sampled temporally at 40 MHz. We simulated two ideal point targets in front of the array at a depth of 22 mm and reconstructed the image in a region 1 mm axially by 2 mm laterally. The points were separated by a distance of 50, 60, 90, 150, 300, and 1500 µm to demonstrate the lateral resolution limits of TONE. Hypothetical targets were placed axially every 20 µm and laterally every 40 µm. Transmission was simulated by firing on all 32 elements simultaneously. This simulates a plane wave transmit and allows for a more computationally efficient and compact description of the ROI. For, all the simulations presented in this paper, the array manifold matrix V was obtained by simulating with DELFI the responses at the locations of each hypothetical target. Doing so allowed for the consideration of both angular sensitivity and attenuation. The same target distributions were also processed using the conventional delay and sum beamforming; in this case we used a fixed focused transmit and dynamic focusing on receive.
B. Point Targets
A series of point targets were distributed within a 4 × 5 mm region in range and azimuth, respectively. Elevation slice thickness was not considered in this set of simulations. In this case, we simulated a 32 element linear array operating at 5 MHz with 150 µm element pitch. Also, in this case, the sampling frequency was set at 40 MHz. In the case of TONE, a plane wave was simulated by transmitting on all 32 elements. Conventional beamforming was applied using fixed focus transmit and dynamic receive focusing. For TONE, we discretized the image region into a series of hypothetical targets separated 20 µm in range and 120 µm in azimuth. The positions of the points were chosen so that none coincided with the positions of the hypothetical targets.
C. Anechoic Cyst
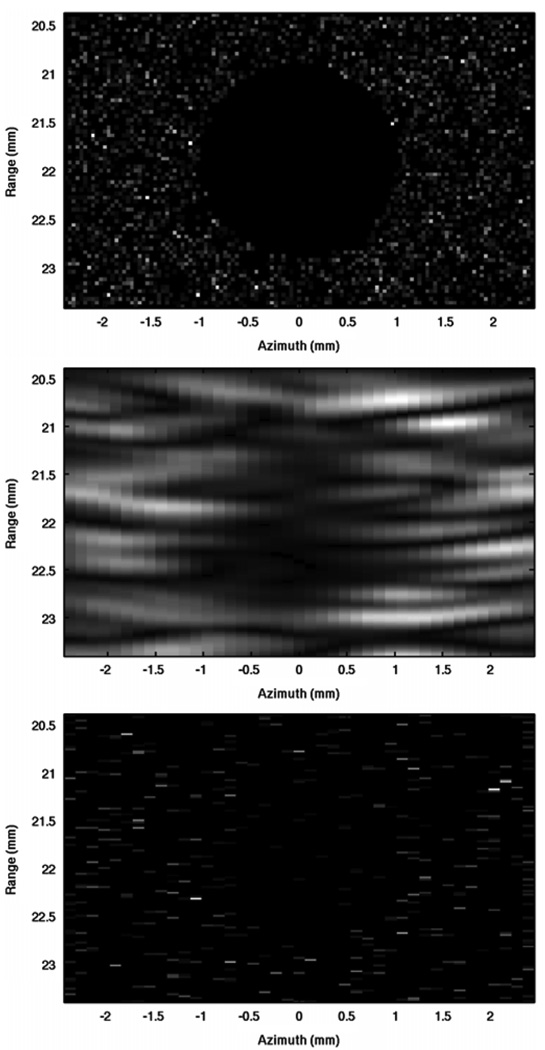
A 1-mm radius anechoic cyst was simulated in front of the array and surrounded by ultrasonic scatterers randomly distributed within the image region. Roughly 4000 scatterers were placed within the ROI, providing more than the typical 15 scatterers per resolution cell needed to generate fully developed speckle [38]. Scatterers’ amplitudes followed a Gaussian distribution with zero mean and standard deviation of one. Simulation methods are the same as those described in the previous section, except that the hypothetical target sampling was reduced to 100 µm in azimuth. The positions of the scatterers do not necessarily coincide with the position of the hypothetical targets. Furthermore, as for the simulated wires, elevation effects were not considered.
D. Algorithm Robustness
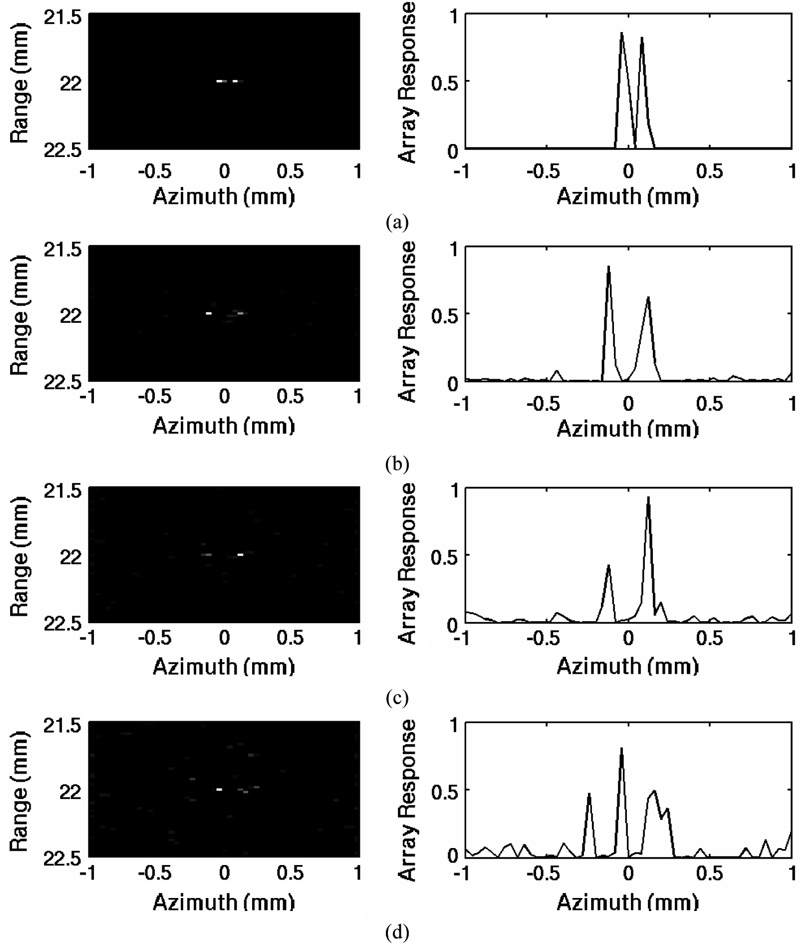
The simulations previously described were performed under ideal, noiseless conditions. Additional simulations were performed to test the robustness of TONE to various level of noise. We used the same simulation parameters as for the resolution simulation with 90 µm separation, except that Gaussian noise was added to each receive channel. In order to mimic RF data after the bandpass filtering step, the noise was bandpass filtered using a 101-tap FIR filter to match the bandwidth of the received RF signals before summation. We analyzed the cases of 30 dB, 20 dB, and 10 dB per channel signal-to-noise ratios (SNRs) before filtering.
IV. EXPERIMENTAL METHODS
Experiments were performed using a Philips SONOS 5500 imaging system employing a 6-MHz linear array. The target consisted of a set of five 20-µm-diameter stainless steel wires (California Fine Wire Company, Grover Beach, CA) suspended in a water tank at room temperature. The wires were placed at a distance of roughly 2.2 cm from the transducer’s face. The imaging system was programmed to transmit on all 128 elements simultaneously to simulate a plane wave. The received data was obtained by stepping sequentially through each of the 128 receive channels. Received data was filtered using a 100-tap FIR filter with pass-band between 3 and 11 MHz before beamforming. TONE was applied on a 32-processor SGI Altix server with the aid of the Star-P parallel computing platform (Interactive Supercomputing, Inc.). In all the experiments described here, the ROI was sampled with hypothetical targets placed every 19 µm axially (which corresponds to the temporal sampling rate of the system) and every 67 µm laterally (one half of the element pitch). The array manifold matrix was constructed as follows. The reference waveform was obtained by measuring the response from a single steel wire in water (elevation effects were ignored). For every hypothetical target location within the ROI, the reference waveform was re-interpolated and delayed using the corresponding geometrical delay profile. No attempt was made to incorporate element angular response, attenuation, or spatial variations in the transmit beam in the array manifold matrix.
V. RESULTS
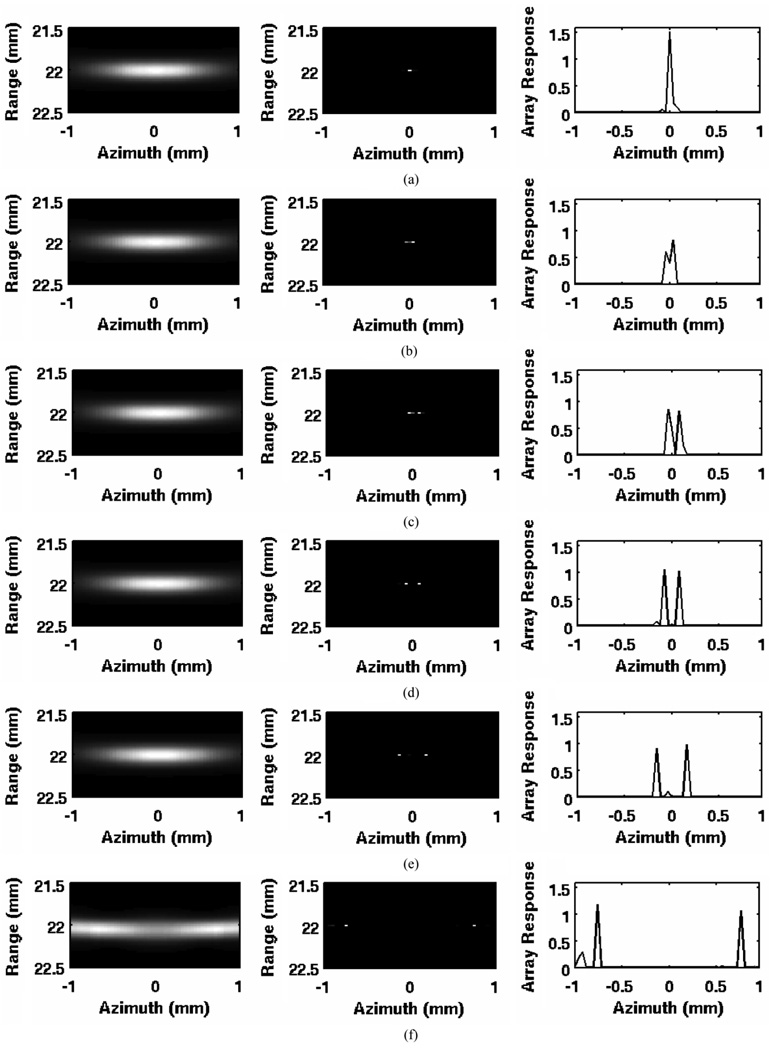
Fig. 3 shows the results given by TONE for two ideal point targets with varying amounts of separation. For these simulations, the hypothetical targets are placed every 20 µm axially and every 40 µm laterally. None of the ideal point targets are aligned with any of the hypothetical targets. Although the two point targets are indistinguishable with only 50 µm of separation, they become resolvable with 60 µm of separation and are fully resolved with 90 µm of separation. This is nearly an order of magnitude improvement in resolution as compared to CBF with a 32 element linear array operating at 5 MHz with 150 µm element pitch. It is important to note that the final resolution of TONE is strongly dependent upon the hypothetical target sampling. This suggests that a finer sampling than that used here would yield even finer resolution. Nonetheless, resolution is significantly improved using TONE, as demonstrated in Fig. 3. Furthermore, the results of these simulations suggest the following. In current ultrasound imaging there exists a trade off between spatial resolution and penetration depth. While higher frequencies produce images with higher spatial resolution, image depth is limited by the frequency dependent tissue attenuation. Since TONE’S final resolution is dependent upon hypothetical target sampling, it should be possible to use lower frequencies to increase penetration without sacrificing image resolution.
Fig. 3.
Simulated lateral resolution of TONE for a 32 element linear array operating at 5 MHz with 70% bandwidth. Hypothetical targets were placed every 20 µm axially and every 40 µm laterally. The left panels show the output images from a CBF, the central panels show the output image from TONE, and the right panels show axially integrated TONE images. Set (a) shows the case where the point targets are separated by 50 µm; (b)–(f) correspond to point target separations of 60, 90, 150, 300, and 1500 µm, respectively. Note that TONE lateral resolution is a function of the hypothetical target sampling.
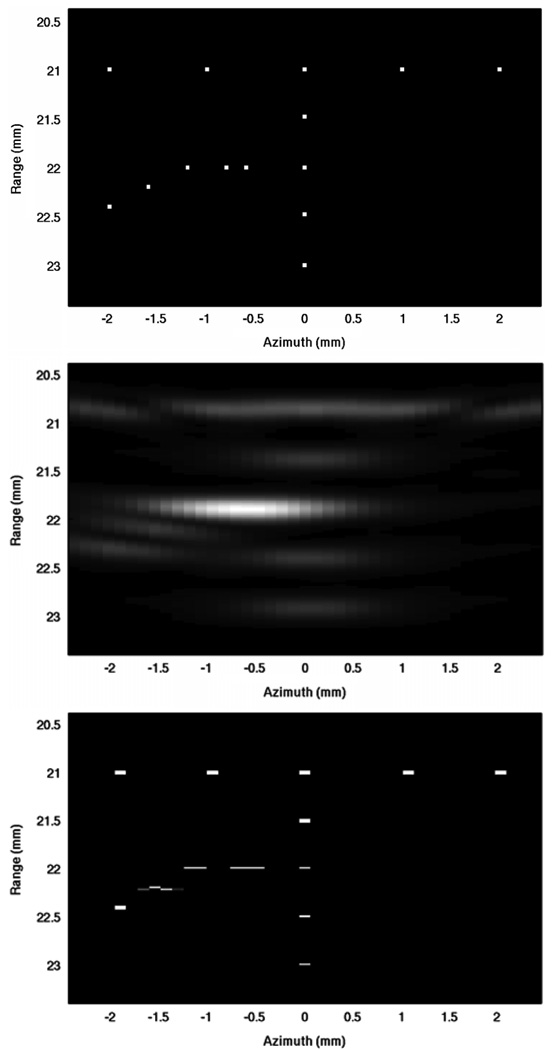
Point targets simulation results are presented in Fig. 4. The top panel shows the spatial distribution of the points within the ROI. The points’ spacing ranged between 1 mm and 200 µm in both dimensions. The middle panel of this figure depicts results obtained using conventional beamforming. Hann apodization was used on receive and dynamic receive focusing was applied. While some discrete points are detectable using this beamforming scheme, many are unresolved. The last image of Fig. 4 shows the TONE beamformed set of points. As Fig. 4 clearly indicates, TONE produces results with higher contrast and resolution when compared to the conventional technique. Nearly all the targets are clearly detectable, even when they do not lie at hypothetical target locations.
Fig. 4.
Simulated point targets. Top panel shows the spatial configuration of the wire targets. Second and third panels show the results obtained with conventional beamforming and TONE, respectively. Images are displayed on a linear brightness scale.
As stated above, simulations were performed using a 32-element aperture and a simulated plane wave on transmit. The use of a plane wave allowed for an easier and more compact description of the array manifold matrix, while the choice of the aperture size was dictated by the compromise between performance and computational complexity. Obviously, the use of a larger aperture will generate better images for the delay-and-sum beamformer. However, the improvement achieved through these conventional methods will still produce results that are inferior to those observed for TONE.
Fig. 5 depicts the results from the anechoic cyst phantom simulation. The cyst has a 1 mm radius and is surrounded by scatterers. A schematic of the cyst phantom is shown in the top panel of this figure. The second and third panels show the conventional and TONE beamformed images, respectively. The conventional method provides enough resolution and contrast to detect the presence of an anechoic region, even though the shape and size of the original cyst is completely lost. In the case of TONE, the shape of the anechoic cyst is preserved and a series of point scatterers are visible surrounding the cyst.
Fig. 5.
Simulated anechoic cyst in a speckle generating background. Top panel shows the spatial configuration of the anechoic cyst and the surrounding scatterers. Scond and third panels show the results obtained with conventional beamforming and TONE, respectively. Images are displayed on a linear brightness scale.
It is noticeable from Fig. 5 that the scatterers estimated using TONE do not correspond with the scattering map presented in the top panel of the figure. One possible explanation could be that hypothetical targets were placed too coarsely throughout the ROI. A finer sampling grid will yield a more dense distribution of point scatterers. It is also important to recall that amongst the infinite solutions of the underdetermined reconstruction, TONE converges toward the solution that minimizes the energy of the signal vector f, as expressed by (4). We also analyzed the amplitude histogram of the scatterers determined by TONE and found that they follow the expected zero mean Gaussian distribution.
Additional simulations were performed to evaluate the robustness of the algorithm to additive noise. For this set of simulations, we analyzed the performance of TONE using both RF and In-phase/Quadrature (IQ) data. We have found empirically that complex demodulated IQ data yields the best results when applying TONE. This could be explained by the fact that RF signals possess higher frequency content than IQ signals. This implies that when a mismatch occurs between the model (i.e., the array manifold matrix) and the actual data, in this case due to the addition of noise, the RF signals degrade faster than the IQ. The cost in this case is that IQ data occupy twice the memory required for RF signals since there is one real and one imaginary sample for every original RF sample. In Fig. 6, we show the results of the simulations when IQ data is used. In this figure, each panel corresponds to a different level of noise that was added to achieve a desired SNR. Fig. 6(a) shows the ideal case, when no noise is added to the RF data and the two point targets are clearly visible at a depth of 22 mm. In Fig. 6(b), Gaussian noise was added in order to achieve a “per channel” SNR of 30 dB. In this case, a cloud of scatterers surrounds the original point targets. As the SNR is decreased to 20 dB [Fig. 6(c)] and 10 dB [Fig. 6(d)] per channel, the cloud expands and covers a larger region. As expected, performance deteriorates as noise increases even though the original point target is accurately detected by TONE.
Fig. 6.
Simulated robustness of TONE to additive noise. Additive noise was filtered to match the bandwidth of the received signals. Complex demodulated signals were used to generate this set of figures. Left panels show the images generated by TONE while the right panels show their respective axially integrated images. Set (a) shows the ideal case when no noise is added; (b)–(d) correspond to “per channel” SNR levels of 30 dB, 20 dB, and 10 dB, respectively. Images are displayed on a linear brightness scale.
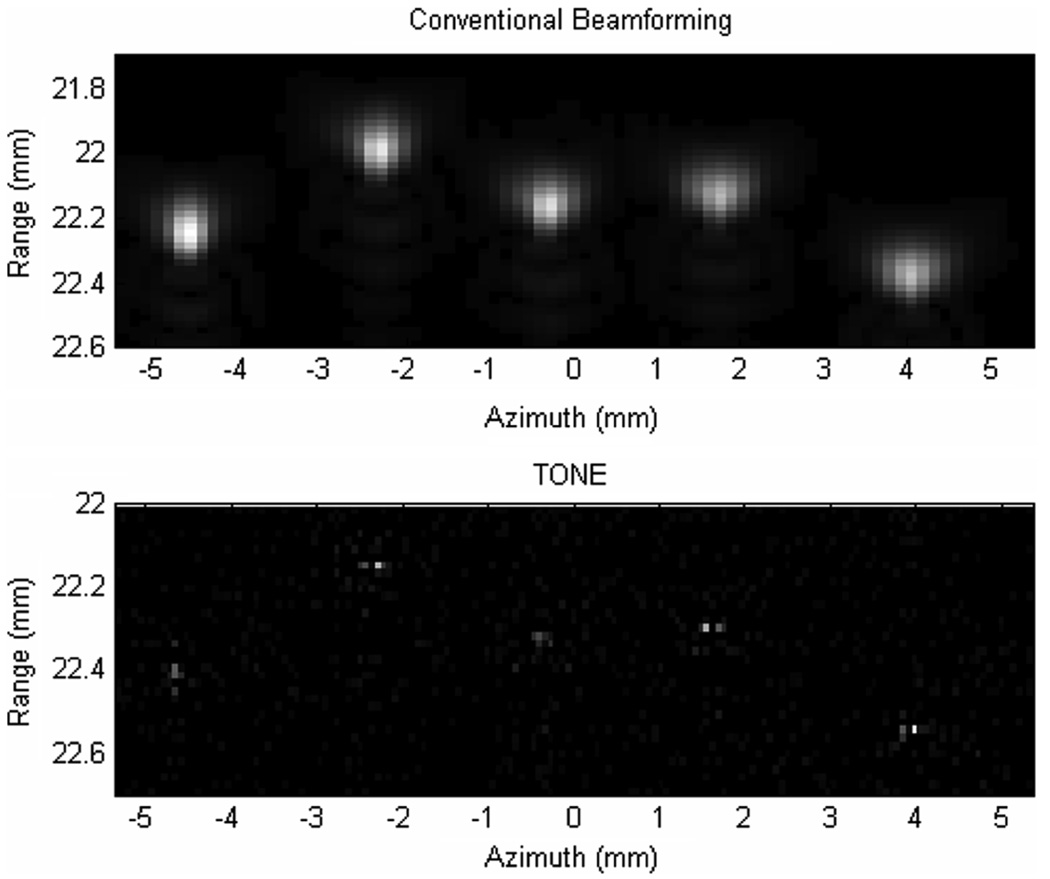
Experimental results are presented in Fig. 7–Fig. 9. The top panel of Fig. 7 shows the conventional B-mode image of the five wires output by the Philips SONOS imaging system, whereas the bottom panel shows the TONE reconstructed image. This result is similar to that obtained in Fig. 4 for simulated point targets. Although the five wire targets are clearly resolved by TONE, a small cloud of scatterers is visible around them. This is most likely due to noise and imperfection of the array manifold matrix used to reconstruct the imaging field. As stated above, the manifold matrix was generated by simply delaying and reinterpolating the response obtained from a single steel wire. More sophisticated models could be generated which would include, for example, the effects of element angular sensitivity. Furthermore, the current formulation of TONE is derived for a plane wave transmission. This was approximated in the experiments presented here by transmitting simultaneously on all 128 elements.
Fig. 7.
Experimental comparison of conventional beamforming (top) and TONE beamformed (bottom) images of a set of five 20-µm-diameters stainless steel wires suspended in a water tank. In the case of TONE hypothetical targets were placed every 19 µm axially and every 67 µm laterally. Images are displayed on a linear brightness scale.
Fig. 9.
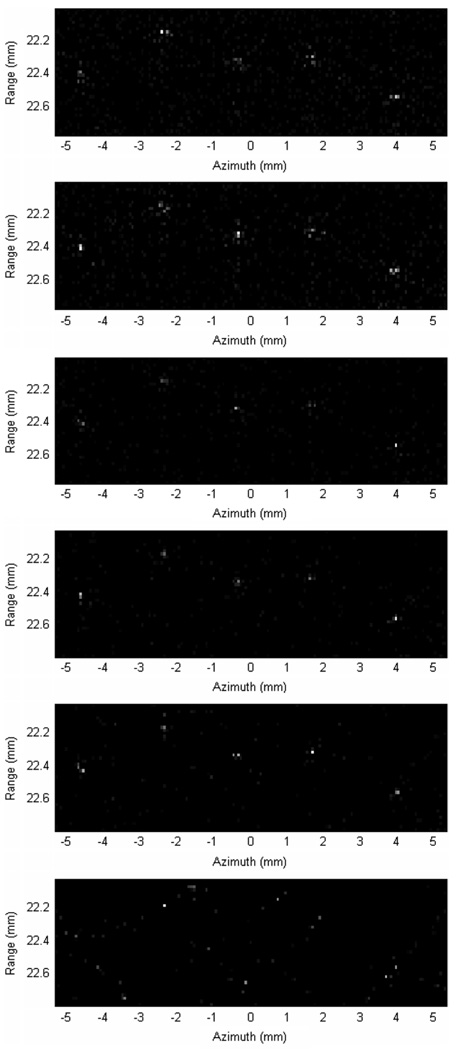
Experimental assessment of sparsity. TONE beamforming of the five steel wires with (from top to bottom): 64, 32, 16, 8, 4, and 2 receive channels. Images are displayed on a linear brightness scale.
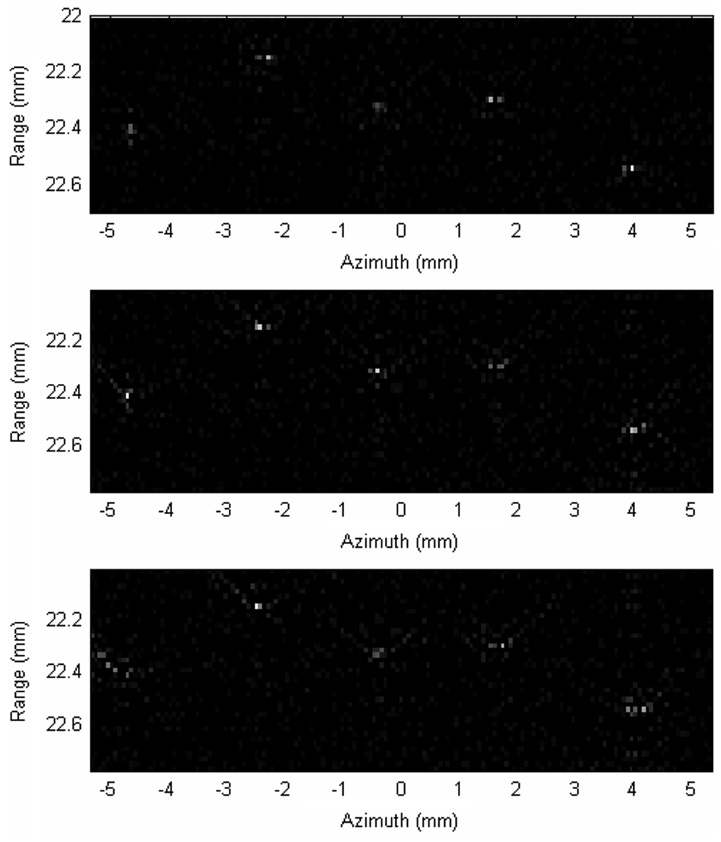
We have also analyzed the performance of TONE as a function of mismatched speed of sound. In this case the array manifold matrix was constructed using a speed of sound that differs from the assumed true value of 1480 m/s. Results obtained for errors of 15 m/s and 30 m/s are shown in the top and bottom panels of Fig. 8, respectively. Obviously, as error increases performance starts to deteriorate. However, these results are significant since most adaptive beamforming algorithms rapidly degrade when ideal conditions are not met.
Fig. 8.
Experimental assessment of sensitivity to errors in speed of sound. TONE beamformed images of the five steel wires with no error (top), 15 m/s (middle), and 30 m/s (bottom) mismatch in speed of sound. Images are displayed on a linear brightness scale.
Finally, we investigated the behavior of TONE with missing receive channels. While the images shown in Fig. 7 and Fig. 8 were generated using the full 128 channels provided by the SONOS (135 µm pitch), Fig. 9 shows the results obtained when the number of channels is reduced to 64, 32, 16, 8, 4, and finally 2 (equally spaced channels using the full aperture). The corresponding element pitches are 270, 540 µm, 1.08 mm, 2.43 mm, 5.67 mm, and 17.15 mm, respectively. This figure suggests that TONE performance is not affected by variations in channel number/pitch dimensions. While applying conventional beamforming on 8 receive channels with 2.43-mm pitch would result in massive grating lobes, this figure shows that TONE remains almost unaffected. The five wires are also detectable when only four receive channels are used for the reconstruction, but the reconstruction fails when only two receive channels are used. We hypothesize that in the case of two channels, the received data does not hold sufficient information about the spatial responses of the actual scatterers within the ROI therefore disrupting the reconstruction process. It also appears from this figure that using 16 or fewer channels reduces the amount of clutter around the wires. In this case we hypothesize that there are two main factors to consider. First, by reducing the number of receive channels, small errors in the definition of the spatial responses become less significant compared to the case of the full aperture (or to the case of higher channel count). However, reducing channel count will eventually diminish the available information, as shown in the bottom panel for 2 channels. Nonetheless, the result presented in this figure could be important for 2-D arrays that rely on sparsity to reduce channel count.
VI. DISCUSSION
The results presented in this paper show that under the analyzed conditions TONE outperforms conventional delay-and-sum beamforming. TONE assumes an observation model based superposition of spatial responses as indicated by (1). This model is then used to formulate a MAP algorithm that finds the distribution and amplitude of hypothetical targets that matches the observed data with minimal target energy. It is important to note that even though TONE uses such linear model, it is possible to model effects such as attenuation and non-linear propagation by simply redefining each of the columns (i.e., the spatial responses) of the array manifold matrix. In other words, the individual spatial responses can be constructed ad hoc to model any particular imaging scenario; TONE assumes that the received data set can be modeled as the superposition of those individual responses and that the first Born approximation regarding secondary scattering is satisfied. Furthermore, while other linear models have been described that specifically include the effects of noise [42], [43], these effects were not included in the work presented here. We are currently working toward extending the mathematical formulation of TONE to specifically include the contribution of noise.
The experimental TONE images shown in this paper reveal small amounts of clutter surrounding the wire targets, which causes a reduction in the effective contrast of the images. One possible cause for this clutter is the sparseness of the grid of hypothetical targets. Unless the point target lies exactly on one of the hypothetical targets, it is not possible for TONE to perfectly match the data to the system model. It would be logical to assume that, when the point target lies between hypothetical targets, TONE would distribute energy to the hypothetical targets directly surrounding that target. However, due to the coherent nature of the system, it is possible that the sum of many hypothetical targets in a diffuse cloud around the actual target would produce a more optimal, lower energy solution. One way to reduce this effect is to treat each hypothetical target as a diffuse set of scatterers. Instead of each column of the manifold matrix being the system response from a single target, it would instead be the system response from a weighted set of scatterers surrounding that single point target. Therefore, when a point target lies between two hypothetical targets, TONE would be more likely to distribute energy to the targets directly surrounding that target, thereby reducing clutter in the output image. Although this modification would require more computation upfront, the manifold matrix would not change in size. If we precompute this manifold matrix and keep it stored, there would be no change in the computation time to beamform the data.
The images presented here also demonstrate increased spatial resolution of TONE when compared to conventional beamforming. While resolution in conventional beamforming is easily represented, resolution of TONE is much more complicated. We hypothesize that there is a resolution bound on TONE and other advanced beamforming algorithms that estimate the target field, similar to the bound currently available for time delay estimation. The key is that TONE is an estimation problem, not a simple beamformer. As shown in this paper, we have empirically found that sampling of the hypothetical target field, SNR, and model quality all impact apparent resolution.
Currently, the main limitation of TONE is its high computational complexity. The experimental images shown in this paper were obtained after roughly 22 min of computation on the high power cluster provided by Interactive Supercomputing. Furthermore, while higher spatial resolution is achieved by using finer sampling of the ROI, this also incurs higher computational complexity. In our experience, the generation of the manifold matrix and the iterative procedure to estimate f represent the most costly steps. For an image region of 1 cm × 1 cm and assuming a sampling grid of hypothetical targets of 20 µm × 70 µm, V is on the order of 64K by 71 K elements for a total of 4544 M elements. However, for a given ROI and desired sampling grid, the manifold matrix can be calculated in advance and stored for later use, reducing the computational cost for most applications. Furthermore, TONE may also be applied to a given receive data set using a variety of iterative approaches to reduce the required computational complexity and data storage size. In one such approach, the complete received data set is subdivided into multiple data segments that may or may not be uniformly sampled and may or may not overlap. For each received data segment, a distinct array manifold matrix would be formed to represent the responses from hypothetical targets which contribute to the specific data segment. TONE could then be applied separately to each of the data segments and their matched array manifold matrices. We are currently investigating this and other approaches.
VII. CONCLUSION
The application of advanced beamforming methods in medical ultrasound can significantly improve overall image quality. Most of the adaptive algorithms developed for RADAR and SONAR fail when applied to medical ultrasound data. This can be attributed to some or all of the following factors: ultrasound operates in a near-field scenario, signals are broadband, and ultrasound has limited statistical information available.
In this paper we have presented an algorithm, named TONE, which is well suited to medical ultrasound since it requires neither a far-field/narrow-band assumption nor second order statistics of the signals. Under all the simulations and experiments performed, TONE showed a significant improvement in resolution and contrast when compared to conventional, data independent beamforming.
ACKNOWLEDGMENT
The authors would like to acknowledge technical support from Interactive Supercomputing, Inc., and M. Poland from Philips Medical Systems.
This work was supported by the U.S. Army Congressionally Directed Medical Research Program in Breast Cancer under Grant W81XWH-04–1-0590.
Contributor Information
Francesco Viola, Department of Biomedical Engineering, University of Virginia, Charlottesville, VA 22908 USA (e-mail: fv7d@Virginia.edu).
Michael A. Ellis, Department of Biomedical Engineering, University of Virginia, Charlottesville, VA 22908 USA
William F. Walker, Department of Biomedical Engineering, University of Virginia, Charlottesville, VA 22908 USA.
REFERENCES
- 1.Haykin S. Adaptive Filter Theory. 4th ed. Upper Saddle River, NJ: Prentice-Hall; 2002. [Google Scholar]
- 2.Veen BDV, Buckley KM. Beamforming: A versatile approach to spatial filtering. IEEE ASSP Mag. 1988 Apr.vol. 5(no. 2):4–24. [Google Scholar]
- 3.Gabriel WF. Adaptive processing array systems. Proc. IEEE. 1992 Jan.vol. 80(no. 1):152–162. [Google Scholar]
- 4.Capon J. High resolution frequency-wavenumber spectrum analysis. Proc. IEEE. 1969 Aug.vol. 57(no. 8):1408–1418. [Google Scholar]
- 5.Frost OL., III An algorithm for linearly constrained adaptive array processing. Proc. IEEE. 1972 Aug.vol. 60(no. 8):926–935. [Google Scholar]
- 6.Gabriel WF. Using spectral estimation techniques in adaptive processing antenna systems. IEEE Trans. Antennas Propag. 1986 Mar.vol. AP-34(no. 3):291–300. [Google Scholar]
- 7.Kogon SM. Experimental results for passive sonar arrays with eigenvector-based adaptive beamformers. 36th Asilomar Conf. Signals, Syst. Computers. 2002;vol. 1:439–447. [Google Scholar]
- 8.Abraham DA, Owsley NL. Beamforming with dominant mode rejection. Proc. Oceans Conf. 1990:470–475. [Google Scholar]
- 9.Subbaram H, Abend K. Interference suppression via orthogonal projections: A performance analysis. IEEE Trans. Antennas Propag. 1993 Sep.vol. 41(no. 9):1187–1194. [Google Scholar]
- 10.Behrens RT, Sharf LL. Signal processing applications of oblique projection operators. IEEE Trans. Signal Proc. 1994 Jun.vol. 42(no. 6):1413–1424. [Google Scholar]
- 11.Feldman DD, Griffiths LJ. A projection approach for robust adaptive beamforming. IEEE Trans. Signal Process. 1994 Apr.vol. 42(no. 4):867–876. [Google Scholar]
- 12.Stoica P, Wang Z, Li J. Robust capon beamforming. IEEE Trans. Signal Proc. Lett. 2003 Jun.vol. 10(no. 6):172–175. [Google Scholar]
- 13.Cox H. Adaptive beamforming in non-stationary environments. 36th Asilomar Conf. Signals, Syst. Computers. 2002;vol. 1:431–438. [Google Scholar]
- 14.Greening MV, Perkins JE. Adaptive beamforming for nonstationary arrays. J. Acoust. Soc. Am. 2002;vol. 112(no. 6):2872–2881. doi: 10.1121/1.1514931. [DOI] [PubMed] [Google Scholar]
- 15.Gerstoft P, Hodgkiss WS, Kuperman WA, Song H, Siderius M, Nielsen PL. Adaptive beamforming of a towed array during a turn. IEEE J. Oceanic Eng. 2003 Jan.vol. 28(no. 1):44–54. [Google Scholar]
- 16.Ali ME, Schreib F. Adaptive single snapshot beamforming: A new concept for the rejection of nonstationary and coherent interferers. IEEE Trans. Signal Process. 1992 Dec.vol. 40(no. 12):3055–3058. [Google Scholar]
- 17.Sarkar TK, Park S, Koh J, Schneible RA. A deterministic least squares approach to adaptive antennas. Digital Signal Proc. 1996;vol. 6:185–194. [Google Scholar]
- 18.Bethel R, Shapo B, Van Trees HL. Single snapshot spatial processing: Optimized and constrained. Sensor Array Multichannel Signal Process. Workshop Proc. 2002 Aug.:508–512. [Google Scholar]
- 19.Viberg M, Swindlehurst AL. A Bayesian approach to auto-calibration for parametric arrays signal processing. IEEE Trans. Signal Process. 1994 Dec.vol. 42(no. 12):3495–3507. [Google Scholar]
- 20.Radich BM, Buckley KM. Single-snapshot DOA estimation and source number detection. IEEE Trans. Signal Process. 1997 Apr.vol. 4(no. 4):109–111. [Google Scholar]
- 21.Cekli E, Cirpan HA. Deterministic maximum likelihood method for the localization of near-field sources: Algorithm and performance analysis. 8th IEEE Int. Conf. Electronics, Circuits Syst. 2001;vol. 2:1077–1080. [Google Scholar]
- 22.Tu M-W, Gupta IJ, Walton EK. Application of maximum likelihood estimation to radar imaging. IEEE Trans. Antennas Propag. 2002 Jan.vol. 45(no. 1):20–27. [Google Scholar]
- 23.Malioutov DM, Cetin M, Fisher JW, III, Willsky AS. Super-resolution source localization through data-adaptive regularization. Sensor Array Multichannel Signal Process. Workshop Proc. 2002:194–198. [Google Scholar]
- 24.O’Brien RT, Kiriakidis K. Single-snapshot robust direction finding. IEEE Trans. Signal Process. 2005 Jun.vol. 53(no. 6):1964–1978. [Google Scholar]
- 25.Shung KK, Thieme GA. Ultrasonic Scattering in Biological Tissues. Boca Raton, FL: CRC Press; 1993. [Google Scholar]
- 26.Widrow B, Duvall KM, Gooch RP, Newman WC. Signal cancellation phenomena in adaptive antennas: Causes and cures. IEEE Trans. Antennas Propag. 1982 May;vol. AP-30(no. 3):469–478. [Google Scholar]
- 27.Agrawal M, Prasad S. Robust adaptive beamforming for wideband, moving, and coherent jammers via uniform linear arrays. IEEE Trans. Antennas Propag. 1999 Aug.vol. 47(no. 8):1267–1275. [Google Scholar]
- 28.Su Y-L, Shan T-J, Widrow B. Parallel spatial processing: A cure for signal cancellation in adaptive arrays. IEEE Trans. Antennas Propag. 1986 Mar.vol. AP-34(no. 3):347–355. [Google Scholar]
- 29.Luthra AK. A solution to the adaptive nulling problem with a look-direction constraint in the presence of coherent jammers. IEEE Trans. Antennas Propag. 1986 May;vol. AP-30(no. 5):702–710. [Google Scholar]
- 30.Qian F, van Veen BD. Partially adaptive beamforming for correlated interference rejection. IEEE Trans. Signal Process. 1995 Feb.vol. 43(no. 2):506–515. [Google Scholar]
- 31.Shan T-J, Kailath T. Adaptive beamforming for coherent signals and interference. IEEE Trans. Acoust., Speech, Signal Process. 1985 Jun.vol. ASSP-33(no. 3):527–536. [Google Scholar]
- 32.Mann JA, Walker WF. Constrained adaptive beamforming: Point and contrast resolution. Proc. SPIE. 2003;vol. 5035:12–23. [Google Scholar]
- 33.Mann JA, Walker WF. A constrained adaptive beamformer for medical ultrasound: Initial results. Proc. IEEE Ultrasonic Symp. 2002;vol. 2:1807–1810. [Google Scholar]
- 34.Wang Z, Li J, Wu R. Time-delay- and time-reversal-based robust capon beamformers for ultrasound imaging. IEEE Trans. Med. Imag. 2005 Oct.vol. 24(no. 10):1308–1322. doi: 10.1109/TMI.2005.857222. [DOI] [PubMed] [Google Scholar]
- 35.Synnevag J-F, Austeng A, Holm S. Minimum variance adaptive beamforming applied to medical ultrasound imaging. IEEE Ultrasonic Symposium. 2005 [PubMed] [Google Scholar]
- 36.Lo KW. Adaptive array processing for wide-band active sonars. IEEE J. Oceanic Eng. 2004 Jul.vol. 29(no. 3):837–846. [Google Scholar]
- 37.Jensen JA, Svendsen NB. Calculation of pressure fields from arbitrarily shaped, apodized, and excited ultrasound transducers. IEEE Trans. Ultrason., Ferroelect., Freq. Cont. 1992 Mar.vol. 39(no. 2):262–267. doi: 10.1109/58.139123. [DOI] [PubMed] [Google Scholar]
- 38.Wagner RF, Smith SW, Sandrik JM, Lopez H. Statistics of speckle in ultrasound B-scans. IEEE Trans. Sonics Ultrason. 1983 Mar.vol. 30(no. 3):156–163. [Google Scholar]
- 39.Scharf LL. Statistical Signal Processing: Detection, Estimation, and Time Series Analysis. Reading, MA: Addison Wesley; 1991. [Google Scholar]
- 40.Sasso M, Cohen-Barcie C. Medical ultrasound imaging using the fully adaptive beamformer. Proc. Acoustics, Speech Signal Process. 2005 Mar.:489–492. [Google Scholar]
- 41.Lavarello R, Kamalabadi F, O’Brien WD. A regularized inverse approach to ultrasonic pulse-echo imaging. IEEE Trans. Med. Imag. 2006 Jun.vol. 25(no. 6):712–722. doi: 10.1109/tmi.2006.873297. [DOI] [PubMed] [Google Scholar]
- 42.Stoughton R, Strait S. Source imaging with minimum mean-square error. J. Acoust. Soc. Am. 1993;vol. 94(no. 2):827–834. [Google Scholar]
- 43.Lingvall F. A method of improving overall resolution in ultrasonic array imaging using spatio-temporal deconvolution. Ultrasonics. 2004;vol. 42:961–968. doi: 10.1016/j.ultras.2003.12.016. [DOI] [PubMed] [Google Scholar]
- 44.Ellis MA, Guenther DA, Walker WF. A spline-based approach to computing spatial impulse responses. IEEE Trans. Ultrason., Ferroelect., Freq. Control. 2007 May;vol. 54(no. 5):1045–1054. doi: 10.1109/tuffc.2007.350. [DOI] [PubMed] [Google Scholar]


