Abstract
In dual-beam depth profiling, a high energy analysis beam and a lower energy etching beam are operated in series. Although the fluence of the analysis beam is usually kept well below the static SIMS limit, complete removal of the damage induced by the high energy analysis beam while maintaining a good depth resolution is difficult. In this study a plasma polymerized tetraglyme film is used as the model organic system and the dimensionless parameter R, (analysis beam fluence)/(total ion fluence), is introduced to quantify the degree of sample damage induced as a function of the analysis beam fluence. It was observed for a constant C60+ etching beam fluence, increasing the analysis fluence (and consequently increasing the R parameter) increased in the amount of damage accumulated in the sample. For Bin+ (n = 1 and 3) and C60+ depth profiling, minimal damage accumulation was observed up to R = 0.03, with a best depth resolution of 8 nm. In general, an increase in the Bin+ analysis fluence above this value resulted in a decrease in the molecular signals of the steady state region of the depth profile and a degradation of the depth resolution at the polymer/substrate interface.
Keywords: C60, Bi, cluster beams, molecular, depth profiling, chemical damage, dual beam, co-sputtering
1. Introduction
Time-of-flight secondary ion mass spectroscopy (ToF-SIMS) is a widely used technique for depth profiling applications in many areas, and has progressively expanded from microelectronics to materials science to biology.1-9 ToF-SIMS depth profiling is complementary to other analysis techniques such as X-ray photoelectron spectroscopy (XPS) because of its better spatial and depth resolutions, along with the molecular specificity and high mass resolution that is unique to mass spectrometry. The increased use of ToF-SIMS in biological applications coincides with the recent development of cluster ion sources. Polyatomic primary ions such as Binq+ (n = 1-7, q = 1 and 2)10 and C60q+ probes (q = 1-3)11,12 produce a significant increase in the secondary ion yields, including yield enhancements in the high mass region of the spectrum.13 Yield enhancements in general have led to improved sensitivity, and the desorption of high mass fragments that contain a large amount of chemical and molecular information are extremely useful for the study of organic and biological analytes.4,8 However, since ToF-SIMS relies on the bombardment of highly energetic ions for the emission of secondary ions, the samples are prone to chemical damage. The use of cluster ions alleviates this problem since they have been shown to leave less residual chemical damage than monatomic ions due to their larger size, shallower implantation depth and higher sputter yields.2 For these reasons, cluster ions are thought to be the optimal medium for the successful molecular depth profiling of most organic and biological samples.2
ToF-SIMS depth profiling is frequently performed in the dual-beam mode, where the analysis sequence is decoupled from the etching sequence by alternating two or more ion beams.14 The analysis is typically performed using a liquid metal ion gun (LMIG) generating a high energy pulsed ion beam (e.g., Bi1+ or Bi3+ at 25 keV and 0.1 pA) which can be focused down to 150 nm, whereas etching is performed using a high current but lower energy source (e.g., C60+ at 10 keV and 1 nA). The dual-beam approach thus exploits the full capabilities of the ToF-SIMS technique by combining the high mass and lateral resolutions of LMIG beams with the lower energy beams that induce less damage and mixing, leading to an improved depth resolution. Although the use of cluster ions such as Bi3+ for the analysis beam causes less chemical damage than monatomic ions, it is still a high energy source that can lead to some accumulation of damage. Since the successful depth profiling of organic and biological samples require minimal fragmentation of molecules, it is essential to account for the chemical damage incurred by irradiation with energetic primary ions.
The effect of the analysis and etching beam parameters on the quality of ToF-SIMS depth profiles have been studied for inorganic samples,15 and it has been shown that the energy of the primary ion beam strongly influences both the lateral and the depth resolutions. The influence of the etching beam parameters on the quality of molecular depth profiles has also been widely studied and modeled (see 4 for a recent review). However, the influence of the analysis beam is often neglected when depth profiling organic samples in the dual-beam mode, assuming that no chemical damage is induced in the sample if the primary ion fluence is maintained below the SIMS static limit (often reported to be at or below 1013 atoms per cm2).1,4 Determining the influence of both the analysis and the etching beams on the quality of molecular depth profiles is essential for 3D imaging of complex biological samples. These samples are highly heterogeneous, and the analysis beam fluence is usually increased to enhance the signal to noise ratio for the low-yield high-mass fragments.
In this study, the effect of both the analysis and etching beam on the quality of molecular ToF-SIMS depth profiles was investigated quantitatively for an organic sample. For this purpose, a tetraglyme layer with a nominal thickness of 100 nm was plasma polymerized onto a silicon wafer and then was depth profiled in the single beam and dual-beam modes using different primary ions (Bi1+, Bi3+, C60+, etc.) and bombardment parameters (energy, fluence, etc.). The quality of ToF-SIMS depth profiles was studied by comparing the molecular secondary ion yields and the depth resolutions of the resulting depth profiles.
2. Experimental
2.1. Materials
Tetraethylene glycol dimethyl ether (tetraglyme, > 99%) monomer was obtained from Aldrich Chemical Corp. (Milwaukee, WI) and used as received. 10 cm silicon wafers were purchased from VWR Scientific Inc. (Seattle, WA), and cut into 1 × 1 cm2 pieces using a Kuliche & Soffa 780 dicing saw with a 15 μm diamond impregnated blade (Willow Grove, PA). Distilled water was used to wash away any dicing dust. The silicon pieces were then ultra-sonicated sequentially for five minutes each in methylene chloride, acetone, and methanol (VWR Scientific Inc.) to remove any contaminants.
2.2. Radio-frequency glow discharge (RFGD) plasma deposition of tetraglyme
The capacitively coupled, external electrode RFGD plasma deposition system has been described in detail elsewhere.16 The RF used was 13.56 MHz. The glass tubular reactor walls were heated to prevent condensation of tetraglyme using electrical heating tapes (VWR Scientific, Inc.). Tetraglyme monomer was degassed by three cycles of liquid nitrogen freezing and thawing. The monomer was preheated to 90 °C to evaporate water molecules from the liquid. Tetraglyme was then vaporized by heating at 105 – 110 °C, and was allowed to flow into the reactor at a rate of 1.55 sccm at 350 mTorr. The RF plasma was maintained at 10 W for 30 minutes to create layers ~100 nm thick, and then quenched immediately to prevent monomer deposition. The samples were taken out, and used without any modification or soaking. Quality control was done by randomly measuring the RMS roughness of the deposited films (< 0.8 nm).
Due to its non-fouling property and ease of preparation, the plasma deposited tetraglyme film has been used and studied extensively in our lab as a protein resistant biomaterial surface. Numerous studies with XPS have shown that the quality and homogeneity of the film is consistently reproducible.16-19 In addition, our studies show that the film is consistently smooth (RMS roughness < 0.8 nm) and allows depth profiling without significant polymer cross-linking.
2.3. Atomic force microscopy (AFM)
To measure the thickness of tetraglyme films, a Dimension 3100 AFM from Veeco Metrology Inc. (Santa Barbara, CA) was equipped with a 315 kHz, 42 N/m PointProbe Plus silicon tip from Nanosensors (Neuchâtel, Switzerland) and was operated in intermittent contact mode in air. The tetraglyme film was gently scratched with a clean scalpel blade (Ted Pella Inc., Redding, CA) and the step height was scanned with AFM. At least five locations were scanned per sample to determine the average thickness. The samples used in this work were between 66.0 and 71.3 nm thick. In any given sample, the thickness varied by no more than 5.0 nm.
2.4. Time-of-flight mass spectrometry (ToF-SIMS)
ToF-SIMS experiments were performed using an ION-TOF TOF.SIMS 5-100 (ION-TOF GmbH, Münster, Germany) equipped with two ion sources. A liquid metal ion gun (LMIG) was used to generate the pulsed 25 kV Binq+ (n = 1, 3; q = 1, 2) beam, whereas an electron impact gun was used to generate the 10 kV C60q+ (q = 1, 2, 3) beam. Both beams hit the target at an angle of 45°. In the dual-beam mode, the Bin+ beam was rastered over a 100 × 100 μm2 area and was centered inside the 500 × 500 μm2 C60q+ crater. In the single beam mode, the C60q+ was switched from high current analysis mode (bunched) to etching mode using a batch job written in our lab. In the single beam mode, the C60q+ analysis beam was typically rastered over a 25 × 25 μm2 area and was centered inside the 500 × 500 μm2 C60q+ crater. Depth profiles were acquired in the non-interlaced mode where the analysis and etching sequences were performed in different ToF-cycles.14 Target currents were measured separately before each depth profile using a Faraday cup, the Bin+ current was between 0.15 and 0.8 pA and the C60q+ current was between 0.01 pA and 1 nA, depending on the species and the beam parameters (see below). A low energy electron flood gun was used for charge compensation during all depth profiles. Sputtering yields were determined by dividing the total sputtered volume (using the size of the rastered area and the thickness measured by AFM) by the total primary ion fluence needed to reach the silicon interface. The density of the layers was assumed to be similar to that of bulk tetraglyme (1.01 g/cm3). The sputtering yield was assumed to remain constant during the depth profiles.
3. Results and discussion
To qualitatively visualize the effect of the Bin+ analysis beam on chemical damage accumulation in the tetraglyme layer, depth profiling was first done using C60 only to create a reference profile (C60q+ for both analysis and etching, referred to as C60 single beam from hereafter). The layer was then profiled using Bin+ and C60+ in the dual-beam mode (referred to as B1+/C60+ and Bi3+/C60+) with varying Bin+ fluences. The damage was then quantified by fitting the decay profile to an erosion model. For most of the measurements, the C60 etching parameters (i.e., 10 keV, 45°, 0.5 nA, 500 × 500 μm2) were kept constant while the analysis beam settings were varied. This approach was chosen to highlight the effect of the analysis beam parameters (i.e., species and fluence) on the quality of ToF-SIMS molecular depth profiles, taking the C60 single beam depth profile as a reference.
3.1. C60 single beam depth profiling of the tetraglyme layer
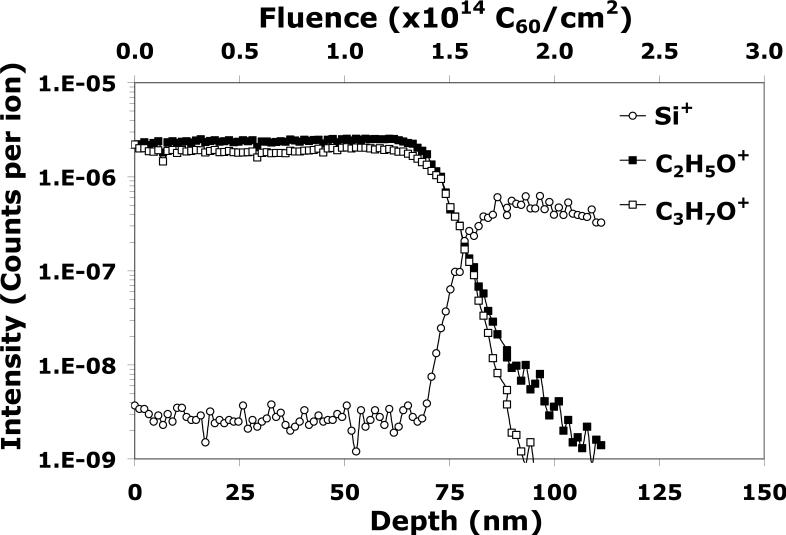
Single beam depth profiling with the C60 source serves two functions. As mentioned previously, the first is to build a reference model to assess the damage induced by the Bin+ analysis beam in the dual beam mode. The second is to evaluate whether C60 itself contributes to the accumulation of damage in a depth profile of tetraglyme. Figure 1 shows the single beam depth profile of tetraglyme using C60 as both the analysis beam (low current, pulsed and bunched, and small analysis area) and the etching beam (high current, wider etching area). The plot shows C2H5O+ and C3H7O+ signals as a function of both depth (bottom scale) and C60 fluence (top scale), since these fragments are the most intense and characteristic signals of tetraglyme.20 The silicon substrate is indicated by the appearance of the Si+ signal.
Figure 1.
A C60 single beam depth profile of the tetraglyme layer on silicon. The analysis beam is C60+ (0.01pA, 10 keV, 25 × 25 μm2) and the etching beam is C60+ (1 nA, 10 keV, 500 × 500 μm2).
A depth profile typically has three distinct sections, and its quality can be evaluated by measuring three parameters: the exponential decrease of the molecular signals in the initial transient region; the signal stability and the sputter/etching rate during the steady state region; and the depth resolution at the organic layer/Si substrate interface. As can be seen in Figure 1, the C2H5O+ signal increases slightly and the C3H7O+ signal decreases in the transient region, then both signals remain constant during the steady state region until the interface is reached. The flat steady state region and the minor changes in the transient region show that the tetraglyme sample is amenable to depth profiling with C60+ single beam at 10 keV and 45°. It should be also noted that higher mass tetraglyme fragments were also detected and were found to exhibit similar trends to those shown in Figure 1 (data not shown). Also, although the characteristic fragments shown in Figure 1 are relatively small (m/z = 45 and 59, respectively), it is interesting to observe that their yields do not decrease exponentially at the transient region as reported in the literature for many organic films and polymers.4,21-24 This result suggests that the C60 beam mainly “depolymerizes” the film (i.e., breaks the polymer along the backbone without modifying the structure of the depolymerized fragments). This suggests little, if any, residue chemical damage is accumulated in the tetraglyme film during C60 single beam depth profiling.
The depth resolution is an important aspect of molecular depth profiling and is usually estimated by measuring the interface width between the organic layer and the silicon substrate. However, this measurement is not straightforward because the etching rate of Si is significantly lower than most organic materials. Although there is no standardized measurement approach, the most accepted way is to estimate the interface width using the 84%-16% method.4 Since the depth profile data is output in the form of intensity as a function of time, this method defines the interface as the time at which the overlayer or the substrate signal intensity reaches 50% of its maximum value (C2H5O+ was used in this work). This time value is then used to normalize the depth profile in terms of intensity versus depth using the actual overlayer thickness as measured by AFM. The depth resolution is then calculated by measuring the amount of “depth” required for the overlayer intensity to decrease from 84% to 16% of its maximum value.
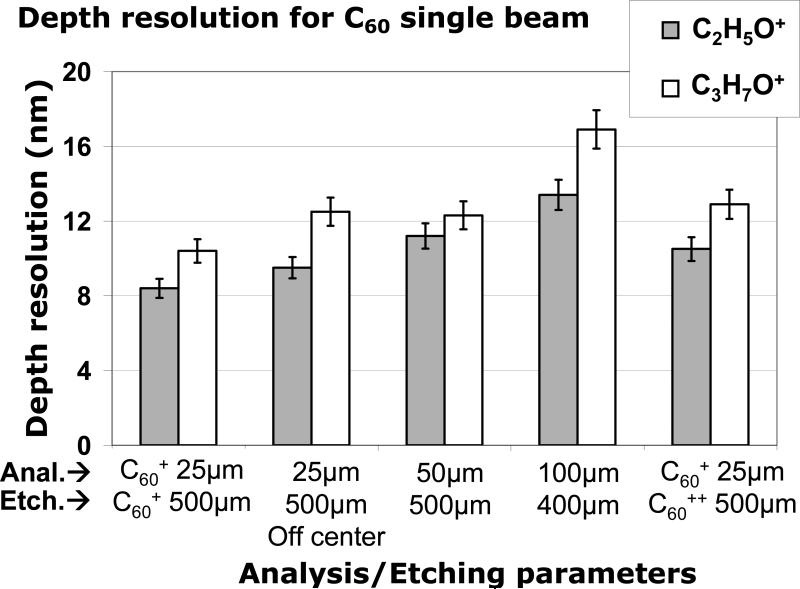
Comparing depth resolutions is also an effective way to optimize the quality of the depth profile. Figure 2 summarizes the resolutions of C60 single beam depth profiles when some of the experimental parameters are changed, such as increasing the analysis area, decreasing the etching area, and increasing the incident energy of the etching beam. The best resolutions of 8.4 ± 0.4 nm for C2H5O+ and 10.4_± 0.5 nm for C3H7O+ are obtained with the C60 beam operating at 10 keV for both analysis and etching, with an analysis area of 25 × 25 μm2 centered inside the 500 × 500 μm2 etching crater. The depth resolution was seen to degrade when the analysis area was moved to an off-center location, or was increased (50 × 50 and 100 × 100 μm2). Conversely, decreasing the etching crater size down to 400 × 400 μm2 also had a negative effect on the depth resolution. This result indicates that the ratio of analysis crater size to etching crater size should be minimized to obtain the best C60 single beam depth profiling. This can be attributed to the fact that the electron impact C60 source used in this work has limited lateral resolution (~28 μm in the bunched mode), causing the deterioration of the interface width due to the inhomogeneity of the sample thickness, which has been previously observed for other systems.25,26 Crater edge effects could also be partly responsible for the deterioration of the depth resolution observed for off-centered analysis areas and for large analysis areas in small etch craters (i.e., 100 × 100 μm2 inside 400 × 400 μm2).
Figure 2.
Depth resolution measured using the 84%-16% method for the C2H5O+ and C3H7O+ signals with different C60 parameters in the C60 single beam mode.
Finally, Figure 2 shows that the interface resolution also degrades with increasing C60 beam energy (from 10 keV to 20 keV), which is in good agreement with the trend reported in literature.24 This effect is probably due to the fact that increasing the beam energy leads to an increase in the crater bottom roughness, which causes the broadening of the interface.27 This effect has also been highlighted by molecular dynamic simulations.28 Russo et al have shown that multiple impact events contribute to a significant increase in roughness during depth profiling with C60 primary ions, limiting the depth resolution to a few to tens of nm.
The effect of beam energy on the total sputter yield is reported in Table 1. As can be seen, the sputtering yield for C60 single beam on tetraglyme increases from 27.4 × 10³ a.m.u. per C60 projectile at 10 keV and 45° to 72.4 × 10³ a.m.u. per C60 projectile at 30 keV. These results are in good agreement with the values reported in the literature, which range from 8.0 × 10³ a.m.u. per C60 at 10 keV for hard substrates to 30.0 × 10³ a.m.u. per C60 for soft, organic films.24 Although not shown as a plot, the increase in sputtering yield is linear with increasing beam energy, in good agreement with the trend reported in literature.24
Table 1.
Total sputtering yields for C60 primary ions on tetraglyme. The incident kinetic energies were 10, 20 and 30 keV, with an incidence angle of 45°.
| Projectile | Y (atoms/ion) | Y (molec./ion) | Y (a.m.u./ion) | Y (nm3/ion) |
|---|---|---|---|---|
| C60+ at 10 keV | (4.5 ± 0.1)×103 | 124 ± 1 | (27.4 ± 0.3)×103 | 45 ± 0 |
| C60++ at 20 keV | (8.8 ± 0.5)×103 | 234 ± 14 | (53.7 ± 3.2)×103 | 87 ± 5 |
| C60+++ at 30 keV | (12.0 ± 0.7)×103 | 326 ± 20 | (72.4 ± 4.4)×103 | 119 ± 7 |
3.2. Dual-beam depth profiling with Bin and C60
In the dual-beam mode, the sample is subject to chemical damage by both the analysis beam and the etching beam. Since the C60 etching beam was seen to have only a minimal effect on the profile as described above, the following results illustrate differences in depth profiles created by varying only the fluence of the Bin+ analysis beam. All measurements were performed with the same instrument and used the same C60 etching parameters. Therefore, this approach should allow differentiation of depth profiles based solely on the analysis beam parameters and identification of optimal depth profiling conditions. However, neither the analysis beam nor the etching beam can be truly independent of each other, since the quality of dual-beam depth profiling is dependent on both analysis and etching fluences. There is a fine interplay between the amount of damage induced and removed by the analysis beam, and the amount of residual damage that can be removed by the etching beam. For example, higher Bin+ fluxes induce significant sample degradation, but that damage can be removed by increasing the flux of the C60 etching beam.29 However, increasing the flux of the C60 etching beam removes more material per etching cycle, thereby increasing the depth removed between analysis cycles and making it difficult to detect nanoscale features present in organic or biological samples.
To generalize optimum dual beam parameters for other users of similar dual-beam instruments, there needs to be a normalization scheme to accommodate different etching rates and analysis beam fluences. This includes lower etching currents needed to depth profile very thin organic layers, and higher analysis beam fluences to increase the signal to noise ratio in biological cell imaging. For inorganic samples, there is a normalization scheme that takes into account the sputter rate ratio, which is calculated using the target currents, analyzed areas, and sputter yields of both the analysis beam and the etching beam.15 However, using the sputter yields of organic samples is more complex than for inorganic samples since these yields are not well known and cannot be easily estimated using computer simulations (e.g., TRIM algorithm30). Therefore a parameter to evaluate the relative contribution of the two beams to chemical damage and to atomic mixing is needed. As a first approximation, we define the parameter R, which represents the ratio of the analysis beam fluence to the total ion fluence and does not take into account the sputtering yields of the samples. It can be easily calculated as follows:
| Eq. 1 |
where the fluence is calculated as the number of ions per a unit area (ion/cm2). The R parameter thus varies from 0 for depth profiles acquired in the C60 single beam mode to 1 for depth profiles acquired with the analysis beam only. A physical interpretation of this parameter will be proposed below; examples of the experimental parameters used in this study are reported in Table 2.
Table 2.
Examples of ToF-SIMS parameters for dual-beam depth profiling with Bin+ and C60+
| Analysis species | I (pA) | Raster (μm) | Time per cycle (sec) | Fluence per scan (ions/cm2) | Etching species | I (nA) | Raster (μm) | Time per cycle (sec) | Fluence per scan (ions/cm2) | R |
|---|---|---|---|---|---|---|---|---|---|---|
| Bi1+ | 0.20 | 100×100 | 1.64 | 2.0×10¹⁰ | C60+ | 0.6 | 500×500 | 2.4 | 3.6×10¹² | 0.0057 |
| Bi1+ | 0.80 | 100×100 | 16.4 | 8.2×10¹¹ | C60+ | 0.45 | 500×500 | 2.4 | 2.7×10¹² | 0.23 |
| Bi3+ | 0.20 | 100×100 | 1.64 | 2.0×10¹⁰ | C60+ | 0.5 | 500×500 | 2.4 | 3.0×10¹² | 0.0068 |
| Bi3+ | 0.22 | 100×100 | 26.2 | 3.6×10¹¹ | C60+ | 0.5 | 500×500 | 2.4 | 3.0×10¹² | 0.11 |
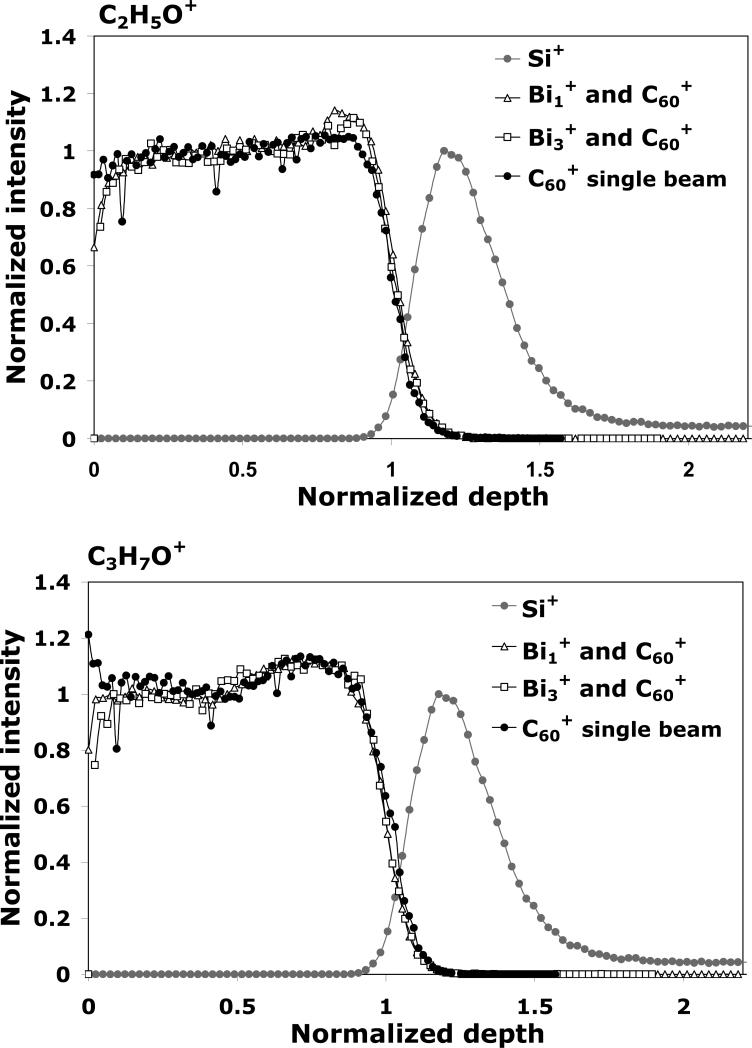
Depth profiles of the tetraglyme layer acquired in the C60 single beam mode and in the dual beam mode (with the lowest R parameter for each species, see below) are overlaid for qualitative comparison in Figure 3. For this purpose, the C2H5O+ and C3H7O+ signals were normalized in intensity (to the intensity at half depth for the tetraglyme signals, and to the maximum intensity for Si+) and in depth (50% drop of the C2H5O+ signal). At first glance, it can be seen that the profiles acquired in the dual beam mode are qualitatively similar in shape to that obtained with the C60 single beam for both fragments, which suggests that it is possible to identify parameters in the dual beam mode that minimize the influence of the analysis beam. However, some differences in the profiles exist between the dual beam and single beam modes. In the initial transient region there is an increase in the C2H5O+ and the C3H7O+ signals when depth profiling in the dual beam mode. This increase appears to be more pronounced for the Bi1+/C60+, and is more prominent for the C2H5O+ signal than for the C3H7O+ signal (See Figure 3). Such increases in the transient region has been reported in the literature for other materials, and have been attributed to changes in the ionization probabilities due to changes in the electronic structure of the material caused by ion bombardment and contamination removal.21 Our results suggest that this effect is specific to the secondary ion fragment and the primary ion species used for analysis.
Figure 3.
The normalized C2H5O+, C3H7O+ and Si+ signals during ToF-SIMS depth profiling of the tetraglyme layer for the C60+ single beam mode, as well as the Bi1+/C60+ and Bi3+/C60+ dual beam modes. The C60+ etching parameters were kept identical for all depth profiles.
In Figure 3 differences between the two fragments could also be observed in the steady state region: the C2H5O+ signal shows a gradual increase over the entire region while the C3H7O+ signal exhibits an abrupt increase in the second half of the region. This behavior was observed in both the single and dual beam modes. These variations could be to the result of chemical damage to the film or could reflect the actual composition of the film. It is also interesting to note that there is a signal enhancement for C2H5O+ at the silicon interface when depth profiling in the dual beam mode, as can be seen by the sharp jump in signal intensity at the interface. This effect is probably due to a sputtering yield increase induced by the back-reflection of the projectile-deposited energy at the hard substrate interface when using high energy Bin+ ions for analysis. Indeed, molecular dynamic simulation studies31,32 and experiments using Langmuir-Blodgett layers33 have shown that there is more fragmentation and no enhancement of intact molecules occur when using C60 projectiles to analyze thin overlayers. However, the same effect is not observed for the C3H7O+ signal, suggesting that the phenomenon may depend on the fragment being studied.
3.2.1. Dual-beam depth profiling with Bi1 and C60
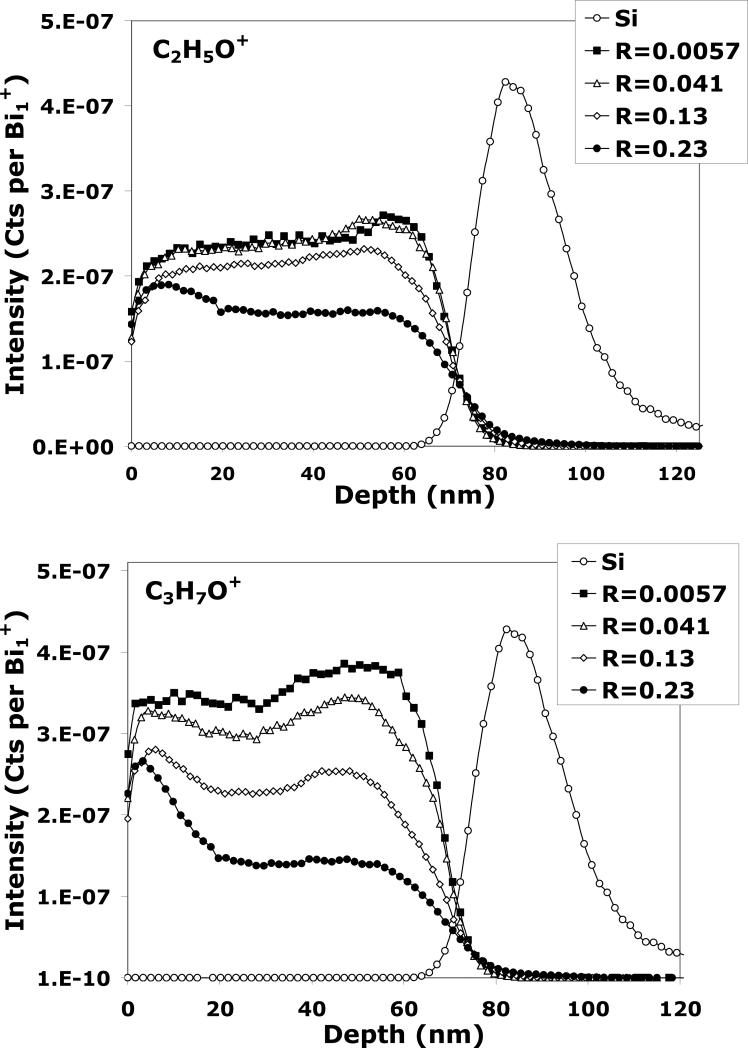
The depth profiles of the tetraglyme layer obtained in the dual-beam mode with Bi1+/C60+ for different R parameters are shown in Figure 4 for C2H5O+, C3H7O+, and Si+ (only one Si+ profile is shown since they are all exhibit similar normalized intensities) . It can be seen in Figure 4 that the intensity of both C2H5O+ and C3H7O+ signals are roughly one order of magnitude lower with the Bi1+ analysis beam when compared to the C60 single beam depth profile (Figure 1). This result is not surprising since it is well known that molecular secondary ion yields are lower for monatomic primary ions than for cluster primary ions. Looking at the C2H5O+ plot and as observed in Figure 3, the profiles obtained with R = 0.0057 and R = 0.041 are similar in shape to the depth profiles obtained with the C60+ single beam, indicating that analysis beam induced damage can be neglected at these R values for Bi1+ in the dual-beam mode. The effect of the Bi1+ beam on the C3H7O+ fragment yield, on the other hand, shows signs of chemical damage when R is increased to even 0.041. As R is increased further, the signal begins to decrease exponentially in the transient region and shows a lower signal intensity in the steady state region. A similar observation is seen for C2H5O+ when the Bi1+ fluence is increased to R ≥ 0.13. C2H5O+ and C3H7O+ signals behave similarly as a function of R, but C2H5O+ seems to have a higher tolerance for increased analysis beam fluence since chemical damage occurs at much higher R values in the C2H5O+ profiles. Although the exact mechanism is unclear, this is most likely due to the fact that the damage cross-section (σD) and the formation mechanisms are different for each molecular fragment. For example, the C2H5O+ fragment could originate from the central portion of the backbone (i.e., +CH2CH2OH) whereas the C3H7O+ could originate from the chain ends (i.e., +CH2CH2OCH3).
Figure 4.
C2H5O+, C3H7O+ and Si+ signals during ToF-SIMS dual-beam depth profiling of the tetraglyme layer with Bi1+/C60+ for different Bi1+ fluences. The C60+ etching parameters were kept identical for all depth profiles.
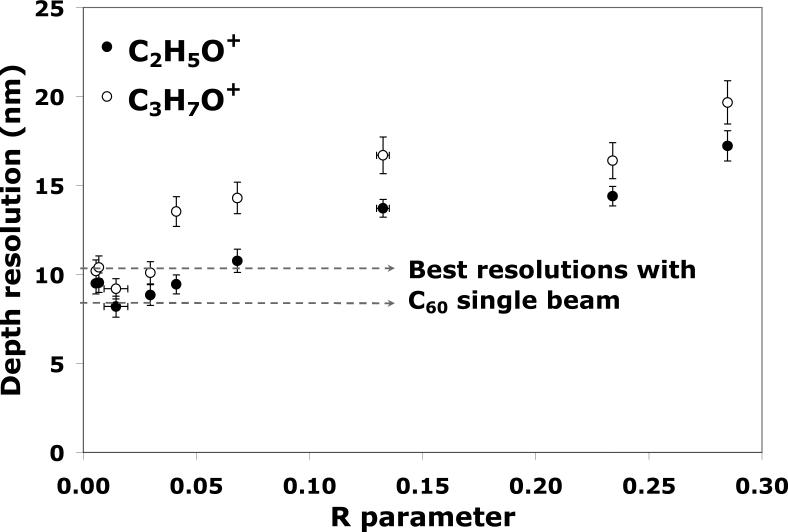
The depth resolutions measured using the 84%-16% method for the C2H5O+ and C3H7O+ signals are shown in Figure 5 for various R values. The best resolutions obtained for the C60+ single beam depth profiling (Figure 1) are also included for comparison. Figure 5 shows that the depth resolutions from the dual-beam profiles acquired with R < 0.03 are similar to those obtained from the C60 single beam depth profiles. As R increases, however, the interface width degrades from 8 to 17 nm for C2H5O+, and from 9 to 20 nm for C3H7O+. These results, combined with the profiles in Figures 3 and 4, clearly indicate that for the tetraglyme layer on Si the Bi1+ analysis beam does not significantly alter the quality of molecular depth profiles in the dual-beam mode when the Bi1+ fluence is lower than 3% of the total ion fluence (R < 0.03). On the other hand, the degradation of depth resolution and the loss of molecular information when R > 0.03 indicate that the analysis beam fluence must be carefully monitored when performing dual-beam depth profiling with monatomic species, especially for situations when the analysis beam fluence is high or when the etching C60+ fluence is low.
Figure 5.
The depth resolution measured using the 84%-16% method for the C2H5O+ and C3H7O+ signals during dual-beam depth profiling (Bi1+/C60+) for different R parameters. The best resolutions obtained for C2H5O+ (8.4 nm) and for C3H7O+ (10.4 nm) and during C60+ single beam at 10 keV are indicated as references (dotted lines).
This study used a 10 keV C60+ etching beam in the non-interlaced mode with a fluence of approximately 3 × 10¹² ions/cm2 per etch cycle (Table 2), meaning that the Bi1+ fluence has to be kept below 1 × 10¹¹ ions/cm2 per analysis cycle to preserve the molecular information as well as the depth resolution. Note that a Bi1+ fluence below 1 × 10¹¹ ions/cm2 is well below the “traditional” static limit of 1012 to 1013 ions/cm2. As mentioned previously, we believe that the influence of the analysis beam on the quality of molecular 3D images will be particularly important when the Bi1+ fluence is increased to enhance the signal to noise ratio for high mass fragments (e.g., cells imaging), and when the C60 fluence is decreased to depth profile thin organic layers. This effect should also be considered for all applications where two or more ion beams are used simultaneously, such as Ar+/C60+ co-sputtering during XPS depth profiling.34
3.2.2. Dual-beam depth profiling with Bi3 and C60
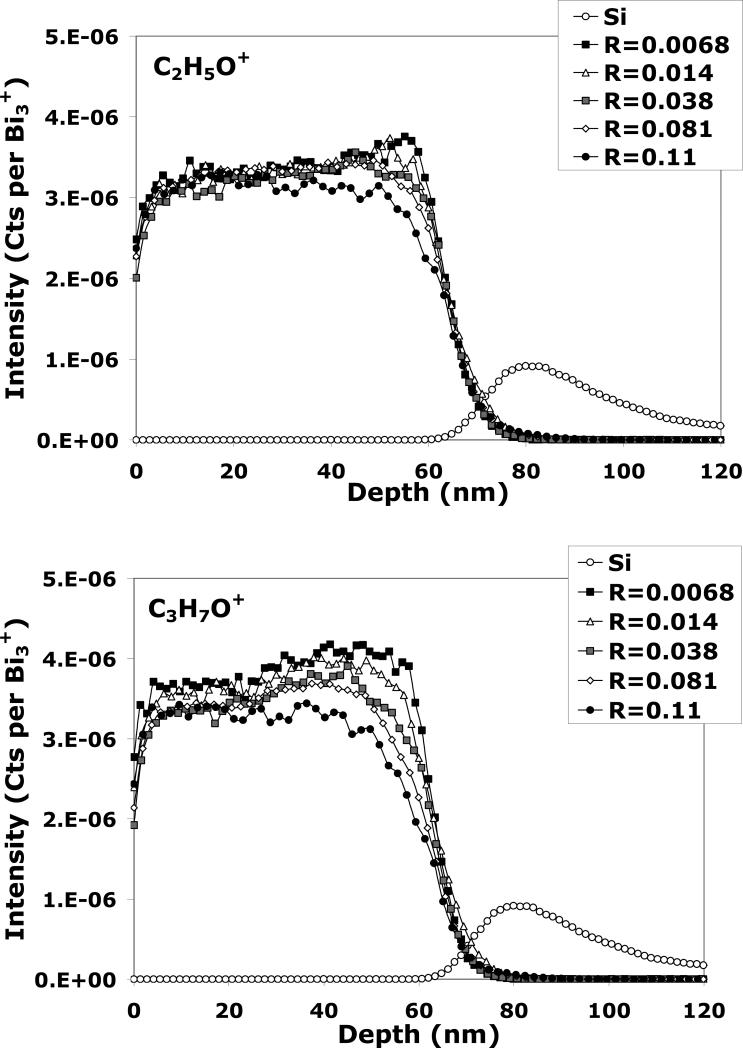
Dual-beam depth profiling with Bi3+ and C60+ was also investigated. However, since Bi3+ primary ions have higher secondary ion yields and higher efficiencies (defined as the number of detected secondary ions of a given species per damaged area) than Bi1+ ions,10,35-37 the R parameter was only varied from 0 to 0.1 while keeping the Bi3+ current at or below 0.2 pA to avoid detector saturation. The Bi3+/C60+ dual beam depth profiles for both C2H5O+ and C3H7O+ are shown in Figure 6.
Figure 6.
C2H5O+, C3H7O+ and Si+ signals from ToF-SIMS dual-beam depth profiling of the tetraglyme layer with different Bi3+ fluences. The C60+ etching parameters were the same for all depth profiles.
As can be seen, the molecular ion signals do not change significantly when the R parameter is increased from 0.0068 to 0.081. As with the dual-beam depth profiles acquired with Bi1+/C60+ for R < 0.03 (Figures 3 and 4), the depth profile curves in Figure 6 obtained with low Bi3 fluences are similar to those obtained with C60+ single beam depth profiles. This indicates that for low R values, the damage done by the Bi3+ beam during dual-beam depth profiling of tetraglyme can be neglected. It is interesting to observe that increasing the Bi3 fluence from R = 0.068 to 0.11 does not significantly affect the molecular ion yields in the transient and the steady state regions, but causes significant degradation of the molecular information close to the interface region. Similar effect was also observed when depth profiling trehalose films in the dual beam mode with Bi3+/C60+.38 Even though the reason is unclear, this suggests a different mechanism is at play behind the accumulation of damage from Bi1+ and Bi3+ primary ions.
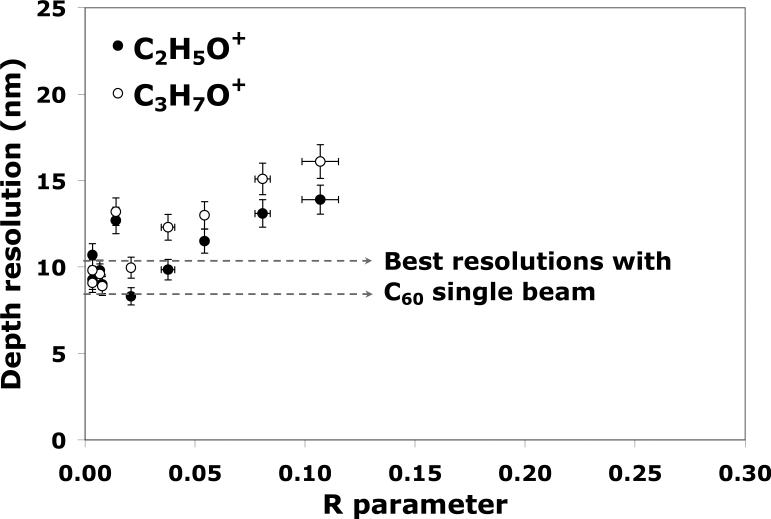
The depth resolutions for the profiles measured using the 84%-16% method at the interface region are shown in Figure 7 for different R values. Similar to the Bi1+/C60+ plot in Figure 5, the optimum resolutions for Bi3+ are for R < 0.03. Interestingly, the interface width increases quickly as the R value approaches 0.1 despite the fact that the depth profile curves showed no significant decay in molecular ion signals. The optimum interface width obtained using Bi3+ is 8 nm for C2H5O+, and 10 nm for C3H7O+, which is similar to the interface widths measured for C60 single beam and for Bi1+/C60+ depth profiling. The combination of higher secondary ion yields, lower damage cross-sections, and optimum depth resolution suggests that Bi3+ is a better source for dual-beam depth profiling than monatomic Bi1+ species. However, the analysis beam fluence still needs to be carefully controlled to assure optimum dual-beam depth profiling conditions are achieved.
Figure 7.
The depth resolution measured by the 84%-16% method for the C2H5O+ and C3H7O+ signals produced during dual-beam depth profiling of tetraglyme with Bi3+ and C60+. The best resolutions obtained for C2H5O+ (8.4 nm) and for C3H7O+ (10.4 nm) and during C60+ single beam at 10 keV are indicated as references (dotted lines).
3.4. Modeling and discussion
To quantitatively understand the results presented in Figures 4 to 6, one can use the erosion model proposed in the literature for molecular depth profiling by Gillen,39 and revisited later by Cheng,21 Wucher24,40 and Shard.27 It should be mentioned that the model has been developed to describe the variation of molecular ion signals during depth profiling of organic films, and may not strictly apply to the case of polymer depth profiling. This is because in the latter case, characteristic fragments of the polymer exhibit more complicated behavior than molecular ions, which can only decrease upon ion bombardment.4 However, our results suggest that the model can be applied to depth profiling of the tetraglyme layer, keeping in mind the disappearance cross sections will be fragment and primary ion species specific. This is consistent with other recent depth profiling studies of polymer films.4
In the erosion model, the quality of the depth profiles can be evaluated by measuring the balance between the erosion (and thus the supply of fresh material from the bulk) and the ion-induced chemical damage. The molecular ion signals were shown to vary with the projectile ion fluence f as follows:21,24
| Eq. 2 |
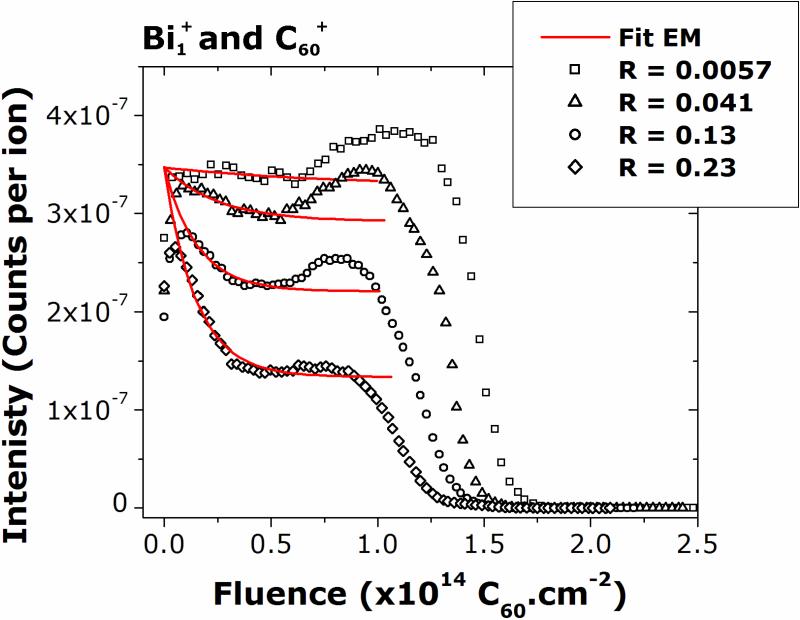
where S(f) is the ion signal at fluence f, SSS is the signal at steady state, S0 is the signal at f=0, Ytot is the total sputtering yield, n is the target density, d is the thickness of the layer altered by the projectile, and σD is the damage cross-section. The fits obtained with Eq. 2 for the C3H7O+ signal at different R parameters in the dual-beam mode with Bi1+/C60+ are depicted in Figure 8. As a first approximation, the total sputtering yield Ytot was assumed to be constant through the depth profiles.
Figure 8.
The C3H7O+ curves obtained in the dual-beam mode with Bi1+/C60+ and the corresponding fit by the erosion model (Eq. 2).
Figure 8 shows that the C3H7O+ signal can be well fit using Eq. 2 for the profiles acquired with Bi1+/C60+. As predicted by the model, the molecular ion signal decreases exponentially from the signal at zero fluence (S0) to a certain value at steady state (Sss), which depends on the molecular fragment, on the R parameter, and on the primary ion species. The key parameters in Eq. 2 are the ratio Sss/S0 and the exponential argument (Ytot/nd+σD), which is called the effective disappearance cross-section σeff, and can be extracted from the curves in Figure 8. Previous studies also defined an intuitive parameter to evaluate the quality of molecular depth profiles: the cleanup efficiency ε, which can be calculated using the value SSS/S0 as follows:24
| Eq. 3 |
where the cleanup efficiency ε is defined as:
| Eq. 4 |
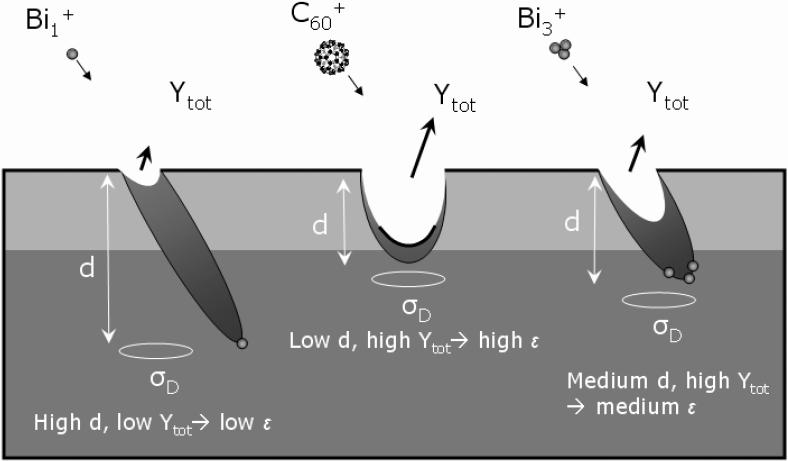
The cleanup efficiency thus represents the ratio of the number of sputtered molecules over the number of remaining molecules that are damaged in the sample, as illustrated in Figure 9. This figure summarizes the current understanding of the ion-induced sputtering process as determined from numerous molecular dynamics simulations and experimental observations.2,4,10,11,21,24,35-37,41,42 As illustrated in Figure 9, cluster ions have the highest cleanup efficiency because their kinetic energy becomes partitioned among the atoms in the cluster upon impact. As a result, they deposit most of their energy closer to the sample surface, inducing a high sputtering yield (Ytot) and causing a shallower altered layer (d) than monatomic species. This is why the best depth profiles of the tetraglyme layer are obtained with the C60 single beam: during both the analysis and etching sequences most of the chemical damage caused by the C60 ions is removed during the sputtering event. In the dual beam mode however, these parameters (Ytot, d, and cleanup efficiencies) for both the analysis beam and the etching beam become combined. Chemical damage is accumulated during the analysis sequence with Bin+ and is not always completely removed during the following etching sequence with C60. At steady state, there is equilibrium between the chemical damage induced by the analysis beam and the amount of damage that is removed during the following etching cycle. The results in this work suggest that there is a threshold below which the chemical damage and the roughness induced by the Bin+ ion is low enough to be removed by the C60 ions, resulting in a depth profile which is very similar to that obtained with C60 single beam depth profiles. For tetraglyme, this threshold was found to be reached when the Bin+ fluence approaches 3% of the total ion fluence, but it is obvious that this value will be system dependent since Ytot, d, σD and ε depend strongly on the sample being analyzed and on the primary ion species.
Figure 9.
Cartoon illustration of the cleanup efficiency for Bi1+, C60+, and Bi3+ primary ions during ToF-SIMS analysis.
For higher Bin+ fluences, an exponential decrease in the transient region reflects the degradation due to the analysis beam. Because Bi1+ primary ions have a lower cleanup efficiency than Bi3+ ions, the decay of the molecular signals in the transient region is clearer and faster for Bi1+/C60+ than for Bi3+/C60+, resulting in a lower steady state signal when Bi1+ is used. This effect can be quantified by measuring the Sss to S0 ratio for the different R parameters in Figure 8. For Bi1+/C60+, it is found that the steady state intensity decreases linearly from 93 to 40% of the initial intensity (a maximum value defined by the C60 beam that depends on the secondary ion fragment and the sample properties) when the R value is increased from 0 to 0.23. On the other hand, the Sss to S0 ratio obtained with Bi3+/C60+ decreases only from 98 to ~87% with increasing R, illustrating that medium cleanup efficiency of the Bi3+ primary ions combined with the high cleanup efficiency C60+ ions allow molecular depth profiling with low chemical damage.
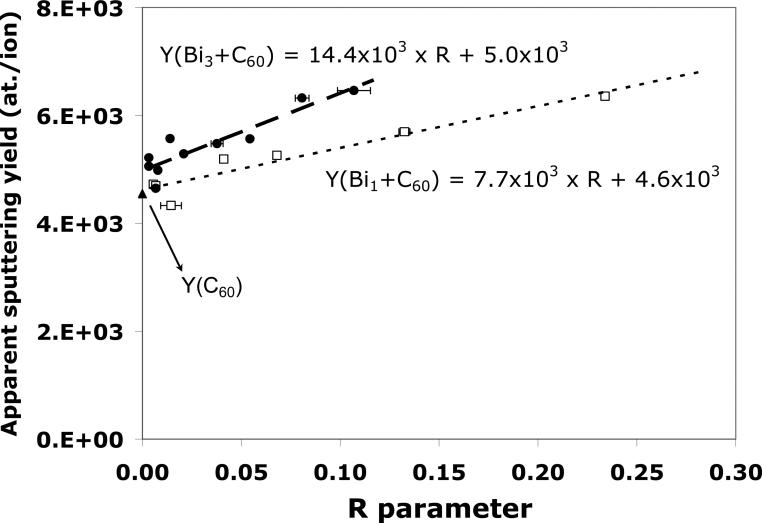
Finally, it is important to keep in mind that both the analysis and the etching beams are responsible for material removal in the dual beam mode, even when the Bin+ beam is operated at low fluence. In other words, this means that a second crater due to Bin etching is created inside the C60 etching area, leading to a higher “apparent” sputtering yield. Figure 10 shows the apparent sputter yields in the dual-beam mode with Bi1+/C60+ and Bi3+/C60+ as a function of the R parameters. These sputtering yields have been calculated using the thickness of the tetraglyme layer measured by AFM and by using the C60+ target current only. It can be seen in the figure that the apparent sputter yield increases linearly with the increasing R parameter for both Bi1+/C60+ and Bi3+/C60+, indicating that even at low fluence, the Bin+ beam is responsible for the removal of a significant part of the tetraglyme layer (up to 30 %). When the R value is decreased to zero, the apparent sputter yields for both the dual-beams converge to the sputter yield of the C60+ single beam (see Table 1). The plot clearly shows that that the increase in the sputtering yield is faster when using Bi3+ compared to Bi1+, due to the higher sputter yield of Bi3+ compared to Bi1+. It is also interesting to note that Bin+ may be increasing the etching rate during dual beam depth profiling by removing part of the amorphous carbon deposited by the low energy C60 beam.34 The sputtering yields may also be affected by the implantation of Bi into the sample for higher R parameters. These effects will be the subjects of future investigations.
Figure 10.
The apparent sputter yield as a function of R for both Bi1+/C60+ and Bi3+/C60+ dual-beam depth profiles.
Conclusions
In the semiconductor industry, depth profiling of inorganic samples has been explored and extensively optimized. However, the application of this technique is rather new to the field of organic and biological materials, and still requires extensive characterization. For one, the problem of sample damage cause by the primary ion beam(s) is an important issue since the information required from organic and biological samples is molecular rather than elemental. Thus, the preservation of molecular and structural information in depth profiling requires a good understanding of how the ion beams cause sample damage, and requires optimization of the operating conditions so that the beam damage is minimized.
In this study, we acquired molecular depth profiles of a polymer film in the single beam mode with C60 primary ions and in the dual beam mode with Bin and C60 primary ions. To study the influence of the beam parameters on the quality of molecular depth profiles, the etching parameters were kept identical for each depth profile while the analysis parameters were varied. We compared the depth profiles and defined a scheme using the R parameter to normalize the analysis beam fluence relative to the sum of both analysis and etching beam fluences. Since the accumulation of damage was found to be a function of both fluences, it is reasonable to create a dimensionless parameter to calibrate the extent of damage. This allows other users interested in organic or biological depth profiling to quickly optimize the operating conditions to obtain the best results based on the user's needs. This may be an increase in the analysis fluence to obtain a better signal to noise ratio, or a decrease in the etching fluence to depth profile very thin organic layers.
Our studies have shown that chemical damage observed in dual beam depth profiling is mainly a function of the analysis beam fluence. Keeping the C60+ etching beam fluence constant while increasing the R parameter led to both an increase in the exponential decay of the transient region and a decrease in the intensity of the steady state region. Furthermore, due to differences in the cleanup efficiencies, the use of Bi1+ as the analysis beam resulted in more pronounced damage accumulation than using Bi3+. Lastly, there was an optimum R value for each analysis beam that gave the best depth resolution. Depth profiling of organic and biological samples still requires more characterization, but the operating parameters determined here can be taken into account to minimize sample damage caused by the primary ion beam(s).
Acknowledgment
This research was supported by NIH grant EB-002027. The authors thank Winston Ciridon for his technical help preparing tetraglyme films. Part of this research was conducted at the University of Washington NanoTech User Facility, a member of the NSF National Nanotechnology Infrastructure Network (NNIN).
References
- 1.Fletcher JS, Lockyer NP, Vickerman JC. Surf. Interface Anal. 2006;38:1393. [Google Scholar]
- 2.Gillen G, Roberson S. Rapid Commun. Mass Spectrom. 1998;12:1303. doi: 10.1002/(SICI)1097-0231(19981015)12:19<1303::AID-RCM330>3.0.CO;2-7. [DOI] [PubMed] [Google Scholar]
- 3.Jones EA, Lockyer NP, Vickerman JC. Int. J. Mass Spectrom. 2007;260:146. doi: 10.1016/j.jasms.2007.05.014. [DOI] [PubMed] [Google Scholar]
- 4.Mahoney C. Mass Spectrom. Rev. 2009 doi: 10.1002/mas.20233. DOI 10.1002/mas.20233. [DOI] [PubMed] [Google Scholar]
- 5.Nguyen TC, Ward DW, Townes JA, White AK, Krantzman KD, Garrison BJ. J. Phys. Chem. B. 2000;104:8221. [Google Scholar]
- 6.Ronsheim PA. Appl. Surf. Sci. 2006;252:7201. [Google Scholar]
- 7.Vandervorst W. Appl. Surf. Sci. 2008;255:805. [Google Scholar]
- 8.Vickerman JC. Surf. Sci. 2009;603:1926. [Google Scholar]
- 9.Wagner MS. Anal. Chem. 2005;77:911. doi: 10.1021/ac048945c. [DOI] [PubMed] [Google Scholar]
- 10.Touboul D, Kollmer F, Niehuis E, Brunelle A, Laprevote O. J. Am. Soc. Mass Spectrom. 2005;16:1608. doi: 10.1016/j.jasms.2005.06.005. [DOI] [PubMed] [Google Scholar]
- 11.Postawa Z, Czerwinski B, Szewczyk M, Smiley EJ, Winograd N, Garrison BJ. Anal. Chem. 2003;75:4402. doi: 10.1021/ac034387a. [DOI] [PubMed] [Google Scholar]
- 12.Wong SCC, Hill R, Blenkinsopp P, Lockyer NP, Weibel DE, Vickerman JC. Appl. Surf. Sci. 2003;203:219. [Google Scholar]
- 13.Weibel D, Wong S, Lockyer N, Blenkinsopp P, Hill R, Vickerman JC. Anal. Chem. 2003;75 doi: 10.1021/ac026338o. [DOI] [PubMed] [Google Scholar]
- 14.Niehuis E, Grehl T. In: TOF-SIMS - Surface Analysis by Mass Spectrometry. Vickerman JC, Briggs D, editors. IMPublications; Chichester: 2001. p. 753. [Google Scholar]
- 15.Grehl T, Mollers R, Niehuis E. Appl. Surf. Sci. 2003;203-204:277. [Google Scholar]
- 16.Lopez GP, Ratner BD. Langmuir. 1991;7:766. [Google Scholar]
- 17.Lopez GP, Ratner BD, Tidwell CD, Haycox CL, Rapoza RJ, Horbett TA. J. Biomed. Mater. Res. 1992;26:415. doi: 10.1002/jbm.820260402. [DOI] [PubMed] [Google Scholar]
- 18.Shen M, Martinson L, Wagner MS, Castner DG, Ratner BD, Horbett TA. J. Biomater. Sci.-Polym. Ed. 2002;13:367. doi: 10.1163/156856202320253910. [DOI] [PubMed] [Google Scholar]
- 19.Shen M, Wagner MS, Castner DG, Ratner BD, Horbett TA. Langmuir. 2003;19:1692. [Google Scholar]
- 20.Johnston EE, Bryers JD, Ratner BD. Langmuir. 2005;21:870. doi: 10.1021/la036274s. [DOI] [PubMed] [Google Scholar]
- 21.Cheng J, Wucher A, Winograd N. J. Phys. Chem. B. 2006;110:8329. doi: 10.1021/jp0573341. [DOI] [PubMed] [Google Scholar]
- 22.Kozole J, Wucher A, Winograd N. Anal. Chem. 2008;80:5293. doi: 10.1021/ac8002962. [DOI] [PMC free article] [PubMed] [Google Scholar]
- 23.Wagner MS, Lenghaus K, Gillen G, Tarlov MJ. Appl. Surf. Sci. 2006;253:2603. [Google Scholar]
- 24.Wucher A, Cheng J, Winograd N. J. Phys. Chem. C. 2008;112:16550. doi: 10.1021/jp8049763. [DOI] [PMC free article] [PubMed] [Google Scholar]
- 25.Mine N, Douhard B, Brison J, Houssiau L. Rapid Commun. Mass Spectrom. 2007;21:2680. doi: 10.1002/rcm.3135. [DOI] [PubMed] [Google Scholar]
- 26.Wucher A, Cheng J, Zheng L, Winograd N. Anal. Bioanal. Chem. 2008;393:1835. doi: 10.1007/s00216-008-2596-5. [DOI] [PubMed] [Google Scholar]
- 27.Shard AG, Green FM, Brewer PJ, Seah MP, Gilmore IS. J. Phys. Chem. B. 2008;112:2596. doi: 10.1021/jp077325n. [DOI] [PubMed] [Google Scholar]
- 28.Russo MF, Postawa Z, Garrison BJ. J. Phys. Chem. C. 2009;113:3270. doi: 10.1021/jp809769q. [DOI] [PMC free article] [PubMed] [Google Scholar]
- 29.Fletcher JS, Henderson A, Biddulph GX, Vaidyanathan S, Lockyer NP, Vickerman JC. Appl. Surf. Sci. 2008;255:1264. doi: 10.1016/j.apsusc.2008.05.255. [DOI] [PMC free article] [PubMed] [Google Scholar]
- 30.Biersack JP, Eckstein W. Appl. Phys. A. 1984;34:73. [Google Scholar]
- 31.Czerwinski B, Delcorte A, Garrison B, Samson R, Winograd N, Postawa Z. Appl. Surf. Sci. 2006;252:6419. [Google Scholar]
- 32.Postawa Z, Czerwinski B, Winograd N, Garrison B. J. Phys. Chem. B. 2005;109:11973. doi: 10.1021/jp050821w. [DOI] [PubMed] [Google Scholar]
- 33.Stapel D, Thiemann M, Benninghoven A. Appl. Surf. Sci. 2000;158:362. [Google Scholar]
- 34.Yu BY, Chen Y-Y, Wang W-B, Hsu M-F, Tsai S-P, Lin W-S, Lin Y-C, Jou J-H, Chu C-W, Shyue J-J. Anal. Chem. 2008;80:3412. doi: 10.1021/ac702626n. [DOI] [PubMed] [Google Scholar]
- 35.Brunelle A, Touboul D, Laprevote O. J. Mass Spectrom. 2005;40:985. doi: 10.1002/jms.902. [DOI] [PubMed] [Google Scholar]
- 36.Kollmer F. Appl. Surf. Sci. 2004;231–232:153. [Google Scholar]
- 37.Kotter F, Benninghoven A. Appl. Surf. Sci. 1998;133:47. [Google Scholar]
- 38.Muramoto S, Brison J, Castner DG. Surf. Interface Anal. doi: 10.1002/sia.3479. Submitted. [DOI] [PMC free article] [PubMed] [Google Scholar]
- 39.Gillen G, Simons D, Williams P. Anal. Chem. 1990;62:2122. doi: 10.1021/ac00218a014. [DOI] [PubMed] [Google Scholar]
- 40.Wucher A. Surf. Interface Anal. 2008;40:1545. [Google Scholar]
- 41.Delcorte A, Poleunis C, Bertrand P. Appl. Surf. Sci. 2006;252:6542. [Google Scholar]
- 42.Shard A, Brewer P, Green F, Gilmore I. Surf. Interface Anal. 2007;39:294. [Google Scholar]


