

Abstract
Genome-wide association studies (GWAS) have achieved great success identifying common genetic variants associated with common human diseases. However, to date, the massive amounts of data generated from GWAS have not been maximally leveraged and integrated with other types of data to identify associations beyond those associations that meet the stringent genome-wide significance threshold. Here, we present a novel approach that leverages information from genetics of gene expression studies to identify biological pathways enriched for expression-associated genetic loci associated with disease in publicly available GWAS results. Specifically, we first identify SNPs in population-based human cohorts that associate with the expression of genes (eSNPs) in the metabolically active tissues liver, subcutaneous adipose, and omental adipose. We then use this functionally annotated set of SNPs to investigate pathways enriched for eSNPs associated with disease in publicly available GWAS data. As an example, we tested 110 pathways from the Kyoto Encylopedia of Genes and Genomes (KEGG) database and identified 16 pathways enriched for genes corresponding to eSNPs that show evidence of association with type 2 diabetes (T2D) in the Wellcome Trust Case Control Consortium (WTCCC) T2D GWAS. We then replicated these findings in the Diabetes Genetics Replication and Meta-analysis (DIAGRAM) study. Many of the pathways identified have been proposed as important candidate pathways for T2D, including the calcium signaling pathway, the PPAR signaling pathway, and TGF-β signaling. Importantly, we identified other pathways not previously associated with T2D, including the tight junction, complement and coagulation pathway, and antigen processing and presentation pathway. The integration of pathways and eSNPs provides putative functional bridges between GWAS and candidate genes or pathways, thus serving as a potential powerful approach to identifying biological mechanisms underlying GWAS findings.
Main Text
Genome-wide association studies (GWAS) have revolutionized our ability to localize and identify the causal determinants for common human diseases over the past several years, delivering an unprecedented number of DNA loci associated with a diversity of common human diseases such as type 1 diabetes (T1D),1 coronary artery disease,2 HIV-1 infection,3 and type 2 diabetes (T2D).3–8 However, GWAS do not necessarily lead directly to the gene or genes in a given locus associated with disease, and they do not typically inform the broader context in which the disease genes operate, thereby providing limited insights into the mechanisms driving disease.9–11 Furthermore, the amount of genetic variation explained by GWAS for a given disease is most often significantly less than the heritability estimated for the disease. For example, a number of studies estimate the genetic heritability for T2D to be as high as 40%,12 but the 18 DNA loci identified for T2D to date account for only ∼3% of the variation in T2D.7 This raises the question of whether there are many more common DNA variants with smaller effects that are not being identified in the GWAS because of a lack of power, whether there are many more rare variants with stronger effects that explain the missing variation, or whether it is some combination of these two explanations.13,14
Biological pathway-based analysis is a complementary approach to single-point analyses. Generally, this type of approach tests whether a set of genes from a biological pathway are associated with a disease trait of interest. Gene Set Enrichment Analysis (GSEA) represents one of the first approaches of this type developed to identify gene sets, rather than individual genes, from gene expression data that are associated with phenotypes of interest.15 A modified version of GSEA was recently developed for analysis of GWAS data, in which SNP sets derived from biological gene sets are collectively tested for association to disease.16 This modified GSEA method has been applied to T2D GWAS17 and has been evaluated to assess whether it could help prioritize biological pathways associated with T2D.18 Variations of this approach using a hypergeometric model have been developed to determine pathways that were enriched for seven common diseases with the use of GWAS results,19 and other more flexible methods to combine association evidence of SNPs or genes within a pathway have also been developed.20 A common theme in all of these developments has been to analyze GWAS data by testing for association of a pathway rather than testing individual genes in order to identify multiple variants associated with disease in multiple related genes, in which the variants individually do not necessarily meet the GWAS genome-wide significance threshold.16 In some cases, these approaches have provided important biological insights into the mechanisms underlying disease pathogenesis.
There is one open yet very important question when trying to perform pathway-based analysis by using GWAS data. A typical gene may span tens to hundreds of common SNPs, yet only one or a few of them may be functional or linked closely enough to the underlying causative variant to serve as a useful surrogate.16 Several approaches have been devised to represent any given gene by one or more SNPs from GWAS data. The maximum statistic for all SNPs near a gene has been used to represent the significance of the gene,16,19 and linkage disequilibrium (LD) information has also been used to map the significant SNPs to adjacent genes.18 However, most SNPs in a gene region will not represent functional variants of the gene, and a true disease-associated gene may have multiple independent functional variants. Furthermore, a gene may be regulated in trans by DNA variants that are far away from the structural gene.11 In this paper, we propose and demonstrate that by integrating information from genetics of gene expression (GGE) studies and pathway-based analyses in GWAS provides for additional power to uncover important biological pathways and insights into disease etiology.
GGE studies have provided a way to address several of the limitations of conventional GWAS analysis.10,11,21–23 By mapping the genetic architecture of gene expression in human populations, GGE studies can provide functional support for candidate genes within a given locus.11,21,24 One way that GGE studies can affect interpretation of GWAS is to provide links between significant GWAS SNPs and genes whose expression levels have been associated with those DNA variants.11 Recently, detailed GGE studies have profiled transcripts and genotyped SNPs across the human genome in moderate to large population-based human cohorts.11,23,25,26 These GGE studies resulted in the detection of SNPs associated with gene expression (termed expression SNPs or eSNPs) in disease-relevant tissues. The eSNPs can be considered as functionally relevant SNP sets for genetic analysis and provide a biological justification for using the p values of the corresponding eSNPs to represent the significance levels of a gene with respect to disease association.
On the basis of eSNPs discovered from liver and adipose tissues of two independent human cohorts,11 we derived eSNP sets that represent genes in pathways defined by the Kyoto Encylopedia of Genes and Genomes (KEGG) pathway database.27 We then extracted the GWAS association p values of these pathway-dependent eSNPs to T2D traits from the Wellcome Trust Case Control Consortium (WTCCC) cohort28 and analyzed the enrichment of low-association p values among these pathway eSNPs. We replicated a large proportion of the identified top pathways by using GWAS results from the Diabetes Genetics Replication and Meta-analysis (DIAGRAM) Consortium. This integrative genomics approach allows us to address whether GGE studies can help uncover important biological genes and pathways that underlie the complex etiology of T2D that may otherwise be missed by merely focusing on individual significant GWAS SNPs.
The first GGE study profiled more than 39,000 transcripts and genotyped 782,476 unique SNPs in more than 400 liver samples from people of European descent.11 This genetics of gene expression study resulted in the detection of 3309 unique eSNPs at a false discovery rate (FDR) ≤ 10%.11 The second multitissue GGE cohort comprised patients of European descent who underwent Roux-en-Y gastric bypass surgery. Liver, subcutaneous adipose, and omental adipose tissues were collected from each patient at the time of surgery at Massachusetts General Hospital. Genomic DNA was extracted from liver tissues, and total RNA was extracted from liver, subcutaneous adipose, and omental adipose tissues. Each RNA sample was profiled on a custom 44K Agilent array, and each DNA sample was genotyped on an Illumina 650Y BeadChip array. Successful gene expression profiling results were collected from 707 liver samples, 916 omental adipose samples, and 870 subcutaneous adipose samples.
The method for identifying eSNPs was detailed by Schadt et al.11 In brief, the gene expression data were first adjusted by age, race, gender, and surgery year in a linear model, and then the expression-SNP correlation was analyzed with the use of the adjusted expression data. All expression traits were tested for association with each of the genotyped SNPs meeting the quality control (QC) criteria. The association p values were adjusted to control for testing of multiple SNPs and expression traits with the use of an empirically determined FDR constrained to be ≤ 10%.11 These two GGE cohorts allowed us to identify a total of 20,563 distinct eSNPs to 9964 known genes (8693, 11,742, and 11,392 eSNPs identified from liver, omental adipose, and subcutaneous adipose tissues, respectively). In comparing eSNPs identified in independent tissues from the same cohort, there was considerable overlap between any given pairing of tissues: 72.0% of the eSNPs identified in liver, 79.0% of those found in omental adipose, and 80.5% from subcutaneous adipose were also found in the other two tissues. Thus, each tissue provides approximately ∼30% tissue-specific eSNPs detectable in the studied samples (H.Z., unpublished data; under revision at PLoS Genetics, manuscript available upon request).
To generate T2D association p values for the eSNPs derived from the GGE studies, we used individual-level genotype data on 393,143 autosomal SNPs in 1924 cases and 1500 population-based controls (UK Blood Services controls) generated from the WTCCC T2D study.28 Because different SNP panels were used in the different GGE studies and GWAS, many of the eSNPs were not genotyped in WTCCC. Therefore, using the WTCCC data, we imputed genotypes for autosomal eSNPs that were present in HapMap Phase II but were not present in the Affymetrix 500K chip used by WTCCC or did not pass direct genotyping QC (QC standards detailed in the WTCCC publication28). Genotypes were imputed with the use of the genotype data from WTCCC and phased HapMap II genotype data from the 60 CEU HapMap founders. Imputation was performed with the software package MACH 1.0.29 We retained SNPs that had an estimated minor allele frequency > 0.01 in the control sample. Only those with high imputation confidence (R2 > 0.4) were included in the analysis.7 Imputed SNPs were then tested for T2D association. Summary association statistics from the DIAGRAM Consortium, which combines the results from the WTCCC,28 the Diabetes Genetics Initiative (DGI),4 and Finland–United States Investigation of NIDDM Genetics (FUSION),5 were used for validation.
In addition to using DIAGRAM as a validation cohort, we used a weighted subtraction algorithm to derive T2D association p values from the samples in DIAGRAM, excluding the WTCCC samples. The DIAGRAM association statistics were derived from a fixed-effect weighted average of the summary Z scores from the three cohorts,7,30 which comprised 10,128 samples in total (4862 WTCCC samples, 2931 DGI samples, and 2335 FUSION samples). The cohort-specific weight was proportional to the square root of the effective number of individuals in the cohort; the squared weights were chosen to sum to 1.7 Therefore, the Z score of non-WTCCC samples can be approximated by , in which ZDIAGRAM and ZWTCCC are the Z scores converted from the two-sided p values from DIAGRAM and WTCCC, respectively. We then converted ZNon-WTCCC to a two-sided p value, PNon-WTCCC, which represented the association significance from the non-WTCCC samples.30 ZDIAGRAM and ZWTCCC were assumed to have the same sign; thus, the same allelic effect direction was assumed in the WTCCC and DIAGRAM results. Note that although the WTCCC cohort contains 1924 cases and 2938 controls, the effective WTCCC sample size is expected to be less than 4862 because of the imbalance in sample size between cases and controls. Further, we imputed the unassayed SNP genotypes on the basis of individual-level WTCCC genotype data of 1924 cases and 1500 controls. Therefore, the effective sample size and the weight of WTCCC data were approximated by 1924 + 1500 = 3424 and , respectively. The effective sample sizes of DGI and FUSION studies were approximated by the actual sample sizes, because the cases and controls are quite balanced in each study. The weight of non-WTCCC samples was calculated as .
To minimize multiple-testing concerns, we chose to use KEGG pathways because these represent relatively well-defined known biological pathways, rather than the more broad functional categories defined in other databases such as Gene Ontology (GO).31 Although our method can be applied to GO-derived gene sets, GO has a hierarchical structure that results in thousands of pathways for testing and hence increases multiple testing if all depths are considered. If analyses were restricted to a particular GO level, the presence of highly varied depths among GO terms may affect the reliability of statistical significance tests.32 Therefore, use of gene sets derived from GO must proceed with caution. Out of all of the KEGG human pathways, we tested 110 pathways that contained between 20 and 200 genes associated with eSNPs. The cutoff of 20–200 genes was selected as the optimal range for gene sets on the basis of the power of the algorithm17 and of avoiding the artificial significance of large gene sets introduced by larger number of comparisons.18 We note that pathways containing between 10 and 300 genes associated with eSNPs produced similar results (data not shown). To better characterize the sensitivity and specificity of our approach, we designed two artificial positive control pathways17 and ten artificial negative control pathways. The first positive-control pathway contained 18 genes that were most adjacent to the 18 replicated SNPs from the WTCCC GWAS;33 the other positive control pathway contained the same genes but was diluted by the addition of 40 genes that were randomly selected from the set of genes associated with at least one eSNP (per gene) across the human genome. The negative control pathways were composed of genes randomly selected from the set of genes associated with at least one eSNP across human genome, but excluding the 18 genes identified in the WTCCC GWAS. The gene counts of the negative control pathways ranged from 20 to 200 in increments of 10 (20, 40, …, 200). These artificial control pathways were analyzed together with the 110 KEGG pathways.
We modified the algorithm proposed by Wang et. al16 to integrate the eSNP information into the pathway-based GWAS analysis. Each SNP was tested for T2D association, producing a p value (referred to here as PT2D). In our integrative genomics algorithm, we represented a gene by the eSNPs significantly associated with that gene's abundance of transcript(s) in liver or adipose tissue in any of the GGE studies considered. When one eSNP was located within the shared regions of two overlapping or neighboring genes and associated with both gene expression levels, we mapped the eSNP to both genes. We assigned the PT2D of the eSNP mapped to the gene as the PT2D of the gene. When multiple eSNPs were identified as associated with the same gene, the eSNP with the most significant PT2D was taken as the eSNP for the gene, and that eSNP was designated as the representative eSNP. From our observations, when there were multiple detected cis-eSNPs for a given gene, they were usually located in a single LD block. That is, the multiple eSNPs for a given gene were usually detected because of their correlations to each other and/or their correlations with the true causal eSNP. Therefore, using all of these eSNPs would not add more independent information. The significance of each gene set (denoted by Enrichment Score, ES∗(s), s = 1…S, in which S is the number of tested gene sets) was judged with the use of a Kolmogorov-Smirnov one sided test statistic on the basis of the deviation from a uniform distribution of equal size. Ten thousand permutations were performed, in which the T2D case-control label was randomized, for evaluation of the significance level of the gene set. In each permutation (denoted by d = 1…D, in which D = 10,000, total number of permutations), we repeated the above three steps—i.e., (1) test for SNP-T2D association and record for each SNP; (2) take the most significant among all of the eSNPs corresponding to a given gene as the of the gene; (3) calculate the ES(s,d) for the gene set. The permutation approach gives an empirical distribution for the ES score for a set of genes under no association while keeping their LD structure unchanged.16 A nominal significance level for ES∗(s) was computed as the fraction of all permutations whose ES(s) is higher than ES∗(s). To compare gene sets of different size and adjust for multiple-hypothesis testing, a normalized enrichment score (NES) was then produced: .16 The FDRs corresponding to an NES∗(s) were computed as the ratio between the fraction of the NESs of all gene sets in all permutations higher than NES∗(s) and the fraction of the NES∗s of all gene sets higher than NES∗(s) in the observed data.16 The GSEA algorithm used a weighted Kolmogorov-Smirnov statistic to calculate the excess of association signals in each pathway.15,16 In our modified algorithm, we computed a test statistic for a gene only if the gene corresponded to an eSNP. Thus, there is no rank statistic for a gene with the reference being all of the genes represented by SNPs in the GWAS. Therefore, we adopted a regular Kolmogorov-Smirnov one-sided statistic to quantify the excess of association signals compared to a random uniform distribution.
Twenty-three out of the 110 KEGG pathways (21%) reached a nominal p value ≤ 0.05 on the basis of the WTCCC GWAS results, four times higher than the number expected by chance (0.05 × 110 = 5.5), suggesting that T2D genes possibly fall in multiple pathways. Sixteen of these 23 pathways reached an FDR of less than 20% (Table 1; full significance results of 110 KEGG pathways in Table S1, available online). These include known candidate T2D pathways such as PPAR signaling, calcium signaling, TGF-β signaling, cell communication, and pancreatic cancer pathway. It is of note that some of the identified significant KEGG pathways have many overlapping genes. For example, 86% of the genes in the N-Glycan biosynthesis pathway are also in the pathway Glycan structures–biosynthesis 1, with genes encoding manosidases and mannosyltransferases, being the common driving genes for the observed enrichment for both pathways, and genes encoding carbohydrate sulfotransferases being the additional driving genes for the overrepresentation of the Glycan structures–biosynthesis pathway. Approximately 60% of the genes in the bladder cancer pathway are also in the pancreatic cancer pathway, with oncogenes CCND1 (MIM ∗168461) and KRAS (MIM ∗190070) as well as those encoding vascular endothelial growth factors VEGFA (MIM +192240) and VEGFB (MIM ∗601398) being the key common genes that drive the enrichment of both pathways, and the signal transduction genes SMAD3 (MIM ∗603109) and MAPK10 (MIM ∗602897) being additional genes that drive the significance of the pancreatic cancer pathway. Therefore, the correlation among KEGG pathways contributes to the observed excess number of enriched pathways, with core genes driving the enrichment of multiple pathways.
Table 1.
Pathways with Significant Enrichment in the WTCCC data and Significant or Suggestive Enrichment in the DIAGRAM or non-WTCCC Replication Data
| Pathwaya | Gene Count | Genes with eSNP | FDRb |
Pathway Enrichment p Value |
Genes with p < 0.01f | eSNP |
eSNP PT2D |
||||
|---|---|---|---|---|---|---|---|---|---|---|---|
| WTCCCc | Diagramd | Non-WTCCCe | WTCCC | Diagram | Non-WTCCCe | ||||||
| Tight junction | 186 | 39% | 0.06 | 1.20 × 10⁻³ | 5.40 × 10⁻³ | 9.61 × 10⁻² | MYH1 | rs1989811 | 4.40 × 10⁻⁵ | 1.60 × 10⁻⁴ | 5.23 × 10⁻² |
| MYH2 | rs2097657 | 4.40 × 10⁻⁵ | 4.30 × 10⁻⁴ | 1.12 × 10⁻¹ | |||||||
| EXOC4 | rs6976491 | 2.10 × 10⁻⁴ | 6.70 × 10⁻⁴ | 8.39 × 10⁻² | |||||||
| CLDN23 | rs2976929 | 4.30 × 10⁻⁴ | 6.90 × 10⁻³ | 3.64 × 10⁻¹ | |||||||
| CSNK2B | rs1077394 | 5.50 × 10⁻⁴ | 2.10 × 10⁻⁵ | 1.85 × 10⁻³ | |||||||
| Adherens junction | 110 | 45% | 0.18 | 7.40 × 10⁻³ | 2.40 × 10⁻² | 8.08 × 10⁻² | CSNK2B | rs1077394 | 5.50 × 10⁻⁴ | 2.10 × 10⁻⁵ | 1.85 × 10⁻³ |
| Calcium signaling pathway | 239 | 39% | 0.19 | 9.60 × 10⁻³ | 1.60 × 10⁻² | 3.20 × 10⁻¹ | PDE1A | rs6711862 | 2.30 × 10⁻² | 1.70 × 10⁻³ | 1.18 × 10⁻² |
| GRIN2C | rs6501741 | 3.00 × 10⁻² | 7.10 × 10⁻³ | 4.73 × 10⁻² | |||||||
| ITPR1 | rs4684443 | 1.70 × 10⁻² | 8.00 × 10⁻³ | 7.95 × 10⁻² | |||||||
| AGTR1 | rs16861027 | 3.30 × 10⁻² | 8.30 × 10⁻³ | 5.22 × 10⁻² | |||||||
| Hematopoietic cell lineage | 120 | 33% | 0.19 | 1.70 × 10⁻² | 3.60 × 10⁻² | 3.66 × 10⁻¹ | CR1 | rs1323720 | 6.30 × 10⁻³ | 6.30 × 10⁻³ | 1.13 × 10⁻¹ |
| HLA-DQA1/ HLA-DRB1/ HSPA1B | rs1077394 | 5.50 × 10⁻⁴ | 2.10 × 10⁻⁵ | 1.85 × 10⁻³ | |||||||
| HLA-G | rs2256902 | 8.10 × 10⁻⁴ | 1.10 × 10⁻³ | 6.80 × 10⁻² | |||||||
| Complement and coagulation cascades | 108 | 46% | 0.19 | 1.80 × 10⁻² | 5.30 × 10⁻² | 1.65 × 10⁻² | CR1 | rs1323720 | 6.30 × 10⁻³ | 6.30 × 10⁻³ | 1.13 × 10⁻¹ |
| C4A/B | rs1077394 | 5.50 × 10⁻⁴ | 2.10 × 10⁻⁵ | 1.85 × 10⁻³ | |||||||
| C5 | rs10818503 | 4.50 × 10⁻³ | 8.80 × 10⁻³ | 1.79 × 10⁻¹ | |||||||
| PPAR signaling pathway | 92 | 43% | 0.2 | 2.90 × 10⁻² | 2.70 × 10⁻² | 6.46 × 10⁻¹ | PPARD | rs9368849 | 7.60 × 10⁻⁴ | 1.70 × 10⁻³ | 1.02 × 10⁻¹ |
| SCD | rs11190462 | 9.20 × 10⁻² | 6.10 × 10⁻³ | 1.45 × 10⁻² | |||||||
| Ether lipid metabolism | 45 | 51% | 0.2 | 3.10 × 10⁻² | 2.40 × 10⁻¹ | 8.03 × 10⁻² | AGPAT6 | rs919035 | 1.40 × 10⁻¹ | 3.20 × 10⁻³ | 3.75 × 10⁻³ |
| TGF-β signaling pathway | 134 | 45% | 0.2 | 3.50 × 10⁻² | 2.10 × 10⁻² | 5.44 × 10⁻² | RBL2 | rs4784312 | 2.30 × 10⁻⁴ | 8.80 × 10⁻⁴ | 1.00 × 10⁻¹ |
| INHBB | rs11677557 | 5.60 × 10⁻¹ | 3.50 × 10⁻³ | 3.44 × 10⁻⁴ | |||||||
| SMURF2 | rs17401012 | 1.50 × 10⁻¹ | 9.20 × 10⁻³ | 1.42 × 10⁻² | |||||||
| Antigen processing and presentation | 119 | 41% | 0.46 | 3.90 × 10⁻² | 3.34 × 10⁻⁴ | 2.12 × 10⁻³ | HLA-DQA1/ HLA-DRB1/ HSPA1B | rs1077394 | 5.50 × 10⁻⁴ | 2.10 × 10⁻⁵ | 1.85 × 10⁻³ |
| HLA-B/ HSPA1L | rs2260000 | 1.80 × 10⁻³ | 7.20 × 10⁻⁴ | 2.98 × 10⁻² | |||||||
| HLA-C | rs2596503 | 3.20 × 10⁻³ | 2.40 × 10⁻³ | 6.68 × 10⁻² | |||||||
| HLA-E | rs2523589 | 1.90 × 10⁻³ | 1.40 × 10⁻⁴ | 5.48 × 10⁻³ | |||||||
| HLA-G | rs2256902 | 8.10 × 10⁻⁴ | 1.10 × 10⁻³ | 6.80 × 10⁻² | |||||||
| HLA-DMB | rs3134954 | 3.20 × 10⁻¹ | 5.70 × 10⁻³ | 2.43 × 10⁻³ | |||||||
Pathway gene sizes, p values, FDRs, validation p values, and genes with eSNPs having PT2D ≤ 0.01 in DIAGRAM are presented for the nine pathways with significant (p ≤ 0.05) enrichment in the WTCCC data and significant or suggestive (p ≤ 0.10) enrichment in the DIAGRAM or non-WTCCC data.
Pathways are from the Kyoto Encyclopedia of Genes and Genomes (KEGG).
FDR is based on 10,000 permutations and 110 pathways tested in total, using the WTCCC T2D GWAS samples.
p values are based on 10,000 permutations, using the WTCCC T2D GWAS samples.
DIAGRAM Validation p values are based on Komogorov one sided statistic test compared to a uniform distribution, using DIAGRAM T2D GWAS results.
Non-WTCCC Validation p values are based on Komogorov one sided statistic test compared to a uniform distribution, using meta-analysis p values derived based DIAGRAM samples excluding WTCCC detection samples.
Only pathway genes whose representative eSNPs reached DIAGRAM PT2D ≤ 0.01 are listed here, although there are many more eSNPs associated with each pathway. All representative eSNPs of each pathway are listed in Table S2.
Both artificial positive control pathways were ranked as the top pathways identified by our procedure. Among the 18 T2D genes derived from the replicated GWAS SNPs, six genes, namely NOTCH2 (MIM ∗600275), ADAMTS9 (MIM ∗605421), JAZ1, TSPAN8 (MIM ∗600769), PPARG (MIM ∗601487), and CDKAL1 (MIM ∗611259) had at least one eSNP (eSNPs detailed Table S2). On the basis of the HapMap data, four out of the six eSNPs that we used to represent these six GWAS genes were in reasonable LD with the corresponding GWAS hits and thus are representative of the known T2D SNPs. However, the eSNP for PPARG was not in LD with the GWAS SNP, and the eSNP for CDKAL1 is over 600 kb away from the GWAS SNP. These two eSNPs may themselves be functional or in LD with other functional SNPs (the LD structures between eSNPs and GWAS SNPs are detailed in Table S3). The positive control pathway corresponding to these six genes had a nominal p < 0.0001 (FDR < 0.0001). The other 46-gene positive control pathway had a p = 0.0006 (FDR = 0.005). Although the 18 GWAS genes were only neighboring genes of replicated GWAS SNPs and may not necessarily represent functionally validated T2D causal genes, some of these 18 genes, especially the six genes with eSNPs that show strong T2D association, may be more likely to represent true T2D causal genes. Thus, it is encouraging to observe the highly significant enrichment of these pathways as a positive control of our approach.
The 20-gene negative control pathway had a p = 0.45, whereas the 200-gene negative control pathway had a p = 0.33, neither of which corresponded to an FDR < 1 (Table S1). The p values for the other ten negative control pathways tended to get smaller as the gene sets became larger, confirming the previously noted bias of large gene sets in this type of pathway-based approach.18 However, an alternative explanation for this trend could be that the eSNPs derived from liver and adipose represent a functional set of SNPs that themselves are enriched for associating with T2D. The fact that these SNPs are significantly correlated with gene expression in T2D-related tissues provides for the possibility that they may tend to be slightly enriched for association to T2D in comparison to randomly selected SNPs across the human genome, where the inverse relationship between enrichment p value and set size could reflect the increasing power expected with increasing set sizes. We believe that this strengthens the power of our approach to detect stronger signals for true disease-correlated pathways, although it may also slightly contribute to the excess number of enriched pathways that we observed.
We next sought to replicate these findings by investigating the PT2D for the eSNPs corresponding to the genes for the 23 KEGG pathways identified from the WTCCC T2D GWAS with a p value ≤ 0.05 by using summary-level data from the DIAGRAM Consortium and the derived significance of the association in the DIAGRAM samples, excluding the WTCCC samples (PNon-WTCCC). We tested whether PDIAGRAM-T2D and PNon-WTCCC for the eSNPs corresponding to genes in a given pathway were significantly different from a uniform distribution based on a Komogorov one-sided statistic, respectively. From the DIAGRAM samples, nine pathways,—tight junction, adherens junction, neuroactive ligand-receptor interaction, calcium signaling, hematopoietic cell lineage, N-Glycan biosynthesis (Glycan structures–biosynthesis 1), PPAR signaling, TGF-β signaling, and antigen processing and presentation pathway—showed deviations from the null distribution (p value ≤ 0.05 in Table 1 and Figure 1). The complement and coagulation cascades pathway showed a marginal significance level (p = 0.053). From the non-WTCCC samples, complement and coagulation cascades pathway, TGF-β signaling pathway, and antigen processing and presentation pathway showed deviations from the null distribution. Adherens junction, ether lipid metabolism pathway, and tight junction demonstrated a consistent trend in the same direction as that observed in the WTCCC, but at suggestive significance levels (p = 0.080, p = 0.081, and p = 0.096, respectively; Table 1 and Figure 1). The significance patterns were fairly consistent between the non-WTCCC and the WTCCC studies for the replicated pathways. Only genes and their representative eSNPs with DIAGRAM PT2D ≤ 0.01 for each consistent pathway are listed in Table 1, although we note that there are many more eSNPs associated with each pathway. Notably, each of the individual eSNPs showed only subtle T2D associations, supporting the hypothesis that many genes with small effect sizes together contribute to T2D.4,7,16 Details of the pathway genes, their corresponding eSNPs, expression tissues, eSNP-expression-correlation p values, eSNP WTCCC PT2D, and eSNP DIAGRAM PT2D are shown in Table S2.
Figure 1.
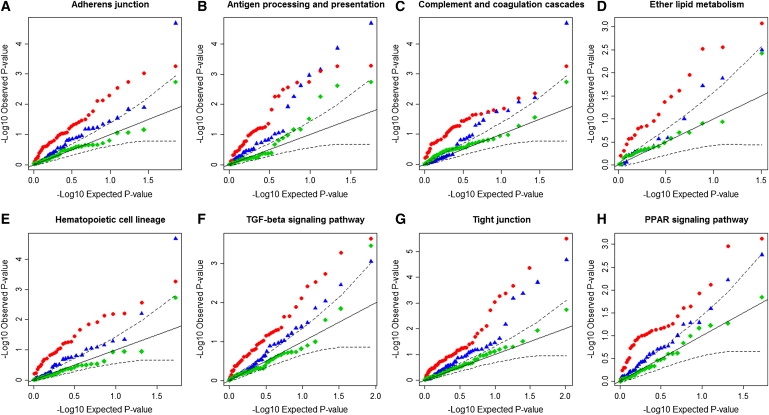
Quantile Quantile Plots of the Representative eSNP p values for the Eight Pathways
The eight pathways are: (A) adherens junction, (B) antigen processing and presentation, (C) complement and coagulation cascades, (D) ether lipid metabolilsm, (E) hematopoietic cell lineage, (F) TGF-β signaling pathway, (G) tight junction, and (H) PPAR signaling pathway.
On each plot, the x axis is −log10 of the expected p values of an equally sized set of SNPs under a uniform distribution. The y axis is −log10 of the observed p values. The SNPs presented in each plot are the representative eSNPs for genes in the corresponding pathway. The representative eSNPs are identified on the basis of WTCCC PT2D. Red dots represent their p values (PT2D) based on WTCCC. Blue triangles represent their p values (PT2D) based on DIAGRAM meta-analysis. Green diamonds represent their p values (PT2D) based on DIAGRAM samples excluding the WTCCC detection samples. Black solid lines denote the uniform null distribution. Dashed lines denote 95% confidence intervals of deviation from the null distribution.
A majority of the pathways identified from this study, such as calcium signaling, PPAR signaling, N-glycan biosynthesis, TGF-β signaling, and cell communication, have been implicated as important T2D pathways in the literature. For example, calcium signaling is crucial for insulin secretion in pancreatic β-cells34,35 as well as insulin-mediated glucose uptake in skeletal muscle.36–38 PPAR signaling plays a critical role in glucose homeostasis and insulin sensitivity, and PPAR-gamma agonists such as thiazolidinediones have been used to treat T2D.39–42 N-glycan deficiency in glycoproteins has been linked to islet damage and T2D.43–45 TGF-β signaling has been implicated to be important for pancreatic islet development.46,47 Islet-to-islet or β-to-β cell communication has shown to be the basis for insulin secretion.48,49 The hematopoietic cell lineage pathway reflects mainly the immune response and the inflammatory pathway, which have been extensively linked to diabetes and obesity.50,51
Not only does our approach support the above mentioned pathways with significant enrichment scores, it provides support for less characterized candidate pathways for roles in T2D, including tight junction, adherent junction, complement and coagulation, and antigen processing and presentation. Their enrichment patterns were replicated with the use of the DIAGRAM meta-analysis data (Figure 1). As the most significant pathway from our analysis, tight junction has been implicated mainly in complications of diabetes, such as nephropathy and retinopathy, because of its function in modulating intercellular permeability.52–55 However, there is evidence supporting a role for tight junction molecules in the regeneration of pancreatic islets and the pathogenesis of T1D.56,57 The adherens junction pathway may affect T2D in a similar fashion. The complement and coagulation pathway may mediate T2D indirectly through its effect on obesity.58–60 The antigen processing and presentation pathway has been associated with T1D in large-scale GWAS;28,61 its relationship with T2D has also been implicated.62
Mootha et al. have previously shown that oxidative phosphorylation is associated with diabetes through the use of gene expression profiling.61 In our analysis using GWAS data, the oxidative phosphorylation pathway has an enrichment p value of 0.087. Therefore, we were not able to replicate the oxidative phosphorylation pathway. One possible explanation is, as Perry et al. discussed, that the changes in oxidative phosphorylation gene expression may be a result of the T2D status, rather than the cause of T2D, as others have suggested.17 It is of particular note that our method focuses on causal pathways, given that genetic variations represent causal anchors that enable causal inference, whereas gene-expression-based analysis cannot typically differentiate causal from reactive pathways. Among the previous pathway-based GWAS, six KEGG pathways with a nominal p ≤ 0.05 had been identified.17 Of these six pathways, we confirmed the TGF-β signaling pathway (p = 0.035) and the olfactory transduction pathway (p = 0.049). However, the WNT signaling pathway, which has been strongly linked to T2D58–60 and which ranked as a top pathway in previous analyses,17 as well as the three other pathways, including galactose metabolism, pyruvate metabolism, and T2D mellitus, were not among the top hits in our study. Among these four pathways that were not replicated, galactose metabolism (13 genes with eSNPs) and T2D (15 genes with eSNPs) pathways were not represented in our analysis because the number of genes with eSNPs in these pathways did not reach our 20–200 selection criteria (p = 0.263 and 0.102, respectively, in the set size threshold relaxed test); the WNT signaling pathway and the pyruvate metabolism pathway had enrichment p values of 0.076 and 0.373, respectively. One possible explanation for the discrepancy could be the limited coverage of representative SNPs for each pathway. For instance, certain GWAS SNPs in these pathways may not affect gene expression, but may instead alter posttranscriptional mechanisms such as mRNA splicing or protein function. In other words, eSNP selection based on the GGE might have missed classes of important functional GWAS SNPs and thus caused a loss of power. Additionally, our GGE cohorts might not be powered enough to pick up all relevant eSNPs. First, the eSNPs used in this study were from liver and adipose tissues. Although these are relevant tissues for T2D, other key tissues such as islet, muscle, and brain were not available for eSNP discovery, and hence ∼30% of the tissue-specific eSNPs were likely missing from our analysis. Second, studying gene expression in non-T2D individuals may have caused some relevant eSNPs to go undetected. Our first GGE cohort was a population-based random sample, whereas the second was an obese cohort; hence, neither represented individuals that were specifically sampled on the basis of T2D status. Third, the sample sizes of the GGE cohorts are limited and so lack power to detect more modestly sized effects. Indeed, when comparing the eSNP findings from the two cohorts, 20.6% liver eSNPs identified from the first cohort were identified as liver eSNPs in the second cohort, supporting our speculation of limited eSNP coverage from cohorts of different sample sizes and sample characteristics. In our analysis, we pooled the eSNPs from the two cohorts in the three tissues as a starting point, mainly to improve power to detect pathway-based associations. To further address the caveats associated with limited coverage of representative pathway SNPs, a more comprehensive functional annotation of SNPs in additional key physiological tissues from larger populations are needed, and disease-specific samples that incorporate alternative splicing, noncoding RNA, proteomics, metabolomics, and possibly other biological processes, such as epigenetics, will be needed.
Because DIAGRAM has only summary-level statistics available, we did not use the permutation-based significance test. Instead, we used a Komogorov test to compare the representative eSNP PT2D to the uniform distribution. Because it is not common to have two representative eSNPs in one LD block, the bias caused by underlying LD is not expected to be severe. In the subtraction algorithm, we assumed that the same allelic effect direction was reported in the DIAGRAM and WTCCC results. This assumption holds for most SNPs, but will cause bias in Pnon-WTCCC estimates for the SNPs in which the opposite allelic effects were detected in the two studies. The validation p values of the pathways from non-WTCCC samples are moderately significant or only suggestive; therefore, future studies will be needed to fully explore these findings.
In conclusion, our results demonstrate the potential applicability of integrating the GGE studies and pathway-based approaches to the interpretation and further mining of GWAS data. The concept is that intuitive and straightforward: SNPs that are associated with gene expression in disease-relevant tissues are more likely to be functionally relevant SNPs; thus, leveraging this information can potentially provide significant power to identify disease pathways. In the span of just a few short years in which large-scale GWAS have been carried out, the realization that tractable drug targets and clinically useful biomarkers of disease are not immediately falling out of the data has for some reduced the enthusiasm for the GWAS approach, intensifying the debate over whether GWAS are the best strategy to elucidate the causes of disease.63–65 This integration of eSNPs and well-defined biological pathways provides a novel approach for identifying disease susceptibility paths rather than the single SNPs or genes traditionally identified through GWAS and thus can potentially extract value from the wealth of data currently being generated by GWAS. Although the GO and other pathway databases will no doubt be of use in searching for enrichments similar to that which was done for the KEGG pathways, the primary aim is to present this new approach to leveraging eSNP data as a filter to enhance power to detect the enrichments. Diabetes pathogenesis involves many pathways operating in different tissues and distinct physiological processes, such as blunted insulin signaling and failure of beta cells to compensate by producing more insulin. Our approach borrows the strength of GGE, which provides putative functional bridges between GWAS SNPs and candidate genes or pathways; it thus represents an advance in helping to identify biological mechanisms underlying GWAS findings.
Acknowledgments
This study makes use of data generated by the Wellcome Trust Case Control Consortium (WTCCC) and the DIAGRAM Consortium. We thank the WTCCC committee and DIAGRAM for granting us access to the raw genotype data and summary-level statistics. We thank Kai Wang for providing detailed information, resources, and the KEGG database for this study at the OpenBioinformatics webpage.
Supplemental Data
Web Resources
The URLs for data presented herein are as follows:
KEGG Pathway Database, http://www.genome.ad.jp/kegg/ (downloaded from http://openbioinformatics.org/gengen/)
Liver eSNPs from the first cohort, http://www.plosbiology.org/article/info:doi%2F10.1371%2Fjournal.pbio.0060107
MACH 1.0 genotype imputation software, http://www.sph.umich.edu/csg/abecasis/mach/download/
Online Mendelian Inheritance in Man (OMIM), http://www.ncbi.nlm.nih.gov/Omim/
Accession Numbers
The accession number in the Gene Expression Ominbus database for the liver gene expressions reported in this paper is GSE9588.
References
- 1.Todd J.A., Walker N.M., Cooper J.D., Smyth D.J., Downes K., Plagnol V., Bailey R., Nejentsev S., Field S.F., Payne F., Genetics of Type 1 Diabetes in Finland. Wellcome Trust Case Control Consortium Robust associations of four new chromosome regions from genome-wide analyses of type 1 diabetes. Nat. Genet. 2007;39:857–864. doi: 10.1038/ng2068. [DOI] [PMC free article] [PubMed] [Google Scholar]
- 2.Samani N.J., Erdmann J., Hall A.S., Hengstenberg C., Mangino M., Mayer B., Dixon R.J., Meitinger T., Braund P., Wichmann H.E., WTCCC and the Cardiogenics Consortium Genomewide association analysis of coronary artery disease. N. Engl. J. Med. 2007;357:443–453. doi: 10.1056/NEJMoa072366. [DOI] [PMC free article] [PubMed] [Google Scholar]
- 3.Fellay J., Shianna K.V., Ge D., Colombo S., Ledergerber B., Weale M., Zhang K., Gumbs C., Castagna A., Cossarizza A. A whole-genome association study of major determinants for host control of HIV-1. Science. 2007;317:944–947. doi: 10.1126/science.1143767. [DOI] [PMC free article] [PubMed] [Google Scholar]
- 4.Saxena R., Voight B.F., Lyssenko V., Burtt N.P., de Bakker P.I., Chen H., Roix J.J., Kathiresan S., Hirschhorn J.N., Daly M.J., Diabetes Genetics Initiative of Broad Institute of Harvard and MIT, Lund University, and Novartis Institutes of BioMedical Research Genome-wide association analysis identifies loci for type 2 diabetes and triglyceride levels. Science. 2007;316:1331–1336. doi: 10.1126/science.1142358. [DOI] [PubMed] [Google Scholar]
- 5.Scott L.J., Mohlke K.L., Bonnycastle L.L., Willer C.J., Li Y., Duren W.L., Erdos M.R., Stringham H.M., Chines P.S., Jackson A.U. A genome-wide association study of type 2 diabetes in Finns detects multiple susceptibility variants. Science. 2007;316:1341–1345. doi: 10.1126/science.1142382. [DOI] [PMC free article] [PubMed] [Google Scholar]
- 6.Sladek R., Rocheleau G., Rung J., Dina C., Shen L., Serre D., Boutin P., Vincent D., Belisle A., Hadjadj S. A genome-wide association study identifies novel risk loci for type 2 diabetes. Nature. 2007;445:881–885. doi: 10.1038/nature05616. [DOI] [PubMed] [Google Scholar]
- 7.Zeggini E., Scott L.J., Saxena R., Voight B.F., Marchini J.L., Hu T., de Bakker P.I., Abecasis G.R., Almgren P., Andersen G., Wellcome Trust Case Control Consortium Meta-analysis of genome-wide association data and large-scale replication identifies additional susceptibility loci for type 2 diabetes. Nat. Genet. 2008;40:638–645. doi: 10.1038/ng.120. [DOI] [PMC free article] [PubMed] [Google Scholar]
- 8.Steinthorsdottir V., Thorleifsson G., Reynisdottir I., Benediktsson R., Jonsdottir T., Walters G.B., Styrkarsdottir U., Gretarsdottir S., Emilsson V., Ghosh S. A variant in CDKAL1 influences insulin response and risk of type 2 diabetes. Nat. Genet. 2007;39:770–775. doi: 10.1038/ng2043. [DOI] [PubMed] [Google Scholar]
- 9.Chen Y., Zhu J., Lum P.Y., Yang X., Pinto S., MacNeil D.J., Zhang C., Lamb J., Edwards S., Sieberts S.K. Variations in DNA elucidate molecular networks that cause disease. Nature. 2008;452:429–435. doi: 10.1038/nature06757. [DOI] [PMC free article] [PubMed] [Google Scholar]
- 10.Emilsson V., Thorleifsson G., Zhang B., Leonardson A.S., Zink F., Zhu J., Carlson S., Helgason A., Walters G.B., Gunnarsdottir S. Genetics of gene expression and its effect on disease. Nature. 2008;452:423–428. doi: 10.1038/nature06758. [DOI] [PubMed] [Google Scholar]
- 11.Schadt E.E., Molony C., Chudin E., Hao K., Yang X., Lum P.Y., Kasarskis A., Zhang B., Wang S., Suver C. Mapping the genetic architecture of gene expression in human liver. PLoS Biol. 2008;6:e107. doi: 10.1371/journal.pbio.0060107. [DOI] [PMC free article] [PubMed] [Google Scholar]
- 12.Poulsen P., Kyvik K.O., Vaag A., Beck-Nielsen H. Heritability of type II (non-insulin-dependent) diabetes mellitus and abnormal glucose tolerance—a population-based twin study. Diabetologia. 1999;42:139–145. doi: 10.1007/s001250051131. [DOI] [PubMed] [Google Scholar]
- 13.Altshuler D., Daly M.J., Lander E.S. Genetic mapping in human disease. Science. 2008;322:881–888. doi: 10.1126/science.1156409. [DOI] [PMC free article] [PubMed] [Google Scholar]
- 14.Zhong H., Prentice R.L. Bias-reduced estimators and confidence intervals for odds ratios in genome-wide association studies. Biostatistics. 2008;9:621–634. doi: 10.1093/biostatistics/kxn001. [DOI] [PMC free article] [PubMed] [Google Scholar]
- 15.Subramanian A., Tamayo P., Mootha V.K., Mukherjee S., Ebert B.L., Gillette M.A., Paulovich A., Pomeroy S.L., Golub T.R., Lander E.S., Mesirov J.P. Gene set enrichment analysis: a knowledge-based approach for interpreting genome-wide expression profiles. Proc. Natl. Acad. Sci. USA. 2005;102:15545–15550. doi: 10.1073/pnas.0506580102. [DOI] [PMC free article] [PubMed] [Google Scholar]
- 16.Wang K., Li M., Bucan M. Pathway-Based Approaches for Analysis of Genomewide Association Studies. Am. J. Hum. Genet. 2007;81:1278–1283. doi: 10.1086/522374. [DOI] [PMC free article] [PubMed] [Google Scholar]
- 17.Perry J.R.B., McCarthy M.I., Hattersley A.T., Zeggini E., Weedon M.N., Frayling T.M., Wellcome Trust Case Control Consortium Interrogating type 2 diabetes genome-wide association data using a biological pathway-based approach. Diabetes. 2009;58:1463–1467. doi: 10.2337/db08-1378. [DOI] [PMC free article] [PubMed] [Google Scholar]
- 18.Elbers C.C., van Eijk K.R., Franke L., Mulder F., van der Schouw Y.T., Wijmenga C., Onland-Moret N.C. Using genome-wide pathway analysis to unravel the etiology of complex diseases. Genet. Epidemiol. 2009;33:419–431. doi: 10.1002/gepi.20395. [DOI] [PubMed] [Google Scholar]
- 19.Torkamani A., Topol E.J., Schork N.J. Pathway analysis of seven common diseases assessed by genome-wide association. Genomics. 2008;92:265–272. doi: 10.1016/j.ygeno.2008.07.011. [DOI] [PMC free article] [PubMed] [Google Scholar]
- 20.Yu K., Li Q., Bergen A.W., Pfeiffer R.M., Rosenberg P.S., Caporaso N., Kraft P., Chatterjee N. Pathway analysis by adaptive combination of p values. Genet. Epidemiol. 2009;33:700–799. doi: 10.1002/gepi.20422. [DOI] [PMC free article] [PubMed] [Google Scholar]
- 21.Moffatt M.F., Kabesch M., Liang L., Dixon A.L., Strachan D., Heath S., Depner M., von Berg A., Bufe A., Rietschel E. Genetic variants regulating ORMDL3 expression contribute to the risk of childhood asthma. Nature. 2007;448:470–473. doi: 10.1038/nature06014. [DOI] [PubMed] [Google Scholar]
- 22.Monks S.A., Leonardson A., Zhu H., Cundiff P., Pietrusiak P., Edwards S., Phillips J.W., Sachs A., Schadt E.E. Genetic inheritance of gene expression in human cell lines. Am. J. Hum. Genet. 2004;75:1094–1105. doi: 10.1086/426461. [DOI] [PMC free article] [PubMed] [Google Scholar]
- 23.Morley M., Molony C.M., Weber T.M., Devlin J.L., Ewens K.G., Spielman R.S., Cheung V.G. Genetic analysis of genome-wide variation in human gene expression. Nature. 2004;430:743–747. doi: 10.1038/nature02797. [DOI] [PMC free article] [PubMed] [Google Scholar]
- 24.Dixon A.L., Liang L., Moffatt M.F., Chen W., Heath S., Wong K.C., Taylor J., Burnett E., Gut I., Farrall M. A genome-wide association study of global gene expression. Nat. Genet. 2007;39:1202–1207. doi: 10.1038/ng2109. [DOI] [PubMed] [Google Scholar]
- 25.Stranger B.E., Forrest M.S., Clark A.G., Minichiello M.J., Deutsch S., Lyle R., Hunt S., Kahl B., Antonarakis S.E., Tavaré S. Genome-wide associations of gene expression variation in humans. PLoS Genet. 2005;1:e78. doi: 10.1371/journal.pgen.0010078. [DOI] [PMC free article] [PubMed] [Google Scholar]
- 26.Myers A.J., Gibbs J.R., Webster J.A., Rohrer K., Zhao A., Marlowe L., Kaleem M., Leung D., Bryden L., Nath P. A survey of genetic human cortical gene expression. Nat. Genet. 2007;39:1494–1499. doi: 10.1038/ng.2007.16. [DOI] [PubMed] [Google Scholar]
- 27.Kanehisa M., Goto S. KEGG: kyoto encyclopedia of genes and genomes. Nucleic Acids Res. 2000;28:27–30. doi: 10.1093/nar/28.1.27. [DOI] [PMC free article] [PubMed] [Google Scholar]
- 28.Wellcome Trust Case Control Consortium Genome-wide association study of 14,000 cases of seven common diseases and 3,000 shared controls. Nature. 2007;447:661–678. doi: 10.1038/nature05911. [DOI] [PMC free article] [PubMed] [Google Scholar]
- 29.Li Y., Willer C., Sanna S., Abecasis G. Genotype imputation. Annu. Rev. Genomics Hum. Genet. 2009;10:387–406. doi: 10.1146/annurev.genom.9.081307.164242. [DOI] [PMC free article] [PubMed] [Google Scholar]
- 30.Hedges L.V., Olkin I. Academic Press; Orlando: 1985. Statistical methods for meta-analysis. [Google Scholar]
- 31.Ashburner M., Ball C.A., Blake J.A., Botstein D., Butler H., Cherry J.M., Davis A.P., Dolinski K., Dwight S.S., Eppig J.T., The Gene Ontology Consortium Gene ontology: tool for the unification of biology. Nat. Genet. 2000;25:25–29. doi: 10.1038/75556. [DOI] [PMC free article] [PubMed] [Google Scholar]
- 32.Mao X., Cai T., Olyarchuk J.G., Wei L.P. Automated genome annotation and pathway identification using the KEGG Orthology (KO) as a controlled vocabulary. Bioinformatics. 2005;21:3787–3793. doi: 10.1093/bioinformatics/bti430. [DOI] [PubMed] [Google Scholar]
- 33.Meigs J.B., Shrader P., Sullivan L.M., McAteer J.B., Fox C.S., Dupuis J., Manning A.K., Florez J.C., Wilson P.W., D'Agostino R.B., Sr., Cupples L.A. Genotype score in addition to common risk factors for prediction of type 2 diabetes. N. Engl. J. Med. 2008;359:2208–2219. doi: 10.1056/NEJMoa0804742. [DOI] [PMC free article] [PubMed] [Google Scholar]
- 34.Levy J. Abnormal cell calcium homeostasis in type 2 diabetes mellitus: a new look on old disease. Endocrine. 1999;10:1–6. doi: 10.1385/ENDO:10:1:1. [DOI] [PubMed] [Google Scholar]
- 35.Hodgkin M.N., Hills C.E., Squires P.E. The calcium-sensing receptor and insulin secretion: a role outside systemic control 15 years on. J. Endocrinol. 2008;199:1–4. doi: 10.1677/JOE-08-0261. [DOI] [PubMed] [Google Scholar]
- 36.Lanner J.T., Bruton J.D., Katz A., Westerblad H. Ca(2+) and insulin-mediated glucose uptake. Curr. Opin. Pharmacol. 2008;8:339–345. doi: 10.1016/j.coph.2008.01.006. [DOI] [PubMed] [Google Scholar]
- 37.Witczak C.A., Fujii N., Hirshman M.F., Goodyear L.J. Ca2+/calmodulin-dependent protein kinase kinase-alpha regulates skeletal muscle glucose uptake independent of AMP-activated protein kinase and Akt activation. Diabetes. 2007;56:1403–1409. doi: 10.2337/db06-1230. [DOI] [PubMed] [Google Scholar]
- 38.Wright D.C., Hucker K.A., Holloszy J.O., Han D.H. Ca2+ and AMPK both mediate stimulation of glucose transport by muscle contractions. Diabetes. 2004;53:330–335. doi: 10.2337/diabetes.53.2.330. [DOI] [PubMed] [Google Scholar]
- 39.Seda O., Sedová L. Peroxisome proliferator-activated receptors as molecular targets in relation to obesity and type 2 diabetes. Pharmacogenomics. 2007;8:587–596. doi: 10.2217/14622416.8.6.587. [DOI] [PubMed] [Google Scholar]
- 40.Semple R.K., Chatterjee V.K., O'Rahilly S. PPAR gamma and human metabolic disease. J. Clin. Invest. 2006;116:581–589. doi: 10.1172/JCI28003. [DOI] [PMC free article] [PubMed] [Google Scholar]
- 41.Saltiel A.R., Olefsky J.M. Thiazolidinediones in the treatment of insulin resistance and type II diabetes. Diabetes. 1996;45:1661–1669. doi: 10.2337/diab.45.12.1661. [DOI] [PubMed] [Google Scholar]
- 42.Rosenson R.S. Effects of peroxisome proliferator-activated receptors on lipoprotein metabolism and glucose control in type 2 diabetes mellitus. Am. J. Cardiol. 2007;99(4A):96B–104B. doi: 10.1016/j.amjcard.2006.11.010. [DOI] [PubMed] [Google Scholar]
- 43.Higai K., Azuma Y., Aoki Y., Matsumoto K. Altered glycosylation of alpha1-acid glycoprotein in patients with inflammation and diabetes mellitus. Clin. Chim. Acta. 2003;329:117–125. doi: 10.1016/s0009-8981(02)00427-8. [DOI] [PubMed] [Google Scholar]
- 44.Itoh N., Sakaue S., Nakagawa H., Kurogochi M., Ohira H., Deguchi K., Nishimura S., Nishimura M. Analysis of N-glycan in serum glycoproteins from db/db mice and humans with type 2 diabetes. Am. J. Physiol. Endocrinol. Metab. 2007;293:E1069–E1077. doi: 10.1152/ajpendo.00182.2007. [DOI] [PubMed] [Google Scholar]
- 45.Liu X.Q., Wu L., Guo X.J. Effect of Bu-Zhong-Yi-Qi-Tang on deficiency of N-glycan/nitric oxide and islet damage induced by streptozotocin in diabetic rats. World J. Gastroenterol. 2009;15:1730–1737. doi: 10.3748/wjg.15.1730. [DOI] [PMC free article] [PubMed] [Google Scholar]
- 46.Smart N.G., Apelqvist A.A., Gu X., Harmon E.B., Topper J.N., MacDonald R.J., Kim S.K. Conditional expression of Smad7 in pancreatic beta cells disrupts TGF-beta signaling and induces reversible diabetes mellitus. PLoS Biol. 2006;4:e39. doi: 10.1371/journal.pbio.0040039. [DOI] [PMC free article] [PubMed] [Google Scholar]
- 47.Sanvito F., Herrera P.L., Huarte J., Nichols A., Montesano R., Orci L., Vassalli J.D. TGF-beta 1 influences the relative development of the exocrine and endocrine pancreas in vitro. Development. 1994;120:3451–3462. doi: 10.1242/dev.120.12.3451. [DOI] [PubMed] [Google Scholar]
- 48.Kanno T., Gopel S.O., Rorsman P., Wakui M. Cellular function in multicellular system for hormone-secretion: electrophysiological aspect of studies on alpha-, beta- and delta-cells of the pancreatic islet. Neurosci. Res. 2002;42:79–90. doi: 10.1016/s0168-0102(01)00318-2. [DOI] [PubMed] [Google Scholar]
- 49.Bavamian S., Klee P., Britan A., Populaire C., Caille D., Cancela J., Charollais A., Meda P. Islet-cell-to-cell communication as basis for normal insulin secretion. Diabetes Obes. Metab. 2007;9(Suppl 2):118–132. doi: 10.1111/j.1463-1326.2007.00780.x. [DOI] [PubMed] [Google Scholar]
- 50.Fernández-Real J.M., Pickup J.C. Innate immunity, insulin resistance and type 2 diabetes. Trends Endocrinol. Metab. 2008;19:10–16. doi: 10.1016/j.tem.2007.10.004. [DOI] [PubMed] [Google Scholar]
- 51.Hotamisligil G.S. Inflammation and metabolic disorders. Nature. 2006;444:860–867. doi: 10.1038/nature05485. [DOI] [PubMed] [Google Scholar]
- 52.Miyamoto N., de Kozak Y., Jeanny J.C., Glotin A., Mascarelli F., Massin P., BenEzra D., Behar-Cohen F. Placental growth factor-1 and epithelial haemato-retinal barrier breakdown: potential implication in the pathogenesis of diabetic retinopathy. Diabetologia. 2007;50:461–470. doi: 10.1007/s00125-006-0539-2. [DOI] [PubMed] [Google Scholar]
- 53.Hawkins B.T., Ocheltree S.M., Norwood K.M., Egleton R.D. Decreased blood-brain barrier permeability to fluorescein in streptozotocin-treated rats. Neurosci. Lett. 2007;411:1–5. doi: 10.1016/j.neulet.2006.09.010. [DOI] [PMC free article] [PubMed] [Google Scholar]
- 54.Harhaj N.S., Antonetti D.A. Regulation of tight junctions and loss of barrier function in pathophysiology. Int. J. Biochem. Cell Biol. 2004;36:1206–1237. doi: 10.1016/j.biocel.2003.08.007. [DOI] [PubMed] [Google Scholar]
- 55.Nishikiori N., Osanai M., Chiba H., Kojima T., Mitamura Y., Ohguro H., Sawada N. Glial cell-derived cytokines attenuate the breakdown of vascular integrity in diabetic retinopathy. Diabetes. 2007;56:1333–1340. doi: 10.2337/db06-1431. [DOI] [PubMed] [Google Scholar]
- 56.Watts T., Berti I., Sapone A., Gerarduzzi T., Not T., Zielke R., Fasano A. Role of the intestinal tight junction modulator zonulin in the pathogenesis of type I diabetes in BB diabetic-prone rats. Proc. Natl. Acad. Sci. USA. 2005;102:2916–2921. doi: 10.1073/pnas.0500178102. [DOI] [PMC free article] [PubMed] [Google Scholar]
- 57.Yoshikumi Y., Ohno H., Suzuki J., Isshiki M., Morishita Y., Ohnishi H., Yasuda H., Omata M., Fujita T., Mashima H. Up-regulation of JAM-1 in AR42J cells treated with activin A and betacellulin and the diabetic regenerating islets. Endocr. J. 2008;55:757–765. doi: 10.1507/endocrj.k08e-017. [DOI] [PubMed] [Google Scholar]
- 58.Wärnberg J., Nova E., Moreno L.A., Romeo J., Mesana M.I., Ruiz J.R., Ortega F.B., Sjöström M., Bueno M., Marcos A., AVENA Study Group Inflammatory proteins are related to total and abdominal adiposity in a healthy adolescent population: the AVENA Study. Am. J. Clin. Nutr. 2006;84:505–512. doi: 10.1093/ajcn/84.3.505. [DOI] [PubMed] [Google Scholar]
- 59.Engström G., Hedblad B., Janzon L., Lindgärde F. Weight gain in relation to plasma levels of complement factor 3: results from a population-based cohort study. Diabetologia. 2005;48:2525–2531. doi: 10.1007/s00125-005-0021-6. [DOI] [PubMed] [Google Scholar]
- 60.Gabrielsson B.G., Johansson J.M., Lönn M., Jernås M., Olbers T., Peltonen M., Larsson I., Lönn L., Sjöström L., Carlsson B., Carlsson L.M. High expression of complement components in omental adipose tissue in obese men. Obes. Res. 2003;11:699–708. doi: 10.1038/oby.2003.100. [DOI] [PubMed] [Google Scholar]
- 61.Grant S.F., Hakonarson H. Genome-wide association studies in type 1 diabetes. Curr. Diab. Rep. 2009;9:157–163. doi: 10.1007/s11892-009-0026-5. [DOI] [PubMed] [Google Scholar]
- 62.Das U.N., Rao A.A. Gene expression profile in obesity and type 2 diabetes mellitus. Lipids Health Dis. 2007;6:35. doi: 10.1186/1476-511X-6-35. [DOI] [PMC free article] [PubMed] [Google Scholar]
- 63.Goldstein D.B. Common genetic variation and human traits. N Engl J Med. 2009;360:1696–1698. doi: 10.1056/NEJMp0806284. [DOI] [PubMed] [Google Scholar]
- 64.Hardy J., Singleton A. Genomewide association studies and human disease. N Engl J Med. 2009;360:1759–1768. doi: 10.1056/NEJMra0808700. [DOI] [PMC free article] [PubMed] [Google Scholar]
- 65.Kraft P., Hunter D.J. Genetic risk prediction–Are we there yet? N Engl J Med. 2009;360:1701–1703. doi: 10.1056/NEJMp0810107. [DOI] [PubMed] [Google Scholar]
Associated Data
This section collects any data citations, data availability statements, or supplementary materials included in this article.