

Abstract
The microemulsion composed of oleic acid, phosphate buffer, ethanol, and Tween (20, 40, 60, and 80) has been investigated in the presence of antitubercular drugs of extremely different solubilities, viz. isoniazid (INH), pyrazinamide (PZA), and rifampicin (RIF). The phase behavior showing the realm of existence of microemulsion has been delineated at constant surfactant/co-surfactant ratio (Km = 0.55) with maximum isotropic region resulting in the case of Tween 80. The changes in the microstructure of Tween 80-based microemulsion in the presence of anti-TB drugs have been established using conductivty (σ) and viscosity (η) behavior. The optical microscopic images of the system help in understanding the effect of dilution and presence of drug on the structure of microemulsion. Partition coefficient, particle size analysis, and spectroscopic studies (UV–visible, Fourier transform infrared, and 1H NMR) have been performed to evaluate the location of a drug in the colloidal formulation. To compare the release of RIF, PZA, and INH from Tween 80 formulation, the dissolution studies have been carried out. It shows that the release of drugs follow the order INH>PZA>RIF. The kinetics of the release of drug has been analyzed using the Korsmeyer and Peppas equation. The results have given a fair success to predict that the release of PZA and INH from Tween 80 microemulsion is non-Fickian, whereas RIF is found to follow a Fickian mechanism.
Key words: isoniazid, microemulsion, pyrazinamide, rifampicin, solubility, stability, Tween
INTRODUCTION
The ever-increasing demand on the performance of pharmaceutical formulations with respect to greater bioavailability, storage stability, fewer side effects, and controlled release constitutes the main motivation for drug research. Surfactants play a key role in many of the novel drug delivery systems. Recently, a great deal of focus has been laid on microemulsions (1,2) and self-microemulsifying drug delivery systems (SMEDDS) (3,4).
Microemulsions are thermodynamically stable, isotropic clear dispersions of oil, water, and surfactant (and/or co-surfactant) which have high stability, low viscosity, and transparency. SMEDDS is a preconcentrate of microemulsion containing drug, oil, and surfactant (and/or co-surfactant). When used as drug delivery system (DDS), microemulsions help in enhancing solubility and dissolution rate and improve bioavailability of a drug (5). Easy administration, increased absorption, improved clinical potency, and decreased toxicity of microemulsion have encouraged many researchers to explore the ability of microemulsion as DDS (6).
One of the unique factors associated with microemulsion is the presence of different structures, viz., Winsor I (oil-in-water, o/w), Winsor II (water-in-oil, w/o), and Winsor III (bicontinuous or middle phase microemulsion) as classified by Winsor (7). These systems are formed by altering the curvature of interface with the help of different factors such as salinity, temperature, etc. Israelachvili et al. (8). have explained that the preferred curvature of the interface is governed by the relative values of the head group area (ao) and tail effective area (v/lc).
For the selection of components of a biocompatible microemulsion system, the use of non-ionic surfactants has been widely accepted since along with being compatible, they retain their utility over a broad range of pH values and may affect the skin barrier function (9–13). Substances in the molecularly dispersed form are more efficiently absorbed into systemic circulation since small particles (in the nanometer range) have high absorptive area; therefore, they penetrate the cell membrane more efficiently (14). The size of encapsulated particle needs to be controlled to avoid blockage in the capillaries (15).
Microemulsions provide a large interface between water and the nonpolar solvent and enable the coexistence of both water-soluble and oil-soluble materials. The changes in the internal structure of a microemulsion can be analyzed using different methods, viz., conductivity, viscosity, density, surface tension, differential scanning calorimetry (16), etc. Microemulsions contain microdomains of different polarities within the same single-phase solution which can be used for the release of drugs of different polarities. Both hydrophilic and lipophilic drugs may or may not influence the microstructure but will show different release behavior in o/w and w/o microemulsions (17,18). It is found from the literature that the release of drugs in micelle and microemulsion system is diffusion-controlled release (19).
A number of novel implant-, microparticulate-, and various other carrier-based drug delivery systems incorporating the principal antitubercular agents have been fabricated which are administrated via different routes, viz., oral, inhaled, subcutaneous injection, etc. (20). Tween-based microemulsions are generally regarded as non-toxic and non-irritant materials. However, there are occasional reports (12) of hypersensitivity following their topical use. Tweens have been associated with side effects (12) in the case of low birth weight infants when administrated intravenously with vitamin E preparation.
In our previous study (21,22), isoniazid and rifampicin have been successfully incorporated in Tween-based microemulsions. In the present report, an attempt has been made to incorporate the third antitubercular drug pyrazinamide in the microemulsion system. A microemulsion system comprising oleic acid as an oil, a non-ionic surfactant Tween, a short-chain alkanol co-surfactant (ethanol), and phosphate buffer (PB), pH 7.4, has been selected to observe the effect of change of surfactant. The phase behavior has been investigated for Tween 20, 40, 60, and 80 (Fig. 1) systems at a constant surfactant/co-surfactant mass ratio (Km = 0.55).
Fig. 1.

a General structure of Tweens. b Structure of Tween 80
Conductivity, viscosity, and optical microscopic measurements have been used to delineate the gradual changes in the microstructure of microemulsion. The comparison has been drawn to study the influence of all the three antitubercular drugs, i.e., rifampicin (RIF), isoniazid (INH), and pyrazinamide (PZA) on the stability, optical texture, and on the microstructure of the formulation. Selected drug-loaded microemulsions have been characterized for particle size and dissolution studies at infinite dilution. To locate the possible site of all the three drugs in the microemulsion system, various spectroscopic methods such as UV–visible, Fourier transform infrared (FT-IR), and 1H NMR spectroscopy have also been used.
MATERIALS AND METHODS
Materials
Tween 20, Tween 40, Tween 60, Tween 80, and INH, RIF, and PZA were purchased from Sigma (Missouri, USA). Absolute ethanol and oleic acid were obtained from Merck (New Jersey, USA) and CDH (New Delhi, India), respectively. Phosphate buffer (0.01 M, pH 7.4) was used as the hydrophilic phase.
Methods
Microemulsion Preparation and Phase Behavior
The microemulsion consisting of oil (oleic acid), surfactant (Tween 20/Tween 40/Tween 60/Tween 80), co-surfactant (ethanol), and aqueous phase PB (pH 7.4) with constant surfactant/co-surfactant mass ratio (Km = 0.55) was formulated. For sample preparation, oleic acid and PB were first mixed with surfactant; ethanol was then added to obtain the desired microemulsion compositions. The phase behavior of the chosen systems were mapped (as shown in Fig. 2). The temperature was maintained using a RE320 Ecoline thermostat at 30 ± 0.01°C. The samples were prepared in screw cap glass vials and monitored visually every day for a month. Transparent, single-phase mixtures, stable for over 6 months, remaining clear and transparent, were designated as microemulsions (ME).
Fig. 2.

Phase behavior of a Tween 20, b Tween 40, c Tween 60, d Tween 80 with ethanol/oleic acid/PB (pH 7.4) at K m = 0.55
Drug Incorporation in Microemulsion
One of the compositions was selected from the single-phase region (microemulsion) of phase diagram (Fig. 2) and the drugs were incorporated. INH and PZA were dissolved into the pre-weighed hydrophilic component, whereas RIF was dissolved into the pre-weighed hydrophobic component of the system at a concentration of 1% (w/w) under stirring followed by the addition of remaining components.
Microemulsion Characterization
Optical Transparency
The homogeneity and optical isotropy of pure and drug-loaded microemulsions were examined by a cross polarizer and visual examination at room temperature. Samples were analyzed for any precipitation or phase separation in the presence of drug.
Centrifugation
Stability of pure and drug-loaded microemulsions was tested by carrying out centrifugation (Tarson) at 2,000 rpm for 30 min.
Oil/Buffer Partition Coefficient
Oil/buffer partition coefficient was calculated using the following equation:
 |
1 |
where Coil and Cbuffer are the concentrations of drug in oil and drug in buffer, respectively. It was determined by dissolving 2 mg of INH or PZA in 1 ml buffer whereas RIF in oil. Oil was added in 1:1 ratio (v/v) to INH and PZA solution in buffer and buffer to RIF. The mixture was shaken for 5 min and centrifuged for 1 h at 5,000 rpm with Tarson centrifugator. The two layers were separated and the content of each drug was assayed by UV–visible spectrophotometer at their characteristic wavelengths.
Conductivity Measurements
The electric conductivity (σ) was measured by means of a PICO digital conductivity meter (Labindia Instruments Pvt Ltd, Maharashtra, India) operating at 50 Hz. The conductivities of selected and drug-loaded microemulsions were measured as a function of ω (=[Buffer]/[surfactant + co-surfactant]) at a constant temperature 30 ± 0.01°C. The error limit of conductance measurements was ±3%. The composition selected for all studies contained oleic acid (19%, w/w), buffer (13%, w/w), Tween 80 (24%, w/w), and ethanol (44%).
Viscosity Measurements
Viscosities were measured with calibrated Ubbelohde Viscometer (Schött, Germany) at 30 ± 0.01°C with the experimental error of 0.5%. For each measurement, the viscometer was washed, rinsed, and vacuum-dried. To follow the viscous behavior of the microemulsions, flow time was measured for all the selected pure and drug-loaded microemulsions (1 wt.% drug).
Optical Microscopy
The optical observations were made in transmitted light with a Leica microscope DM 3000 (Germany). The images were recorded with Leica DFC420 camera. The sample was placed on slide to minimize possible destruction. The magnification was ×200.
Spectrophotometric Studies
Fourier Transform Infrared
FT-IR spectra of pure and drug-loaded microemulsions (0.5 and 1 wt.% drug) were recorded on Perkin-Elmer (RX1; Massachusetts, USA). FT-IR spectrometer used AgCl plates in the frequency range 4,000–350 cm−1 with 100 number scans and 4-cm−1 spectral resolution.
1H NMR
1H NMR measurements were performed at on a Bruker 400 (Massachusetts, USA) system. Chemical shifts of Tween 80 in the presence of three drugs (0.5 wt.%) were determined using D2O as internal locking agent.
Electronic Spectroscopy
UV–visible spectra were recorded over the wavelength range of 350–600 nm using JASCO-530 UV–visible spectrophotometer (JASCO International Co., Ltd., Tokyo, Japan). Three sets of experiments were performed in which ω, oil content, and surfactant were varied, keeping the drug concentration constant in all the sets. UV–visible spectroscopic studies were performed with RIF using Tween 80 system which gave a deeper understanding of microstructure, stability of drug, and molecular interactions in the microemulsion system.
Dilutability and Particle Size Measurements
The dilutability of the microemulsions was assessed to know whether these systems would be diluted with the aqueous phase of the system without separation or not. For this purpose, selected and drug-loaded microemulsions were diluted with buffer, and their transparency was assessed visually. The particle size measurements (at infinite dilution) were made using laser diffraction analyzer (CILAS 1180 liquid range (0.04–2,500 µm), France).
Dissolution Studies
To perform dissolution studies, 0.55 g microemulsion containing 1 wt.% (anti-TB drug was filled in hard gelatin capsules of 0 size and introduced in 50 ml of PB (pH 7.4) incubated at 37 ± 0.1°C. The system was stirred at constant 250 rpm. The aliquot of 2 ml was withdrawn at intervals of 0, 2, 4, 8, 10, 15, 20, 30, 40, 60, 80, 100, and 130 min. Each time, the same amount of fresh PB (kept at the same temperature) was added to maintain the dissolution volume. The aliquots were filtered through 0.22-µm membrane filters. The drug concentrations were determined spectrophotometrically at their characteristic wavelengths, i.e., 475 nm for RIF, 262 nm for INH, and 268 nm for PZA.
RESULTS AND DISCUSSION
Phase Studies
Microemulsion in the present study formed spontaneously at ambient temperature when their components were brought in contact. Phase behavior of all the four Tweens/ethanol/oleic acid/PB systems is shown in Fig. 2. In all the four systems, Km is kept constant, i.e., 0.55. The area of isotropic region is nearly the same in all the systems. The phase behavior exhibits a two-phase region and a large single-phase region which gradually and continuously transformed from buffer-rich side of binary solution (buffer/surfactant micellar phase) of phase diagram toward the oil-rich region. This emphasizes on a continuous transition from Winsor II to Winsor I system. Single-phase isotropic region is minimum in Tween 20 system as compared to other three-surfactant systems.
The larger single-phase region has been observed in Tween 60 and Tween 80 systems. The observations can be correlated to the hydrophile–lipophile balance (HLB) values (Table I) of these surfactant systems. Tween 20 with a HLB value of 16.7 is most hydrophilic in nature, and therefore, it has minimum oil solubilization capacity, whereas the solubilization of oil increases as the hydrophobic chain length of surfactant increases (Table I; cf. HLB values of 14.9 and 15.0 for Tween 60 and Tween 80, respectively). Since the difference in the HLB values is very small, therefore, not much difference in the isotropic region of phase diagram has been observed.
Table I.
Physical Parameters of Tweens
| Chemical name | Molecular formula | Molecular weight (g mol−1) | HLB | Hydrophobic group |
|---|---|---|---|---|
| Tween 20 | C58H114O26 | 1,228 | 16.7 | Laurate (C12) |
| Tween 40 | C62H122O26 | 1,284 | 15.6 | Palmitate (C16) |
| Tween 60 | C64H126O26 | 1,312 | 14.9 | Sterate (C18) |
| Tween 80 | C58H124O26 | 1,310 | 15.0 | Oleate (C18) (double bond) |
Conductivity Measurements
Microemulsions undergo an intriguing phenomenon of electric percolation (where 100- to 1,000-fold increase in conductance is observed). The accepted model for the interpretation of the increasing conductivity is related to clustering of the microemulsion droplets and migration of charges within the aggregates. From the theoretical point of view, two approaches, i.e., static and dynamic, have been proposed for the mechanism leading to percolation (23). The concept of percolation is governed by scaling laws as given in Eqs. 2 and 3:
 |
2 |
 |
3 |
where A and B are free parameters and s and t are critical components. ω is the molar ratio of water to surfactant and ωc is the percolating molar ratio. The values of critical parameters in region above and below the threshold should be t = 1.9 and s = 0.6 according to static theory. However, due to the dynamic nature of the microemulsion, it has been theoretically and experimentally shown that both exponents are higher than those predicted for static case. Most of the reported s values lie in the range 0.7–1.6, whereas the value of t is more scattered (24).
Microemulsion with ω = 0.74 has been selected from isotropic region for further investigation. The results of variation of σ vs ω are shown in Fig. 3a for all the four Tween systems. The behavior exhibits profile characteristic of percolative conductivity for all the four Tween systems. The sudden increase in conductance has been observed with increase in water content. Both Tween 40 and 60 show gel formation early as compared to Tween 20 and 80 systems. In the present studied systems, the post-percolation stage shows a good agreement between the experimental and theoretical values as reported earlier (21). For Tween 80 microemulsion, values of s and t are found to be 1.26 and 0.67, predicting that the phenomena taking place is “static” in nature. Therefore, the formation of water continuous microemulsion (via bicontinuous microemulsion) from w/o on dilution has been predicted (22). Similar structural transitions also occur in Tween 20, 40, and 60 systems.
Fig. 3.

Comparison of conductivity of a Tween 20, 40, 60, and 80 microemulsion. b Tween 80 and drug-loaded microemulsion (ω = 0.74) as a function of ω
Since the four Tween systems show nearly similar behavior, only Tween 80 has been selected for comparative investigation with three-antiTB drugs, viz., RIF, INH, and PZA. Moreover, RIF has high solubility in Tween 80 (21). The variation of electric conductivity of pure and drug-loaded microemulsion (1 wt.%) as a function of ω has been depicted in Fig. 3b. A comparison of systems shows that drug incorporation does not affect the microstructure of the microemulsion; it only delays the gel formation and the percolating threshold, which is more significant for RIF and PZA. The effect of drug is negligible for w/o, but change is seen when transformation to o/w microemulsion has occurred on dilution.
The standard free energy of clustering  has been calculated from the relation
  , where Xd = nd/(nd + noil) is the mole fraction of droplets at percolation threshold and nd and noil are the number of moles of droplet and oil. A value of −4.35 kJ mol−1 of
  is obtained for pure system. On the other hand,
  is nearly the same (−5.17 kJ mol−1) for the three drug samples incorporated in the media. The
  values for pure and drug-loaded microemulsion support the spontaneity of droplet clustering.
Viscosity Measurements
The dependence of kinematic viscosity on ω is shown in Fig. 4a. The rapid change in the viscosity is probably due to the change in the microstructure of the microemulsion. The change in the internal structure is due to either the change in the shape of droplets or may be due to the transition from w/o to bicontinuous microemulsion. It is well known that increase of volume of dispersed phase in microemulsion increases the viscosity of the system (25). For the studied systems, viscosity also shows increase with increase in ω for all the four surfactant systems, which indicates a structural change from oil continuous to water continuous system (the latter has higher viscosities than the former) (26). The viscosity change with water content is further correlated to the compositional and structural effects derived from interfacial packing. The increase in viscosity measurement is sharper in the case of Tween 40, 60, and 80 as compared to Tween 20 (Fig. 4a). In general, Tween surfactants have different hydrophobic groups. However, Tween 40, 60, and 80 have bulkier side chains which are responsible for different interfacial packing, and thus, these systems show a sharper change in the viscosity values as compared to Tween 20. For higher ω values, the change in the viscosity is more obvious, i.e., formation of bicontinuous region occurs with dilution where the same amount of oil and water is present.
Fig. 4.

Variation of kinematic viscosity of a Tween 20, 40, 60, and 80 microemulsion. b Tween 80 and drug-loaded microemulsion as a function of ω
Since the viscosity is sensitive to interactions, a comparison has been made between pure and drug-loaded Tween 80 microemulsion systems (Fig. 4b). Difference in the viscosities is more profound at higher ω values for PZA and INH, whereas RIF shows change in viscosity at lower ω values. Since PZA and INH are hydrophilic drugs, more significant changes are seen when the system changes to o/w (at higher ω), and most of the drug is available in the continuum phase. The reverse is true for RIF, a highly hydrophobic drug which is mainly encapsulated in droplet at lower ω. Thus, the microemulsion system turns to be more viscous with addition of water and may help in the slow diffusion of drug with dilution.
Nearly similar trends of viscosity have been observed for all the three drug-loaded microemulsions with different Tweens (not shown here).
Optical Microscopy
An attempt has been made to look for the effect of dilution and presence of drug on the microstructure of microemulsion through optical measurements. Since the instrument lacks the image software, a precise droplet size determination could not be made, but efforts have been made to estimate the size at various objectives manually. The droplets formed are found in the 2- to 12-μm range (keeping in consideration the resolution limit of the instrument).
With increase in ω, the increment in the number of droplets is observed (i(b) in Fig. 5) as compared to the pure Tween 80 microemulsion (i(a) in Fig. 5). The initial clustering of droplets has been seen without any birefringence. Between ω = 1.34 and 2.50, the appearance of bicontinuous structure is clearly observable (i(c, d, e) in Fig. 5). “Percolation phenomena” is clearly visible as a function of ω and is in good agreement with previous methods. At higher ω, the formation of spherical droplets (i(f, g) in Fig. 5) has been observed again, which confirms the conversion of w/o microemulsion to o/w through bicontinuous structure. At infinite dilution, the formation of bigger droplets (i(h) in Fig. 5) emphasizes the creation of emulsion.
Fig. 5.

i Photomicrographs of freshly prepared samples of microemulsions with i variation in ω: a 0.74, b 1.05, c 1.34, d 1.92, e 2.50, f 3.08, g 3.67, h infinite dilution. ii INH, variation in ω: a 0.74, b 2.50, c 3.08. iii PZA, variation in ω: a 0.74, b 2.50, c 3.08. iv RIF, variation in ω: a 0.74, b 2.50, c 3.08
The microscopic images also clearly show that the presence of all the three different drugs in the microemulsion vehicle does not affect the microstructure of microemulsion. However, PZA and RIF show delay in percolation at ω = 2.50 (iii and iv in Fig. 5); the droplets are seen instead of a bicontinuous structure (this was in agreement with conductivity studies), whereas the presence of INH in microemulsion does not show any change with ω (ii in Fig. 5).
Oil/Buffer Partition Coefficient
Rifampicin belongs to BCS class II drug and has very poor aqueous solubility (0.1 mg/ml), whereas isoniazid and pyrazinamide are BCS class III drugs having high water solubility (27), i.e., 125 and 15 mg/ml, respectively. Using Eq. 1, the partition coefficient (LogP) of all the three drugs in oil/buffer of present composition have been estimated to be INH −1.12 ± 0.15, PZA −0.06 ± 0.15, and RIF 2.03 ± 0.1. The solubility of RIF is also high in both oleic acid (>250.0 mg/ml) and Tween 80 (22.0 mg/ml) (21). Based on the partition and solubility data, it can be concluded that hydrophobic RIF has highest affinity toward lipophilic component. INH, on the other hand, prefers hydrophilic environment.
FT-IR Spectra
FT-IR spectra have been recorded for all the four Tween microemulsions. The main emphasis has been laid on the position of OH stretching band since the first water molecules are mainly located as “interstitial” water bound to the surfactant polar head group (28,29). The position of OH band reveals the interactions. It has been found that the change of surfactant in the microemulsion does not affect the position of OH band. However, they absorb at lower frequency (3,397.9 cm−1) than pure water 3,400 cm−1, which infers that water molecules interact with surfactant molecules in the formulation.
The system has been studied as a function of increasing water content (ω variation). An increase in the wavenumber of OH band is obtained up to ω = 1.34 (Fig. 6); the value decreases abruptly and becomes continuous above ω = 1.95. It indicates that above ω = 1.95, the OH behaves as bulk or free water, thus indicating the change of water from dispersed phase to continuous. The initial increase in the wavenumber until ω = 1.34 is the result of weak interaction of water in the droplet with the surfactant head groups.
Fig. 6.

Variation of O–H stretching frequencies of water vs ω for Tween 80 microemulsion system
Incorporation of INH (0.5 and 1.0%) in the microemulsion system shows a negligible shift in the frequency of OH band (3,395.2 and 3,394.4 cm−1). Even the decrease in the intensity of OH band was not substantial. This means that the presence of drug is not influencing the water and surfactant head group interaction to a larger extent. This may be due to the lesser availability of drug molecules near the interface which are largely present in the continuum region (due to its high solubility in aqueous media). The addition of PZA (0.5 and 1.0%) in Tween 80 microemulsion showed OH band at 3,396.6 and 3,400.6 cm−1; these bands show weak interaction of surfactant with water molecules at higher concentration of PZA (i.e., 1%) as the stretching frequency increases with respect to pure microemulsion.
IR spectra of RIF-loaded (0.5 and 1.0%) microemulsion shift the frequency toward higher wavelength (3,409 and 3,478 cm−1, respectively) as compared to the other two drugs. Due to weak interaction between water and surfactant head group, an increase in the frequency is observed. In addition, this frequency shift may be due to lesser availability of surfactant molecules, which might be due to the replacement of surfactant molecules by drug molecules at the interface.
1H NMR
In the present Tween-based microemulsion system, the components have long hydrocarbon and oxyethylene groups. In order to avoid the complexity, 1H NMR spectra are thus recorded for pure surfactant in D2O with different drugs (0.5%). The data have been tabulated in Table II. The presence of INH in the surfactant system shows an insignificant change in the chemical shifts of different functional groups of Tween 80 (shown in Fig. 1b). This limits the possibility of the presence of drug near surfactant molecules. It may be concluded that most of the drug is present in the dispersion medium, with small amount near the interface.
Table II.
1H NMR Chemical Shifts of Tween 80 (Pure and with different Anti-TB Drugs)
| Functional group | δ (ppm) | Δδ (ppm) | |||||
|---|---|---|---|---|---|---|---|
| δ 0 | INH δ 0.5 | PZA δ 0.5 | RIF δ 0.5 | INH δ 0–0.5 | PZA δ 0–0.5 | RIF δ 0–0.5 | |
| C=C, 1CH | 5.2420 | 5.2430 | 5.2503 | 5.2496 | 0.0010 Downfield | 0.0083 Downfield | 0.0076 Downfield |
| α-CH2 4CH | 4.1287 | 4.1219 | 4.1352 | 4.1247 | 0.0068 | 0.0065 Downfield | 0.004 |
| (CH2CH2O)n | 3.6457 | 3.6162 | 3.7530 | 3.7876 | 0.0029 | 0.1073 Downfield | 0.1419 Downfield |
| α1-CH2 | 2.2378 | 2.2403 | 2.2460 | 2.2456 | 0.0025 Downfield | 0.0082 Downfield | 0.0078 Downfield |
| α2-CH | 1.9401 | 1.9411 | 1.9398 | 1.9442 | 0.0004 Downfield | 0.0009 | 0.0035 Downfield |
| β1-CH2 | 1.5109 | 1.5071 | 1.5128 | 1.5221 | 0.0038 | 0.1190 Downfield | 0.0112 Downfield |
| (CH2)n | 1.2307 | 1.2294 | 1.2359 | 1.2123 | 0.0013 | 0.0052 Downfield | 0.0184 |
| CH3 | 0.7904 | 0.7897 | 0.8107 | 0.8105 | 0.0004 | 0.0203 Downfield | 0.0201 Downfield |
For PZA and RIF, the shifts are apparent as compared to INH for all the functional groups. However, the significant change is for the oxyethylene group (CH2CH2O)n, β1-CH2, CH3, and (CH2)n. The change in chemical shifts in these functional moieties indicates the presence of PZA and RIF in the near proximity of surfactant molecules. Since the shifts are most significant for RIF, that indicates the probability of RIF being present at the interface.
Electronic Spectroscopy
ω variation (weight fraction of buffer is increased)
With increase in the value of ω, a significant shift in the wavelength (475 nm for RIF) and absorbance (toward lower value) of RIF has been observed (Fig. 7a). Although the peak shape remains the same, indicating the stability of RIF in the formulation, a small decrease in peak area has been observed. At lower ω value, the microemulsion exits as w/o form with RIF mainly lying in the continuum phase (21). The system shows higher absorbance because more RIF are available. At higher ω, the system changes to o/w type and the drug is now believed to be present in dispersed phase. The low absorbance of system at higher ω thus confirms the lesser availability of drug in the hydrophilic phase. This decrease in the absorbance of RIF can be correlated to structural changes occurring in the microemulsion system with dilution with hydrophilic component. Moreover, the wavelength of RIF at higher ω (at higher percent of buffer) is the same as pure drug in buffer.
-
(b)
Variation of oil weight percent (ω = 0.74)
Fig. 7.

Electronic spectra of RIF in Tween 80 microemulsion a as a function of ω. Inset Variation of absorbance with buffer (wt.%) b as a function of oil variation. Inset Variation of absorbance with oil (wt.%) c as a function of surfactant variation. Inset Variation of absorbance with surf: co-surf (wt.%)
RIF’s absorbance increases with increase in concentration of oil (Fig. 7b). The blue shift of wavelength confirms the drug–oil interactions. A significant increase in the peak area has also been observed.
-
(c)
Variation of surfactant + co-surfactant weight percent
As the weight percent of surfactant is raised in the system, no significant shift in wavelength is seen (Fig. 7c). However, decrease in the absorbance shows the presence of RIF at the interface.
Dilutability and Particle Size Analysis
The particle size analysis of the systems shows that the addition of INH and PZA decreases the size to 0.21 μm (mean) from that of 0.26 μm (mean) of pure ME. Although decrease in the particle size with addition of drug is not very significant, but, it is probably due to the deposition of some drug molecules at the interface affecting the mobility of surfactant and thus reducing the size. However, increase in size of droplet to 0.32 μm was found in the case of RIF, indicating the presence of drug in the droplet. The microemulsions of both pure and drug-loaded (1 wt.% drug) are tested for dilution effect. The formulations are found to remain stable on dilution up to 50% weight fraction of water and turn turbid on further dilution. This indicates that there is formation of heterogeneous coarse dispersion, i.e., formation of o/w emulsion from gradual transition of w/o microemulsion (30).
Dissolution Studies
Release Studies
The dissolution studies of three drug-loaded microemulsions have been carried out in hard gelatin capsules in buffer (pH 7.4) dissolution media (31,32). To access the accuracy of the method, three synthetic mixtures are prepared within the linearity range (5–50 µM), and percentage recoveries for each drug, i.e., RIF (98.7%), PZA (99.0%), and INH (99.2%) are obtained. Reasonable values of percentage recoveries show the validity of the procedure. The method is further utilized to evaluate the release from the microemulsion loaded with anti-TB drugs.
Figure 8 depicts the controlled release of drug. With time, the release of drug follows the order INH>PZA>RIF. It has been inferred that RIF, being highly hydrophobic, lies in lipophilic phase of o/w droplet and encounters maximum hindrance in release. In contrast, PZA molecules are present near the interface; so being out from the droplet, its release is faster as compared to RIF. As far as INH is concerned, due to its high solubility in water, most of the drug lies in continuum phase, resulting in the faster release of drug.
Fig. 8.

Comparative graph of release of RIF, INH, and PZA a in terms of concentration and b in terms of released percent from Tween 80 microemulsion
The release increases with time up to 30 min for all the three drugs and then becomes constant. The Mmax (maximum weight percent of drug) in 2 h is found to be 40, 35, and 10% for INH, PZA, and RIF, respectively. Such a low release of the drugs from microemulsion is because of the difficulty encountered during diffusion, which might be due to the gelling (resulting in higher viscosity) of microemulsion system. Therefore, this microemulsion formulation helps in increasing the dosage time.
The comparative release of all the three drugs along with the solubility and partition studies clearly depicts the presence of INH in continuum phase, RIF in the droplet, and PZA in the palisade layer of an o/w droplet. The release of all the three drugs in different Tweens showed the same release pattern as in the case of Tween 80.
The Kinetics of Release
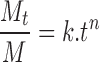
The kinetics of the release of drug is analyzed using the relationship:
 |
4 |
where Mt and M are the concentrations of the drug at time (t) and initial concentrations of drug, respectively (33). The ratio Mt/M is the fraction of drug that has been released at time t. The parameter k is a kinetic constant and n is the exponent related to the release mechanism termed as the diffusional exponent. The value of n should be equal to 0.5 for diffusional (Fickian) release, 1 for zero-order kinetics, and 0.5 < n < 1 for anomalous (non-Fickian) release. In the present system, k and n have been calculated from the intercept and slope of the straight line. The estimated value of n indicates that the release of PZA (n = 0.59296) and INH (n = 0.58750) from microemulsion is non-Fickian, whereas for RIF, it was found to be Fickian (21, 22), with n = 0.49226.
CONCLUSION
In the present work, the emphasis has been laid on the formulation of microemulsions with different Tween surfactants. Phase studies have been performed and the influence of structure of surfactant on the isotropic region has been studied. Among the four surfactants, Tween 80 has been used to load and perform the comparative analysis of all the three antitubercular drugs, viz., rifampicin, isoniazid, and pyrazinamide. Conductivity and viscosity measurements reveal that physicochemical properties do not alter with change in surfactant. No significant effect on the microstructure of microemulsion has been observed in the presence of drug. The microemulsion remains stable after the incorporation of drug (in terms of optical texture and phase separation). In addition, the particle size analysis indicates that the microemulsion changes into o/w emulsion at infinite dilution. The spectroscopic studies have been carried out to elucidate the position of drug molecule in microemulsion (along with the partition coefficient) and reveal that most of the INH molecules are present in the continuum region of an o/w microemulsion, RIF in the oil droplet, and PZA in the palisade layer of the droplet toward the outer side. Optical microscopy has been carried out with dilution of Tween 80 microemulsion, and the images clearly show the presence of “percolation phenomena” along with changes occurring in the microstructure, w/o to bicontinuous to o/w. Furthermore, the effect of the presence of drug on microstructure has also been studied through optical microscopy. Dissolution studies infer that the release of drug follows INH>PZA>RIF. In the present system, the release of INH and PZA from microemulsion has been found to be non-Fickian, whereas RIF release is Fickian in nature. The present Tween-based microemulsion appears beneficial for the delivery of all the three drugs in terms of easy preparation, low cost, controlled release, most importantly stability, and no precipitation of drugs. Such a microemulsion formulation can be used for fixed dose combination of first-line antitubercular drugs in future.
Acknowledgments
S.K.M. is thankful to DST India for financial assistance. GK is grateful to CSIR for Senior Research Fellowship. The authors are thankful to RSIC, Panjab University, Chandigarh for providing optical images using Leica microscope DM 3000 (Germany).
References
- 1.Chan J, El Maghraby GMM, Craig JP, Alany RG. Phase transition water-in-oil microemulsions as ocular drug delivery systems: in vitro and in vivo evaluation. Int J Pharm. 2007;328:65–71. doi: 10.1016/j.ijpharm.2006.10.004. [DOI] [PubMed] [Google Scholar]
- 2.Formariz TP, Chiavacci LA, Sarmento VHV, Franzini CM, Silva AA, Jr, Scarpa MV, Santilli CV, Egito EST, Oliveira AG. Structural changes of biocompatible neutral microemulsions stabilized by mixed surfactant containing soya phosphatidylcholine and their relationship with doxorubicin release. Colloids Surf B. 2008;63:287–295. doi: 10.1016/j.colsurfb.2007.12.021. [DOI] [PubMed] [Google Scholar]
- 3.Constantinides PP. Lipid microemulsion for improving drug dissolution and oral absorption: physical and biopharmaceutical aspects. Pharm Res. 1995;12:1561–1572. doi: 10.1023/A:1016268311867. [DOI] [PubMed] [Google Scholar]
- 4.Kummaro TR, Gurleym B, Khan MA, Reddy IK. Self-emulsifying drug delivery systems (SEMDDS) of co-enzyme Q10: formulation development and bioavailability assessment. Int J Pharm. 2001;212:233–246. doi: 10.1016/S0378-5173(00)00614-1. [DOI] [PubMed] [Google Scholar]
- 5.Nornoo AO, Osborne DW, Chow DSL. Cremophor-free intravenous microemulsions for paclitaxelI: formulation, cytotoxicity and hemolysis. Int J Pharm. 2008;349:108–116. doi: 10.1016/j.ijpharm.2007.07.042. [DOI] [PubMed] [Google Scholar]
- 6.Narang AS, Delmarre D, Gao D. Stable drug encapsulation in micelles and microemulsions. Int J Pharm. 2007;345:9–25. doi: 10.1016/j.ijpharm.2007.08.057. [DOI] [PubMed] [Google Scholar]
- 7.Winsor PA. Hydrotropy, solubilisation and related emulsification processes. J Chem Soc Faraday Trans. 1948;44(1):376–398. [Google Scholar]
- 8.Israelachvili JN, Mitchell DJ, Ninham BW. Theory of self-assembly of hydrocarbon amphiphiles into micelles and bilayers. J Chem Soc Faraday Trans II. 1976;72:1525–1567. doi: 10.1039/f29767201525. [DOI] [Google Scholar]
- 9.Kumar P, Mittal KL. Handbook of microemulsion: science and technology. New York: Marcel Dekker; 1999. [Google Scholar]
- 10.Lopez A, Linares F, Cortell C, Herraez M. Comparative enhancer effects of Span 20® with Tween 20® and Azone® on the in vitro percutaneous penetration of compounds with different lipophilicities. Int J Pharm. 2000;202:133–140. doi: 10.1016/S0378-5173(00)00427-0. [DOI] [PubMed] [Google Scholar]
- 11.Fang JY, Yu SY, Wu PC, Huang YB, Tsai YH. In vitro skin permeation of estradiol from various proniosome formulations. Int J Pharm. 2001;215:91–99. doi: 10.1016/S0378-5173(00)00669-4. [DOI] [PubMed] [Google Scholar]
- 12.Kibbe AH. Handbook of pharmaceutical excipients. 3. London: Pharmaceutical Press; 2000. [Google Scholar]
- 13.Lawerence MJ, Rees GD. Microemulsion based media as novel drug delivery systems. Adv Drug Deliv Rev. 2000;45:89–121. doi: 10.1016/S0169-409X(00)00103-4. [DOI] [PubMed] [Google Scholar]
- 14.Florence AT, Attwood D. Physicochemical principles of pharmacy. 3. London: Macmillan; 1998. [Google Scholar]
- 15.Kreuter J. Nanoparticles. In: Kreuter J, editor. Colloidal drug delivery systems. New York: Marcel Dekker; 1994. pp. 219–342. [Google Scholar]
- 16.Podlogar F, Gašperlin M, Tomšič M, Jamnik A, Bešter-Rogač M. Structural characterization of water–Tween 40®–Imwitor 308®–isopropyl myristate using different experimental methods. Int J Pharm. 2004;276:115–128. doi: 10.1016/j.ijpharm.2004.02.018. [DOI] [PubMed] [Google Scholar]
- 17.Lee JP, Langer R, Shastri VP. Novel microemulsion enchancer formulation for simultaneous transdermal delivery of hydrophilic and hydrophobic drugs. Pharm Res. 2003;20:264–269. doi: 10.1023/A:1022283423116. [DOI] [PubMed] [Google Scholar]
- 18.Podlogar F, Rogac MB, Gasperlin M. The effect of internal structure of selected water–Tween 40®–Imwitor 308®–IPM microemulsion on ketoprofene release. Int J Pharm. 2005;302:68. doi: 10.1016/j.ijpharm.2005.06.023. [DOI] [PubMed] [Google Scholar]
- 19.Guo R, Qian S, Zhu J, Qian J. The release of cephanone in CTAB/n-C5H11OH/H2O system. Colloid Polym Sci. 2006;284:468–474. doi: 10.1007/s00396-005-1336-z. [DOI] [Google Scholar]
- 20.Du Toit LC, Pillay V, Danckwerts MP. Tuberculosis chemotherapy: current drug delivery approaches. Resp Res. 2006;7:118–136. doi: 10.1186/1465-9921-7-118. [DOI] [PMC free article] [PubMed] [Google Scholar]
- 21.Mehta SK, Kaur G, Bhasin KK. Analysis of Tween based microemulsion in the presence of TB drug rifampicin. Colloid Surf B. 2007;60:95–104. doi: 10.1016/j.colsurfb.2007.06.012. [DOI] [PubMed] [Google Scholar]
- 22.Mehta SK, Kaur G, Bhasin KK. Incorporation of antitubercular drug isoniazid in pharmaceutically accepted microemulsion: effect on microstructure and physical parameters. Pharm Res. 2008;25:226–237. doi: 10.1007/s11095-007-9355-8. [DOI] [PubMed] [Google Scholar]
- 23.Lagourette B, Peyrelasse J, Boned C, Clausse M. Percolative conduction in microemulsion type systems. Nature. 1979;281:60–62. doi: 10.1038/281060b0. [DOI] [Google Scholar]
- 24.Mehta SK, Bala K. Volumetric and transport properties in microemulsions and the point of view of percolation theory. Phys Rev E. 1995;51:5732–5737. doi: 10.1103/PhysRevE.51.5732. [DOI] [PubMed] [Google Scholar]
- 25.Bennett KE, Hatfield JC, Davis HT, Macosko CW, Seriven LE. Viscosity and conductivity of microemulsions. In: Robb ID, editor. Microemulsions. New York: Plenum; 1982. pp. 65–84. [Google Scholar]
- 26.Mitra RK, Paul BK. Physicochemical investigations of microemulsification of eucalyptus oil and water using mixed surfactants (AOT+Brij35) and butanol. J Colloid Inter Sci. 2005;283:565–577. doi: 10.1016/j.jcis.2004.09.015. [DOI] [PubMed] [Google Scholar]
- 27.Kasim NA, Whitehouse M, Ramachandran C, Bermejo M, Lennerna H, Hussain AS, Junginger HE, Stavchansky SA, Midha KK, Shah VP, Amidon GL. Molecular properties of WHO essential drugs and provisional biopharmaceutical classification. Mol Pharm. 2004;1:85–96. doi: 10.1021/mp034006h. [DOI] [PubMed] [Google Scholar]
- 28.Aliotta F, Migliardo P, Donato DI, Liveri VT, Bardez E, Larry B. Local hydration effects in reversed micellar aggregation. Progr Colloid Polym Sci. 1992;89:258–262. doi: 10.1007/BFb0116324. [DOI] [Google Scholar]
- 29.Arcoleo V, Goffredi M, Liveri VT. Physicochemical characterization of copper(II) bis(2-ethylhexyl) sulfosuccinate reversed micelles. J Colloid Int Sci. 1998;198:216–223. doi: 10.1006/jcis.1997.5233. [DOI] [Google Scholar]
- 30.El-Laithy HM. Preparation and physicochemical characterization of dioctyl sodium dulfosuccinate (Aersol OT) microemulsion for oral drug delivery. AAPS PharmSci Tech. 2003;4(Article 11):1–10. doi: 10.1208/pt040111. [DOI] [PMC free article] [PubMed] [Google Scholar]
- 31.Wakiyama N, Juni K, Nakano M. Preparation and evaluation in vitro of polylactic acid microspheres containing local anesthetics. Chem Pharm Bull. 1981;29:3363–3368. doi: 10.1248/cpb.29.3363. [DOI] [PubMed] [Google Scholar]
- 32.Zhang L, Sun X, Zhang ZR. An investigation on liver-targeting microemulsions of norcantharidin. Drug Deliv. 2005;12:289–295. doi: 10.1080/10717540500176829. [DOI] [PubMed] [Google Scholar]
- 33.Washington C. Drug release from microdisperse systems: a critical review. Int J Pharm. 1990;58:1–12. doi: 10.1016/0378-5173(90)90280-H. [DOI] [Google Scholar]